Beeville, TX Map & Demographics
Beeville Map
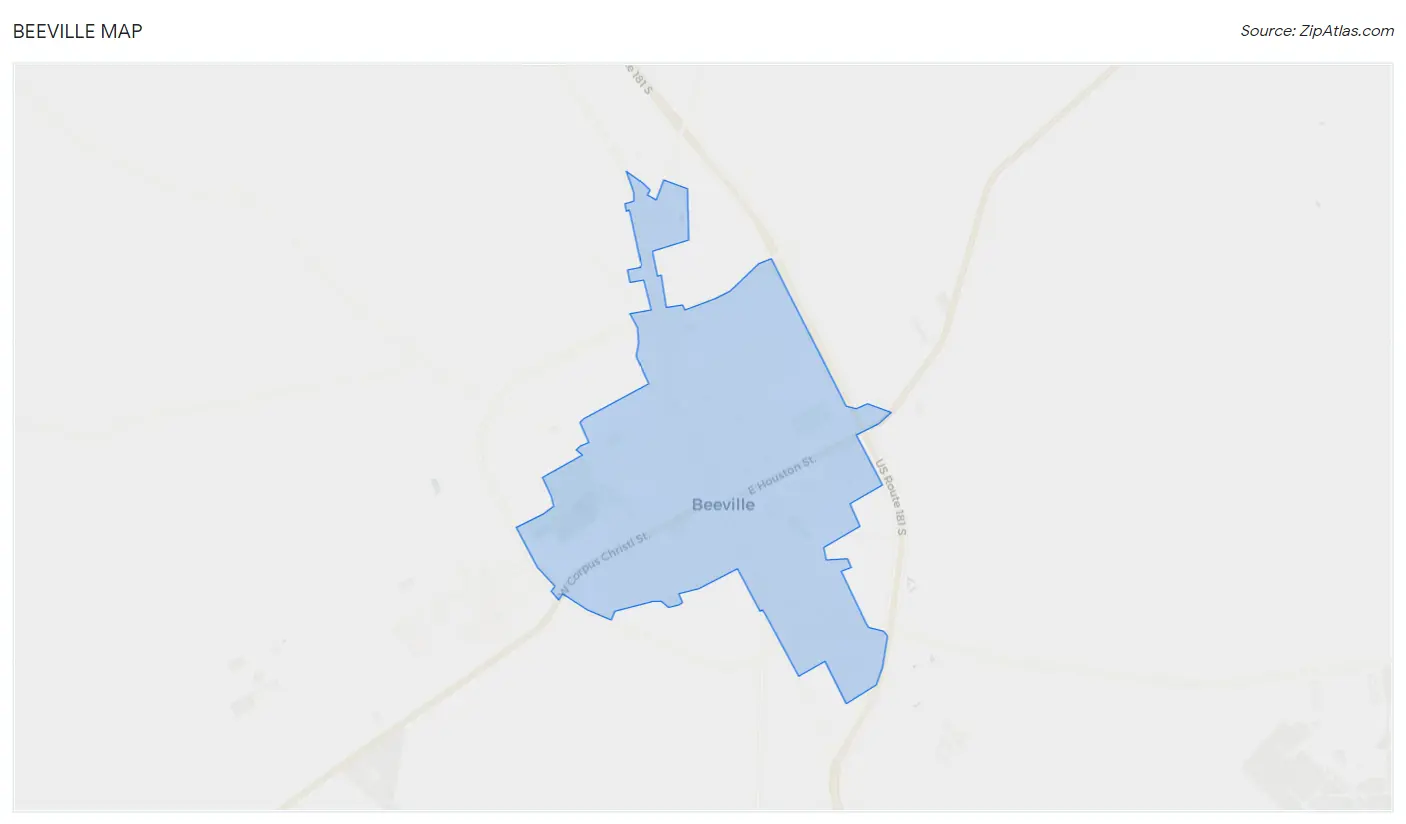
Beeville Overview
$23,481
PER CAPITA INCOME
$55,697
AVG FAMILY INCOME
$47,815
AVG HOUSEHOLD INCOME
47.7%
WAGE / INCOME GAP [ % ]
52.3¢/ $1
WAGE / INCOME GAP [ $ ]
0.49
INEQUALITY / GINI INDEX
13,637
TOTAL POPULATION
6,770
MALE POPULATION
6,867
FEMALE POPULATION
98.59
MALES / 100 FEMALES
101.43
FEMALES / 100 MALES
28.5
MEDIAN AGE
3.6
AVG FAMILY SIZE
2.8
AVG HOUSEHOLD SIZE
6,301
LABOR FORCE [ PEOPLE ]
61.7%
PERCENT IN LABOR FORCE
7.9%
UNEMPLOYMENT RATE
Beeville Area Codes
Income in Beeville
Income Overview in Beeville
Per Capita Income in Beeville is $23,481, while median incomes of families and households are $55,697 and $47,815 respectively.
| Characteristic | Number | Measure |
| Per Capita Income | 13,637 | $23,481 |
| Median Family Income | 2,995 | $55,697 |
| Mean Family Income | 2,995 | $75,668 |
| Median Household Income | 4,847 | $47,815 |
| Mean Household Income | 4,847 | $61,800 |
| Income Deficit | 2,995 | $0 |
| Wage / Income Gap (%) | 13,637 | 47.71% |
| Wage / Income Gap ($) | 13,637 | 52.29¢ per $1 |
| Gini / Inequality Index | 13,637 | 0.49 |
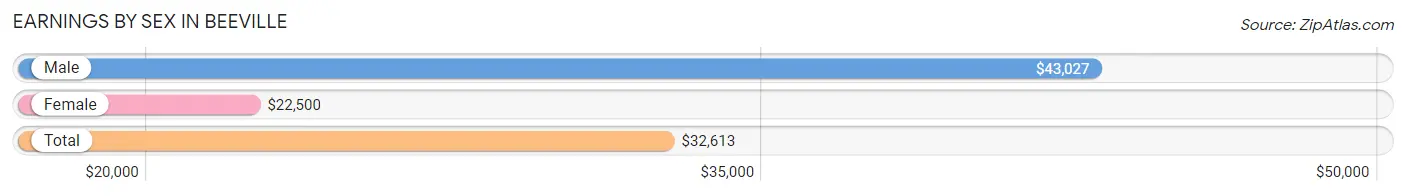
Earnings by Sex in Beeville
Average Earnings in Beeville are $32,613, $43,027 for men and $22,500 for women, a difference of 47.7%.
| Sex | Number | Average Earnings |
| Male | 3,443 (53.6%) | $43,027 |
| Female | 2,982 (46.4%) | $22,500 |
| Total | 6,425 (100.0%) | $32,613 |
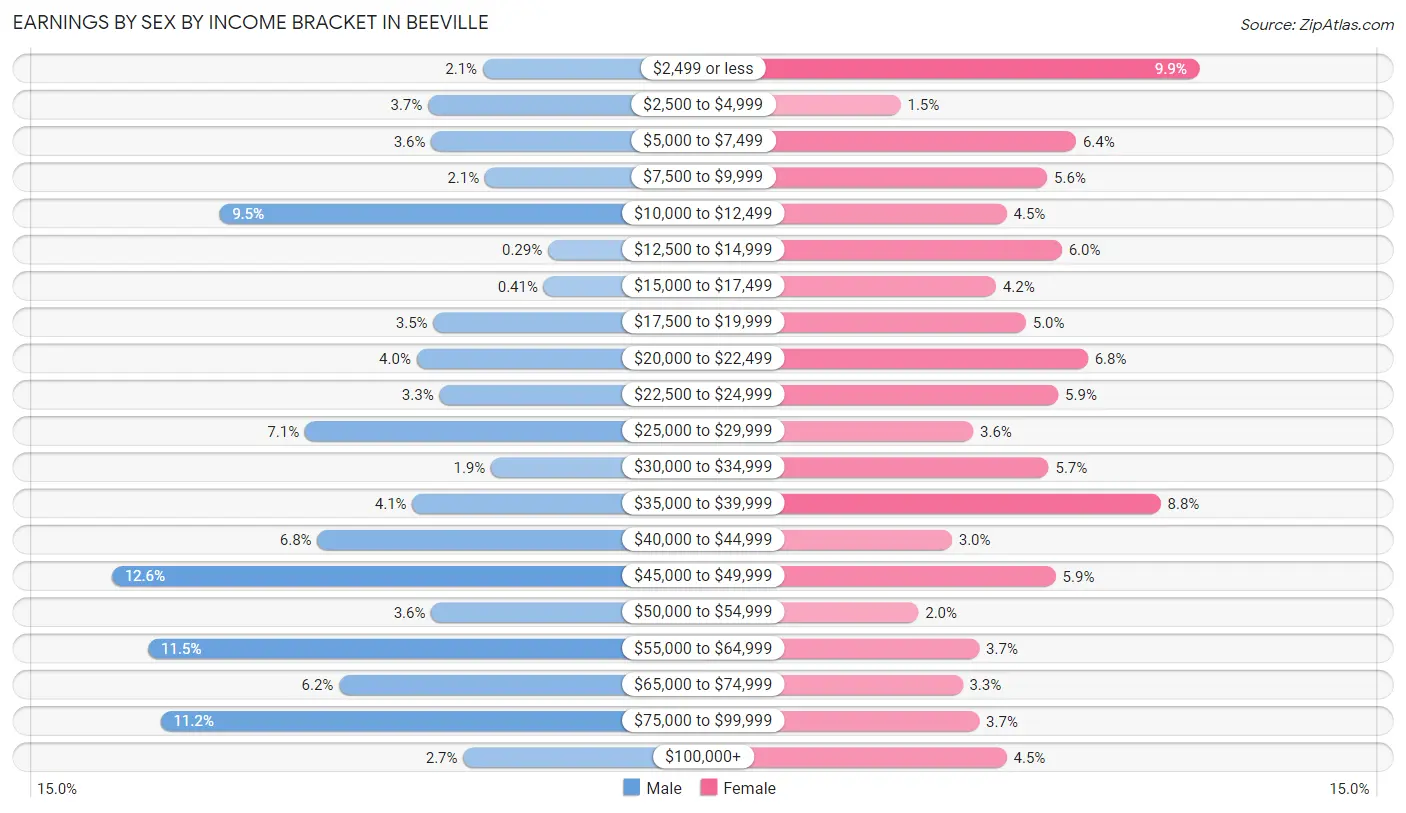
Earnings by Sex by Income Bracket in Beeville
The most common earnings brackets in Beeville are $45,000 to $49,999 for men (432 | 12.6%) and $2,499 or less for women (295 | 9.9%).
| Income | Male | Female |
| $2,499 or less | 73 (2.1%) | 295 (9.9%) |
| $2,500 to $4,999 | 126 (3.7%) | 45 (1.5%) |
| $5,000 to $7,499 | 123 (3.6%) | 192 (6.4%) |
| $7,500 to $9,999 | 71 (2.1%) | 168 (5.6%) |
| $10,000 to $12,499 | 328 (9.5%) | 134 (4.5%) |
| $12,500 to $14,999 | 10 (0.3%) | 180 (6.0%) |
| $15,000 to $17,499 | 14 (0.4%) | 125 (4.2%) |
| $17,500 to $19,999 | 121 (3.5%) | 150 (5.0%) |
| $20,000 to $22,499 | 137 (4.0%) | 202 (6.8%) |
| $22,500 to $24,999 | 115 (3.3%) | 177 (5.9%) |
| $25,000 to $29,999 | 245 (7.1%) | 106 (3.5%) |
| $30,000 to $34,999 | 65 (1.9%) | 169 (5.7%) |
| $35,000 to $39,999 | 141 (4.1%) | 263 (8.8%) |
| $40,000 to $44,999 | 233 (6.8%) | 88 (2.9%) |
| $45,000 to $49,999 | 432 (12.6%) | 175 (5.9%) |
| $50,000 to $54,999 | 123 (3.6%) | 60 (2.0%) |
| $55,000 to $64,999 | 397 (11.5%) | 111 (3.7%) |
| $65,000 to $74,999 | 212 (6.2%) | 97 (3.3%) |
| $75,000 to $99,999 | 385 (11.2%) | 111 (3.7%) |
| $100,000+ | 92 (2.7%) | 134 (4.5%) |
| Total | 3,443 (100.0%) | 2,982 (100.0%) |
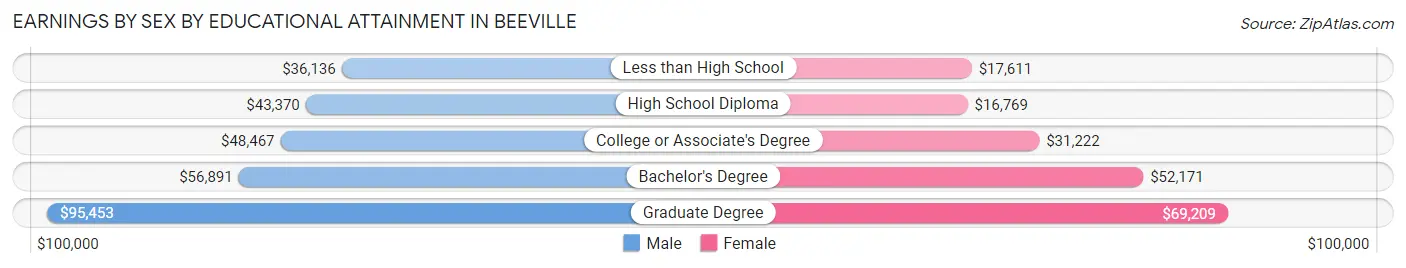
Earnings by Sex by Educational Attainment in Beeville
Average earnings in Beeville are $48,208 for men and $24,534 for women, a difference of 49.1%. Men with an educational attainment of graduate degree enjoy the highest average annual earnings of $95,453, while those with less than high school education earn the least with $36,136. Women with an educational attainment of graduate degree earn the most with the average annual earnings of $69,209, while those with high school diploma education have the smallest earnings of $16,769.
| Educational Attainment | Male Income | Female Income |
| Less than High School | $36,136 | $17,611 |
| High School Diploma | $43,370 | $16,769 |
| College or Associate's Degree | $48,467 | $31,222 |
| Bachelor's Degree | $56,891 | $52,171 |
| Graduate Degree | $95,453 | $69,209 |
| Total | $48,208 | $24,534 |
Family Income in Beeville
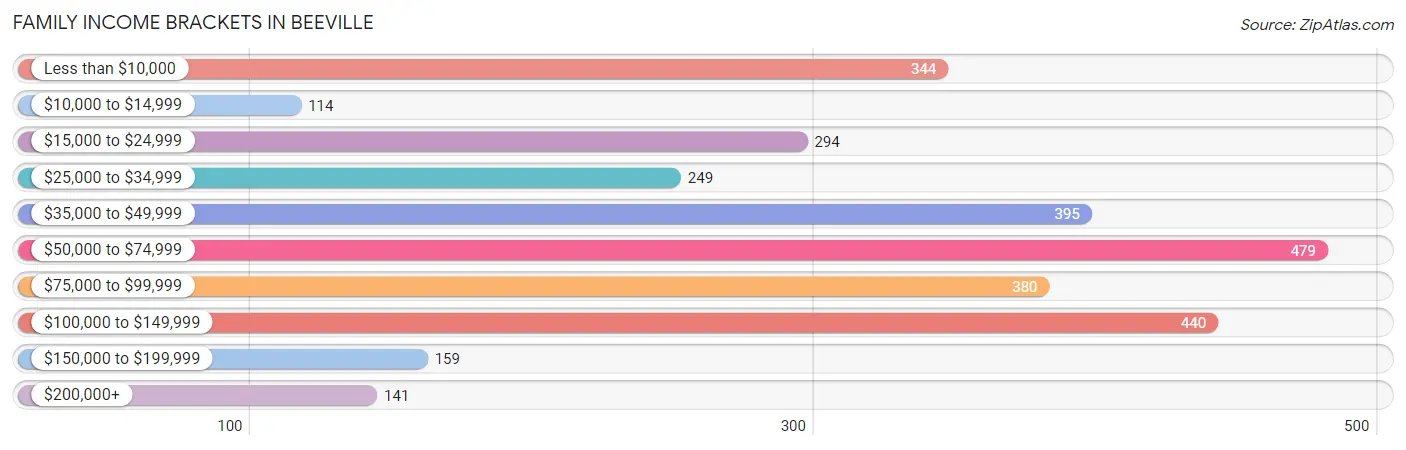
Family Income Brackets in Beeville
According to the Beeville family income data, there are 479 families falling into the $50,000 to $74,999 income range, which is the most common income bracket and makes up 16.0% of all families. Conversely, the $10,000 to $14,999 income bracket is the least frequent group with only 114 families (3.8%) belonging to this category.
| Income Bracket | # Families | % Families |
| Less than $10,000 | 344 | 11.5% |
| $10,000 to $14,999 | 114 | 3.8% |
| $15,000 to $24,999 | 294 | 9.8% |
| $25,000 to $34,999 | 249 | 8.3% |
| $35,000 to $49,999 | 395 | 13.2% |
| $50,000 to $74,999 | 479 | 16.0% |
| $75,000 to $99,999 | 380 | 12.7% |
| $100,000 to $149,999 | 440 | 14.7% |
| $150,000 to $199,999 | 159 | 5.3% |
| $200,000+ | 141 | 4.7% |
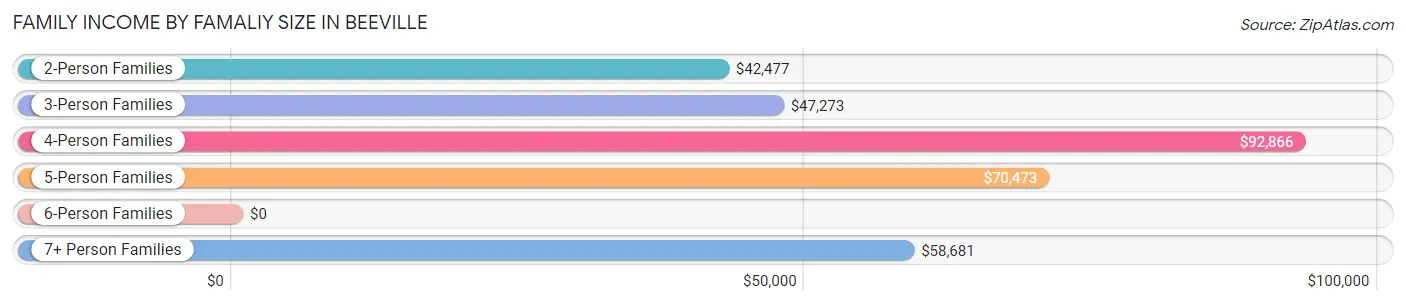
Family Income by Famaliy Size in Beeville
4-person families (755 | 25.2%) account for the highest median family income in Beeville with $92,866 per family, while 4-person families (755 | 25.2%) have the highest median income of $23,216 per family member.
| Income Bracket | # Families | Median Income |
| 2-Person Families | 1,086 (36.3%) | $42,477 |
| 3-Person Families | 602 (20.1%) | $47,273 |
| 4-Person Families | 755 (25.2%) | $92,866 |
| 5-Person Families | 258 (8.6%) | $70,473 |
| 6-Person Families | 245 (8.2%) | $0 |
| 7+ Person Families | 49 (1.6%) | $58,681 |
| Total | 2,995 (100.0%) | $55,697 |
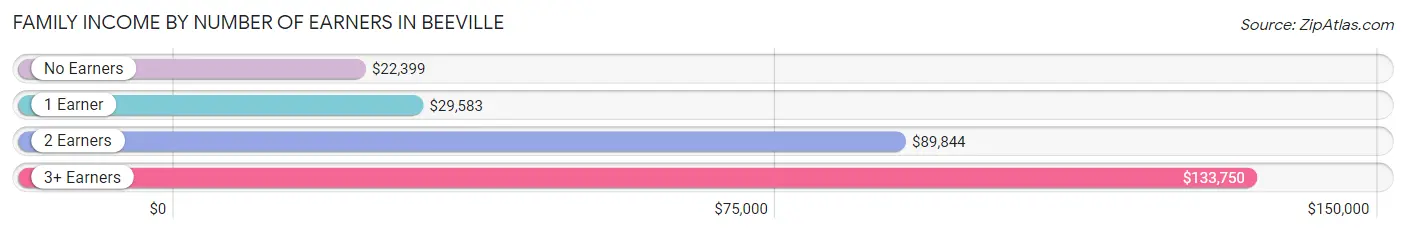
Family Income by Number of Earners in Beeville
The median family income in Beeville is $55,697, with families comprising 3+ earners (276) having the highest median family income of $133,750, while families with no earners (329) have the lowest median family income of $22,399, accounting for 9.2% and 11.0% of families, respectively.
| Number of Earners | # Families | Median Income |
| No Earners | 329 (11.0%) | $22,399 |
| 1 Earner | 1,402 (46.8%) | $29,583 |
| 2 Earners | 988 (33.0%) | $89,844 |
| 3+ Earners | 276 (9.2%) | $133,750 |
| Total | 2,995 (100.0%) | $55,697 |
Household Income in Beeville
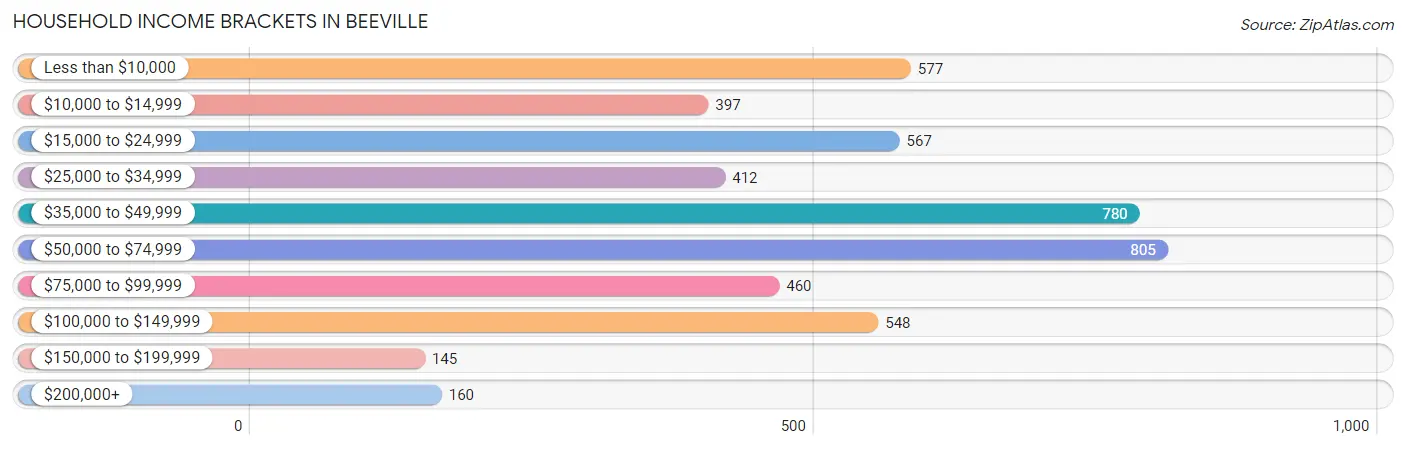
Household Income Brackets in Beeville
With 805 households falling in the category, the $50,000 to $74,999 income range is the most frequent in Beeville, accounting for 16.6% of all households. In contrast, only 145 households (3.0%) fall into the $150,000 to $199,999 income bracket, making it the least populous group.
| Income Bracket | # Households | % Households |
| Less than $10,000 | 577 | 11.9% |
| $10,000 to $14,999 | 397 | 8.2% |
| $15,000 to $24,999 | 567 | 11.7% |
| $25,000 to $34,999 | 412 | 8.5% |
| $35,000 to $49,999 | 780 | 16.1% |
| $50,000 to $74,999 | 805 | 16.6% |
| $75,000 to $99,999 | 460 | 9.5% |
| $100,000 to $149,999 | 548 | 11.3% |
| $150,000 to $199,999 | 145 | 3.0% |
| $200,000+ | 160 | 3.3% |
Household Income by Householder Age in Beeville
The median household income in Beeville is $47,815, with the highest median household income of $57,024 found in the 45 to 64 years age bracket for the primary householder. A total of 1,314 households (27.1%) fall into this category. Meanwhile, the 15 to 24 years age bracket for the primary householder has the lowest median household income of $0, with 198 households (4.1%) in this group.
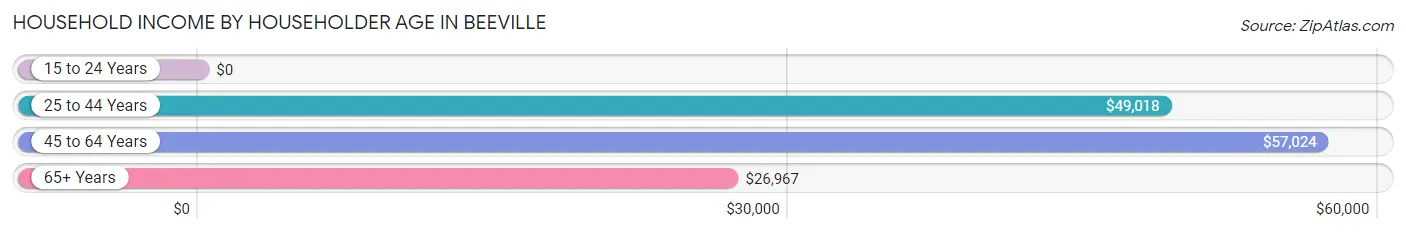
| Income Bracket | # Households | Median Income |
| 15 to 24 Years | 198 (4.1%) | $0 |
| 25 to 44 Years | 2,157 (44.5%) | $49,018 |
| 45 to 64 Years | 1,314 (27.1%) | $57,024 |
| 65+ Years | 1,178 (24.3%) | $26,967 |
| Total | 4,847 (100.0%) | $47,815 |
Poverty in Beeville
Income Below Poverty by Sex and Age in Beeville
With 20.6% poverty level for males and 32.8% for females among the residents of Beeville, 5 year old males and under 5 year old females are the most vulnerable to poverty, with 102 males (47.9%) and 393 females (77.1%) in their respective age groups living below the poverty level.
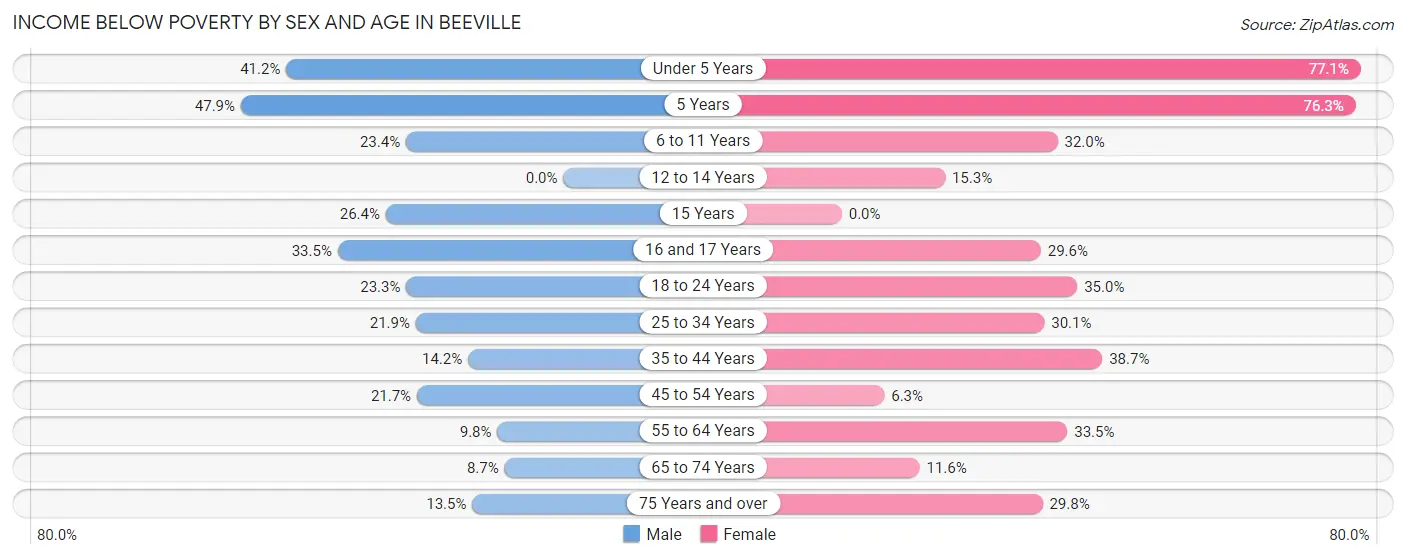
| Age Bracket | Male | Female |
| Under 5 Years | 179 (41.1%) | 393 (77.1%) |
| 5 Years | 102 (47.9%) | 74 (76.3%) |
| 6 to 11 Years | 115 (23.4%) | 290 (32.0%) |
| 12 to 14 Years | 0 (0.0%) | 36 (15.3%) |
| 15 Years | 24 (26.4%) | 0 (0.0%) |
| 16 and 17 Years | 67 (33.5%) | 39 (29.5%) |
| 18 to 24 Years | 219 (23.3%) | 251 (35.0%) |
| 25 to 34 Years | 293 (21.9%) | 319 (30.1%) |
| 35 to 44 Years | 87 (14.1%) | 379 (38.7%) |
| 45 to 54 Years | 135 (21.7%) | 27 (6.3%) |
| 55 to 64 Years | 53 (9.8%) | 216 (33.5%) |
| 65 to 74 Years | 51 (8.7%) | 55 (11.6%) |
| 75 Years and over | 38 (13.5%) | 118 (29.8%) |
| Total | 1,363 (20.6%) | 2,197 (32.8%) |
Income Above Poverty by Sex and Age in Beeville
According to the poverty statistics in Beeville, males aged 12 to 14 years and females aged 15 years are the age groups that are most secure financially, with 100.0% of males and 100.0% of females in these age groups living above the poverty line.
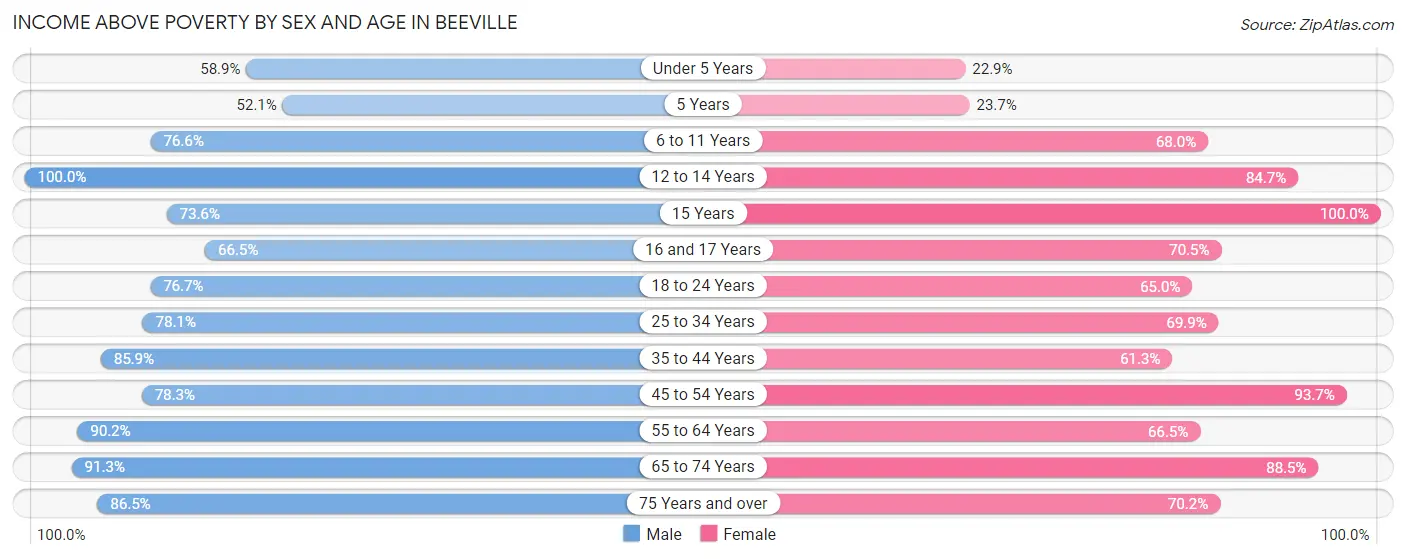
| Age Bracket | Male | Female |
| Under 5 Years | 256 (58.9%) | 117 (22.9%) |
| 5 Years | 111 (52.1%) | 23 (23.7%) |
| 6 to 11 Years | 377 (76.6%) | 615 (68.0%) |
| 12 to 14 Years | 259 (100.0%) | 199 (84.7%) |
| 15 Years | 67 (73.6%) | 125 (100.0%) |
| 16 and 17 Years | 133 (66.5%) | 93 (70.5%) |
| 18 to 24 Years | 720 (76.7%) | 467 (65.0%) |
| 25 to 34 Years | 1,044 (78.1%) | 742 (69.9%) |
| 35 to 44 Years | 528 (85.9%) | 601 (61.3%) |
| 45 to 54 Years | 486 (78.3%) | 401 (93.7%) |
| 55 to 64 Years | 488 (90.2%) | 429 (66.5%) |
| 65 to 74 Years | 533 (91.3%) | 421 (88.4%) |
| 75 Years and over | 243 (86.5%) | 278 (70.2%) |
| Total | 5,245 (79.4%) | 4,511 (67.2%) |
Income Below Poverty Among Married-Couple Families in Beeville
The poverty statistics for married-couple families in Beeville show that 19.6% or 378 of the total 1,931 families live below the poverty line. Families with 5 or more children have the highest poverty rate of 47.1%, comprising of 16 families. On the other hand, families with no children have the lowest poverty rate of 6.9%, which includes 53 families.
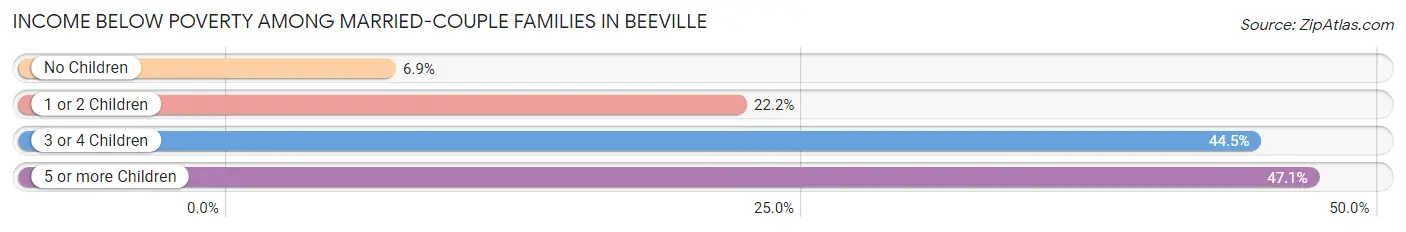
| Children | Above Poverty | Below Poverty |
| No Children | 717 (93.1%) | 53 (6.9%) |
| 1 or 2 Children | 671 (77.8%) | 191 (22.2%) |
| 3 or 4 Children | 147 (55.5%) | 118 (44.5%) |
| 5 or more Children | 18 (52.9%) | 16 (47.1%) |
| Total | 1,553 (80.4%) | 378 (19.6%) |
Income Below Poverty Among Single-Parent Households in Beeville
According to the poverty data in Beeville, 5.1% or 18 single-father households and 49.6% or 354 single-mother households are living below the poverty line. Among single-father households, those with 1 or 2 children have the highest poverty rate, with 11 households (10.7%) experiencing poverty. Likewise, among single-mother households, those with 5 or more children have the highest poverty rate, with 20 households (100.0%) falling below the poverty line.
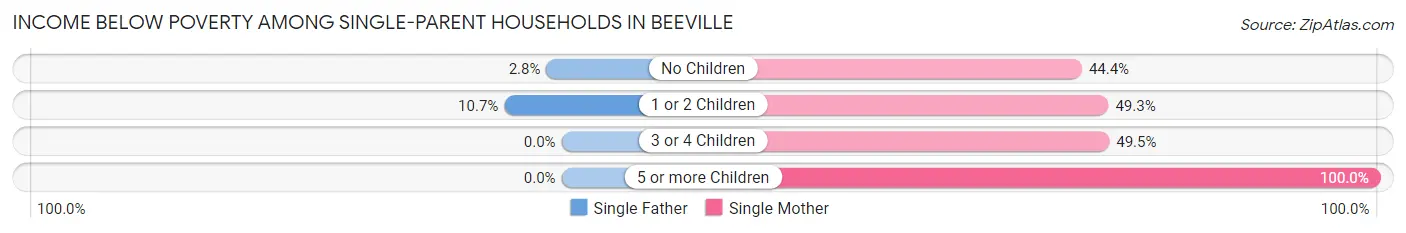
| Children | Single Father | Single Mother |
| No Children | 7 (2.8%) | 71 (44.4%) |
| 1 or 2 Children | 11 (10.7%) | 216 (49.3%) |
| 3 or 4 Children | 0 (0.0%) | 47 (49.5%) |
| 5 or more Children | 0 (0.0%) | 20 (100.0%) |
| Total | 18 (5.1%) | 354 (49.6%) |
Income Below Poverty Among Married-Couple vs Single-Parent Households in Beeville
The poverty data for Beeville shows that 378 of the married-couple family households (19.6%) and 372 of the single-parent households (35.0%) are living below the poverty level. Within the married-couple family households, those with 5 or more children have the highest poverty rate, with 16 households (47.1%) falling below the poverty line. Among the single-parent households, those with 5 or more children have the highest poverty rate, with 20 household (100.0%) living below poverty.
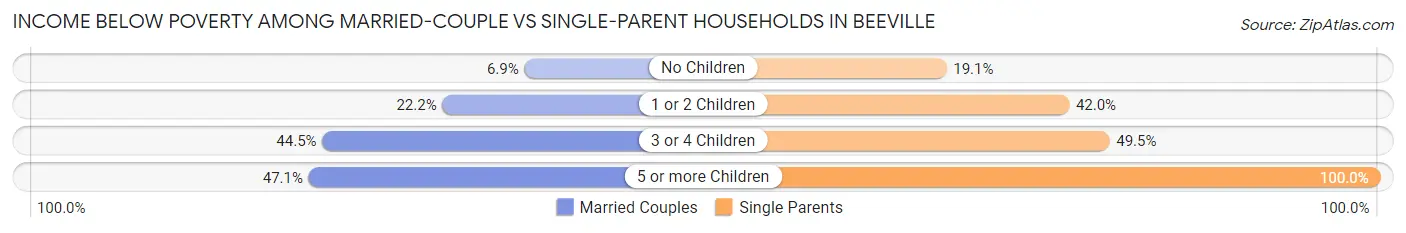
| Children | Married-Couple Families | Single-Parent Households |
| No Children | 53 (6.9%) | 78 (19.1%) |
| 1 or 2 Children | 191 (22.2%) | 227 (42.0%) |
| 3 or 4 Children | 118 (44.5%) | 47 (49.5%) |
| 5 or more Children | 16 (47.1%) | 20 (100.0%) |
| Total | 378 (19.6%) | 372 (35.0%) |
Race in Beeville
The most populous races in Beeville are Hispanic or Latino (9,896 | 72.6%), White / Caucasian (9,599 | 70.4%), and Two or more Races (2,356 | 17.3%).
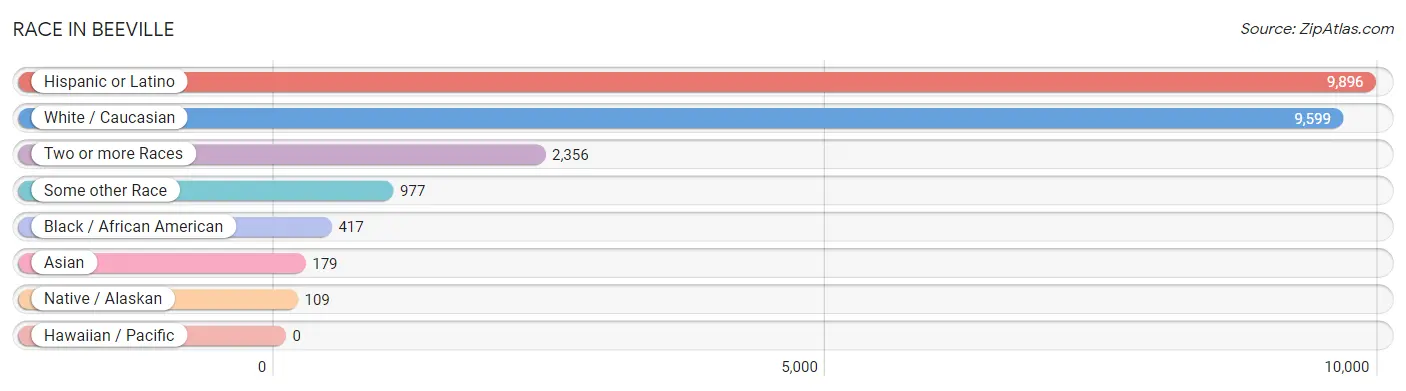
| Race | # Population | % Population |
| Asian | 179 | 1.3% |
| Black / African American | 417 | 3.1% |
| Hawaiian / Pacific | 0 | 0.0% |
| Hispanic or Latino | 9,896 | 72.6% |
| Native / Alaskan | 109 | 0.8% |
| White / Caucasian | 9,599 | 70.4% |
| Two or more Races | 2,356 | 17.3% |
| Some other Race | 977 | 7.2% |
| Total | 13,637 | 100.0% |
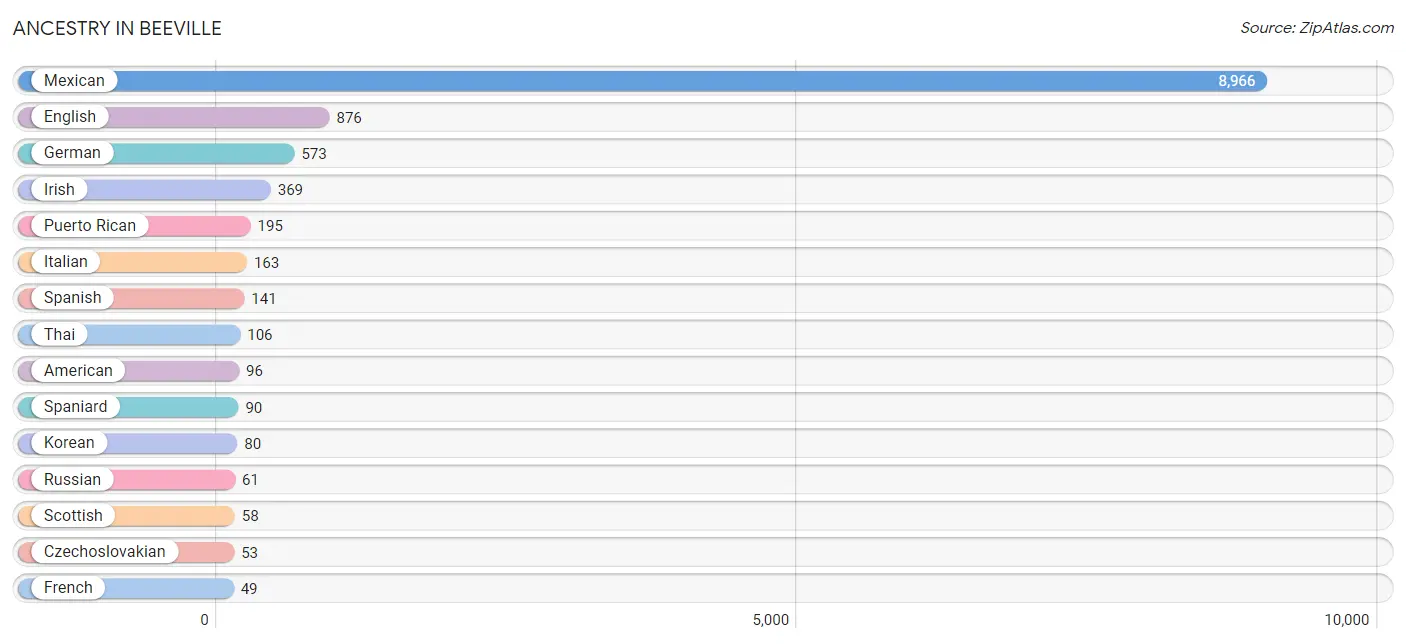
Ancestry in Beeville
The most populous ancestries reported in Beeville are Mexican (8,966 | 65.7%), English (876 | 6.4%), German (573 | 4.2%), Irish (369 | 2.7%), and Puerto Rican (195 | 1.4%), together accounting for 80.5% of all Beeville residents.
| Ancestry | # Population | % Population |
| American | 96 | 0.7% |
| Arab | 35 | 0.3% |
| Blackfeet | 11 | 0.1% |
| British | 42 | 0.3% |
| Burmese | 6 | 0.0% |
| Central American | 37 | 0.3% |
| Cherokee | 13 | 0.1% |
| Costa Rican | 10 | 0.1% |
| Cuban | 8 | 0.1% |
| Czech | 46 | 0.3% |
| Czechoslovakian | 53 | 0.4% |
| Eastern European | 5 | 0.0% |
| English | 876 | 6.4% |
| European | 13 | 0.1% |
| Finnish | 30 | 0.2% |
| French | 49 | 0.4% |
| French Canadian | 42 | 0.3% |
| German | 573 | 4.2% |
| Greek | 19 | 0.1% |
| Indian (Asian) | 18 | 0.1% |
| Irish | 369 | 2.7% |
| Italian | 163 | 1.2% |
| Korean | 80 | 0.6% |
| Laotian | 11 | 0.1% |
| Lebanese | 35 | 0.3% |
| Mexican | 8,966 | 65.7% |
| Mexican American Indian | 23 | 0.2% |
| Navajo | 34 | 0.3% |
| Norwegian | 5 | 0.0% |
| Polish | 44 | 0.3% |
| Portuguese | 6 | 0.0% |
| Puerto Rican | 195 | 1.4% |
| Russian | 61 | 0.4% |
| Salvadoran | 27 | 0.2% |
| Scandinavian | 42 | 0.3% |
| Scotch-Irish | 22 | 0.2% |
| Scottish | 58 | 0.4% |
| Spaniard | 90 | 0.7% |
| Spanish | 141 | 1.0% |
| Subsaharan African | 6 | 0.0% |
| Swedish | 22 | 0.2% |
| Thai | 106 | 0.8% |
| Welsh | 10 | 0.1% | View All 43 Rows |
Immigrants in Beeville
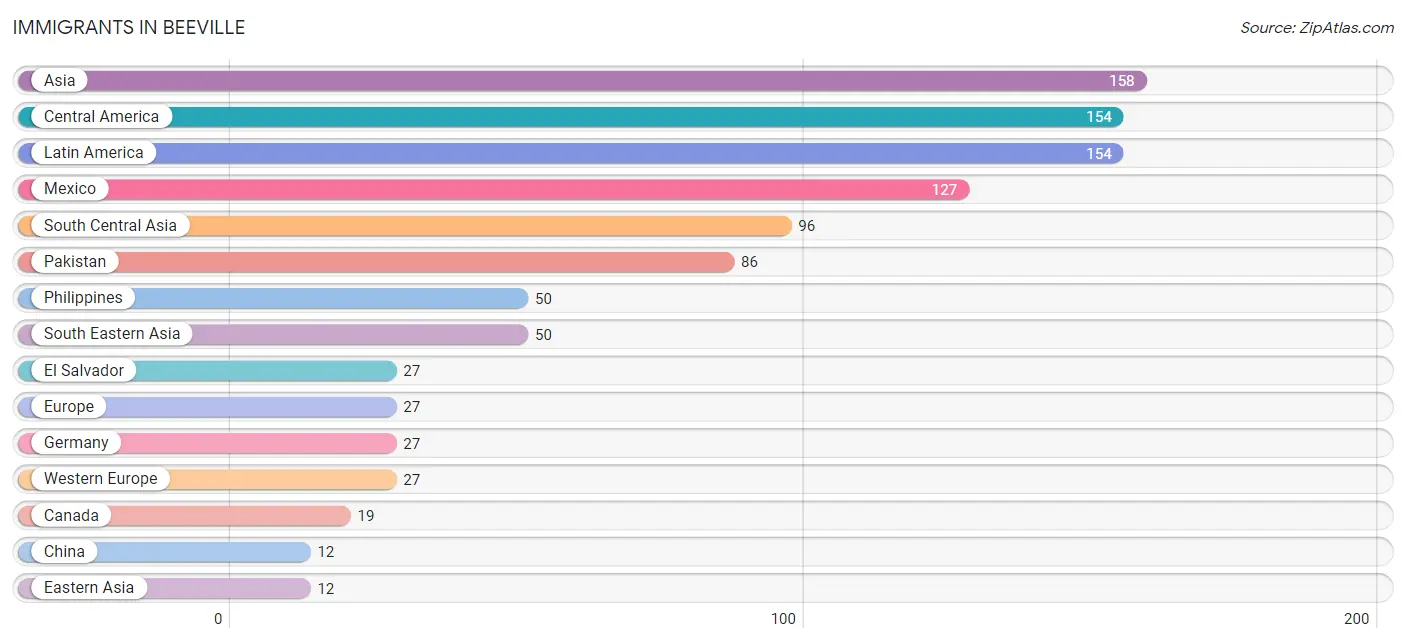
The most numerous immigrant groups reported in Beeville came from Asia (158 | 1.2%), Central America (154 | 1.1%), Latin America (154 | 1.1%), Mexico (127 | 0.9%), and South Central Asia (96 | 0.7%), together accounting for 5.0% of all Beeville residents.
| Immigration Origin | # Population | % Population |
| Africa | 10 | 0.1% |
| Asia | 158 | 1.2% |
| Canada | 19 | 0.1% |
| Central America | 154 | 1.1% |
| China | 12 | 0.1% |
| Eastern Africa | 10 | 0.1% |
| Eastern Asia | 12 | 0.1% |
| El Salvador | 27 | 0.2% |
| Europe | 27 | 0.2% |
| Germany | 27 | 0.2% |
| India | 10 | 0.1% |
| Kenya | 10 | 0.1% |
| Latin America | 154 | 1.1% |
| Mexico | 127 | 0.9% |
| Pakistan | 86 | 0.6% |
| Philippines | 50 | 0.4% |
| South Central Asia | 96 | 0.7% |
| South Eastern Asia | 50 | 0.4% |
| Western Europe | 27 | 0.2% | View All 19 Rows |
Sex and Age in Beeville
Sex and Age in Beeville
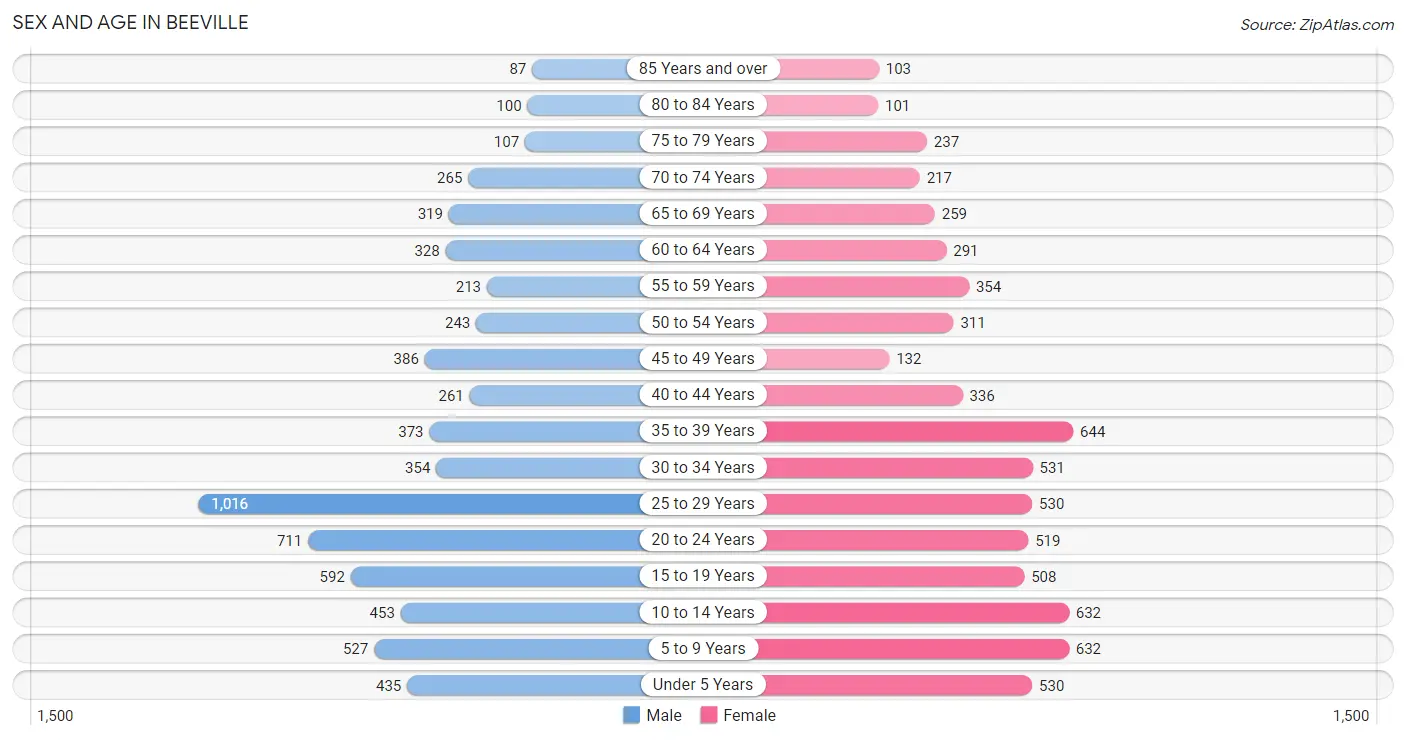
The most populous age groups in Beeville are 25 to 29 Years (1,016 | 15.0%) for men and 35 to 39 Years (644 | 9.4%) for women.
| Age Bracket | Male | Female |
| Under 5 Years | 435 (6.4%) | 530 (7.7%) |
| 5 to 9 Years | 527 (7.8%) | 632 (9.2%) |
| 10 to 14 Years | 453 (6.7%) | 632 (9.2%) |
| 15 to 19 Years | 592 (8.7%) | 508 (7.4%) |
| 20 to 24 Years | 711 (10.5%) | 519 (7.6%) |
| 25 to 29 Years | 1,016 (15.0%) | 530 (7.7%) |
| 30 to 34 Years | 354 (5.2%) | 531 (7.7%) |
| 35 to 39 Years | 373 (5.5%) | 644 (9.4%) |
| 40 to 44 Years | 261 (3.9%) | 336 (4.9%) |
| 45 to 49 Years | 386 (5.7%) | 132 (1.9%) |
| 50 to 54 Years | 243 (3.6%) | 311 (4.5%) |
| 55 to 59 Years | 213 (3.2%) | 354 (5.2%) |
| 60 to 64 Years | 328 (4.8%) | 291 (4.2%) |
| 65 to 69 Years | 319 (4.7%) | 259 (3.8%) |
| 70 to 74 Years | 265 (3.9%) | 217 (3.2%) |
| 75 to 79 Years | 107 (1.6%) | 237 (3.5%) |
| 80 to 84 Years | 100 (1.5%) | 101 (1.5%) |
| 85 Years and over | 87 (1.3%) | 103 (1.5%) |
| Total | 6,770 (100.0%) | 6,867 (100.0%) |
Families and Households in Beeville
Median Family Size in Beeville
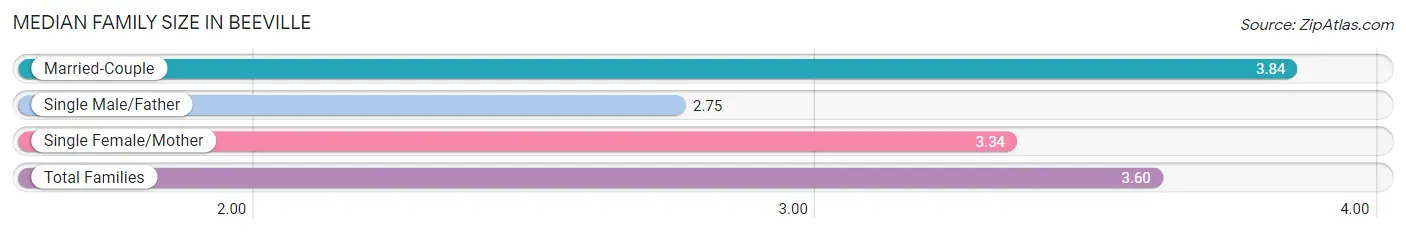
The median family size in Beeville is 3.60 persons per family, with married-couple families (1,931 | 64.5%) accounting for the largest median family size of 3.84 persons per family. On the other hand, single male/father families (351 | 11.7%) represent the smallest median family size with 2.75 persons per family.
| Family Type | # Families | Family Size |
| Married-Couple | 1,931 (64.5%) | 3.84 |
| Single Male/Father | 351 (11.7%) | 2.75 |
| Single Female/Mother | 713 (23.8%) | 3.34 |
| Total Families | 2,995 (100.0%) | 3.60 |
Median Household Size in Beeville
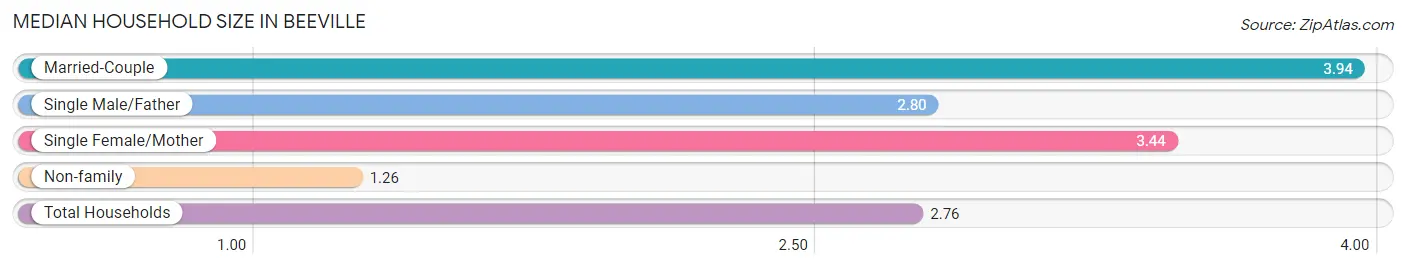
The median household size in Beeville is 2.76 persons per household, with married-couple households (1,931 | 39.8%) accounting for the largest median household size of 3.94 persons per household. non-family households (1,852 | 38.2%) represent the smallest median household size with 1.26 persons per household.
| Household Type | # Households | Household Size |
| Married-Couple | 1,931 (39.8%) | 3.94 |
| Single Male/Father | 351 (7.2%) | 2.80 |
| Single Female/Mother | 713 (14.7%) | 3.44 |
| Non-family | 1,852 (38.2%) | 1.26 |
| Total Households | 4,847 (100.0%) | 2.76 |
Household Size by Marriage Status in Beeville
Out of a total of 4,847 households in Beeville, 2,995 (61.8%) are family households, while 1,852 (38.2%) are nonfamily households. The most numerous type of family households are 2-person households, comprising 1,086, and the most common type of nonfamily households are 1-person households, comprising 1,518.
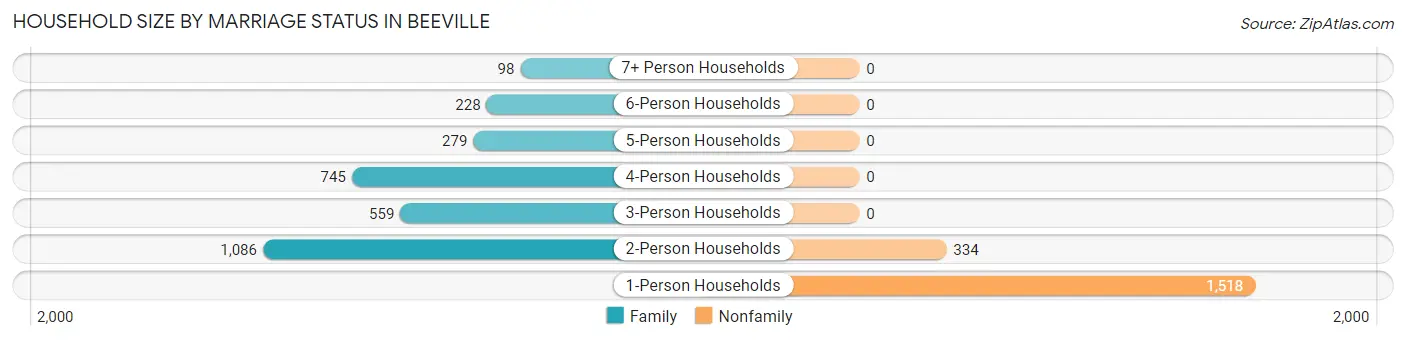
| Household Size | Family Households | Nonfamily Households |
| 1-Person Households | - | 1,518 (31.3%) |
| 2-Person Households | 1,086 (22.4%) | 334 (6.9%) |
| 3-Person Households | 559 (11.5%) | 0 (0.0%) |
| 4-Person Households | 745 (15.4%) | 0 (0.0%) |
| 5-Person Households | 279 (5.8%) | 0 (0.0%) |
| 6-Person Households | 228 (4.7%) | 0 (0.0%) |
| 7+ Person Households | 98 (2.0%) | 0 (0.0%) |
| Total | 2,995 (61.8%) | 1,852 (38.2%) |
Female Fertility in Beeville
Fertility by Age in Beeville
Average fertility rate in Beeville is 62.0 births per 1,000 women. Women in the age bracket of 20 to 34 years have the highest fertility rate with 68.0 births per 1,000 women. Women in the age bracket of 20 to 34 years acount for 54.3% of all women with births.
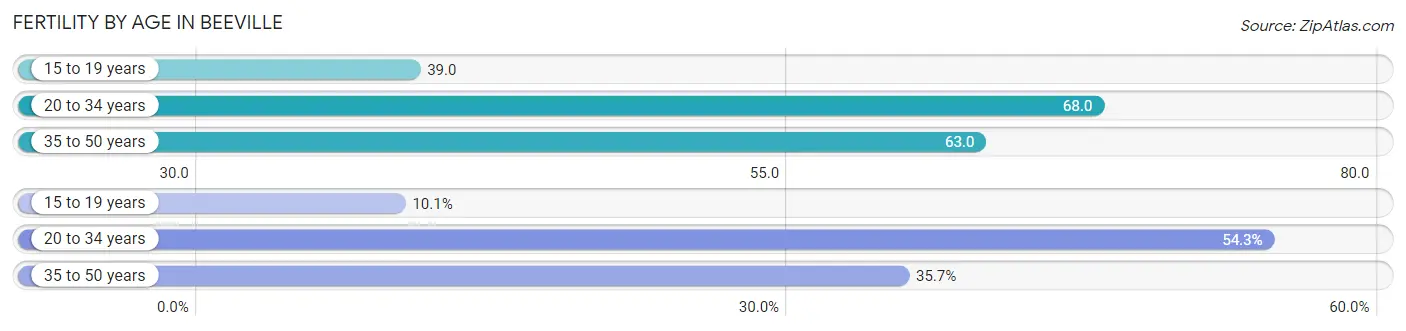
| Age Bracket | Women with Births | Births / 1,000 Women |
| 15 to 19 years | 20 (10.1%) | 39.0 |
| 20 to 34 years | 108 (54.3%) | 68.0 |
| 35 to 50 years | 71 (35.7%) | 63.0 |
| Total | 199 (100.0%) | 62.0 |
Fertility by Age by Marriage Status in Beeville
48.2% of women with births (199) in Beeville are married. The highest percentage of unmarried women with births falls into 15 to 19 years age bracket with 100.0% of them unmarried at the time of birth, while the lowest percentage of unmarried women with births belong to 20 to 34 years age bracket with 19.4% of them unmarried.
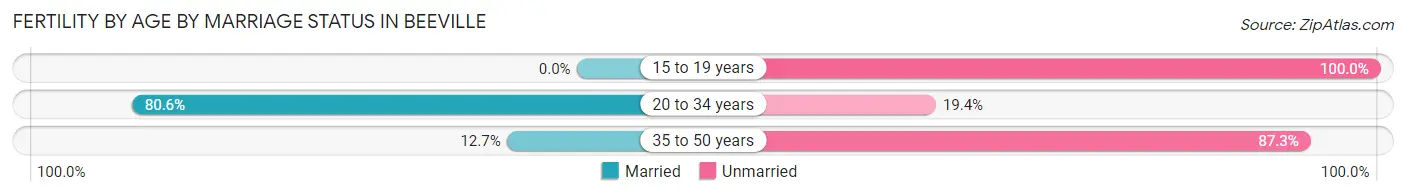
| Age Bracket | Married | Unmarried |
| 15 to 19 years | 0 (0.0%) | 20 (100.0%) |
| 20 to 34 years | 87 (80.6%) | 21 (19.4%) |
| 35 to 50 years | 9 (12.7%) | 62 (87.3%) |
| Total | 96 (48.2%) | 103 (51.8%) |
Fertility by Education in Beeville
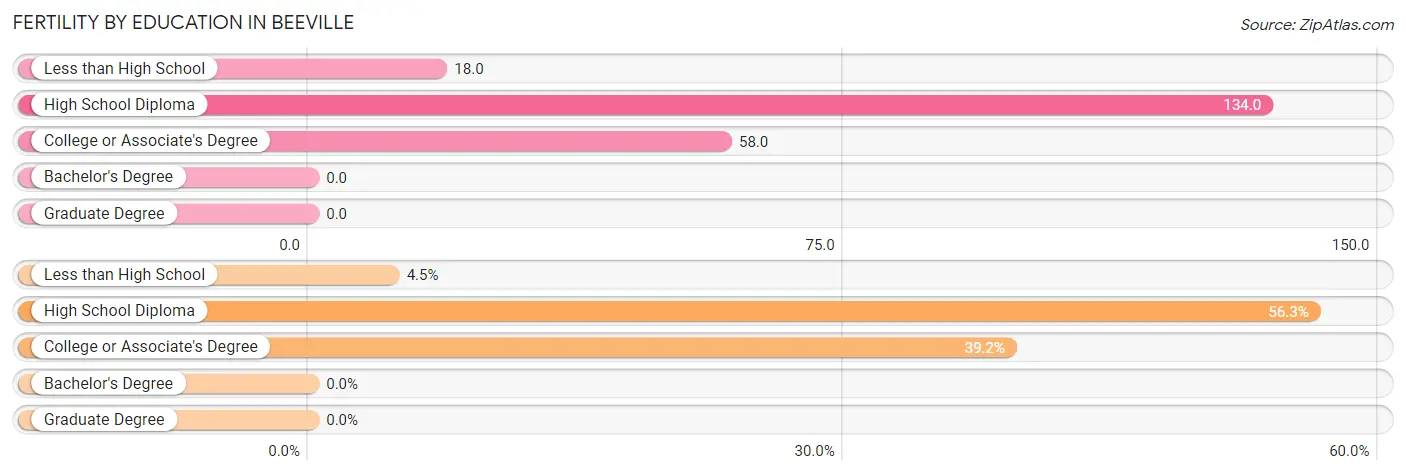
| Educational Attainment | Women with Births | Births / 1,000 Women |
| Less than High School | 9 (4.5%) | 18.0 |
| High School Diploma | 112 (56.3%) | 134.0 |
| College or Associate's Degree | 78 (39.2%) | 58.0 |
| Bachelor's Degree | 0 (0.0%) | 0.0 |
| Graduate Degree | 0 (0.0%) | 0.0 |
| Total | 199 (100.0%) | 62.0 |
Fertility by Education by Marriage Status in Beeville
51.8% of women with births in Beeville are unmarried. Women with the educational attainment of less than high school are most likely to be married with 100.0% of them married at childbirth, while women with the educational attainment of college or associate's degree are least likely to be married with 79.5% of them unmarried at childbirth.
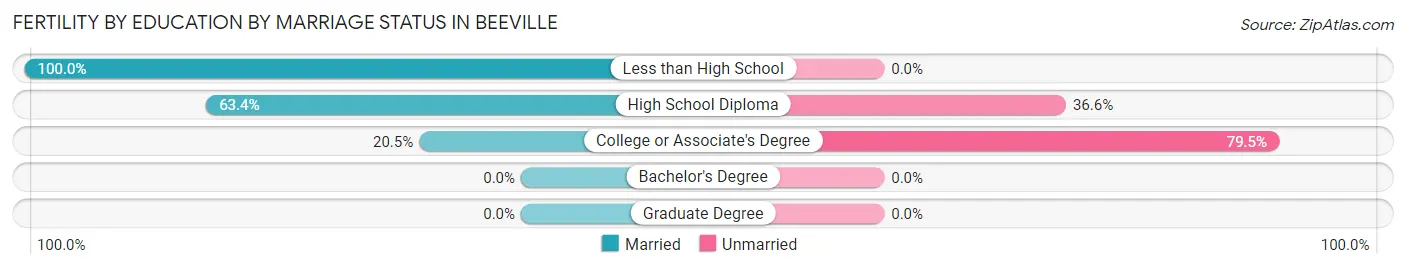
| Educational Attainment | Married | Unmarried |
| Less than High School | 9 (100.0%) | 0 (0.0%) |
| High School Diploma | 71 (63.4%) | 41 (36.6%) |
| College or Associate's Degree | 16 (20.5%) | 62 (79.5%) |
| Bachelor's Degree | 0 (0.0%) | 0 (0.0%) |
| Graduate Degree | 0 (0.0%) | 0 (0.0%) |
| Total | 96 (48.2%) | 103 (51.8%) |
Employment Characteristics in Beeville
Employment by Class of Employer in Beeville
Among the 5,656 employed individuals in Beeville, private company employees (3,694 | 65.3%), state government employees (766 | 13.5%), and self-employed (not incorporated) (354 | 6.3%) make up the most common classes of employment.
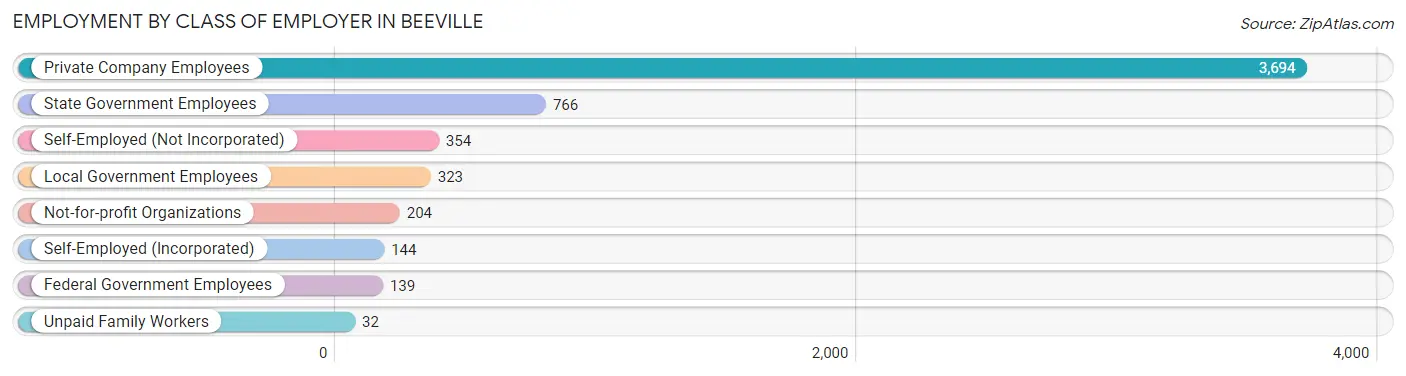
| Employer Class | # Employees | % Employees |
| Private Company Employees | 3,694 | 65.3% |
| Self-Employed (Incorporated) | 144 | 2.5% |
| Self-Employed (Not Incorporated) | 354 | 6.3% |
| Not-for-profit Organizations | 204 | 3.6% |
| Local Government Employees | 323 | 5.7% |
| State Government Employees | 766 | 13.5% |
| Federal Government Employees | 139 | 2.5% |
| Unpaid Family Workers | 32 | 0.6% |
| Total | 5,656 | 100.0% |
Employment Status by Age in Beeville
According to the labor force statistics for Beeville, out of the total population over 16 years of age (10,212), 61.7% or 6,301 individuals are in the labor force, with 7.9% or 498 of them unemployed. The age group with the highest labor force participation rate is 45 to 54 years, with 87.0% or 933 individuals in the labor force. Within the labor force, the 20 to 24 years age range has the highest percentage of unemployed individuals, with 31.0% or 256 of them being unemployed.
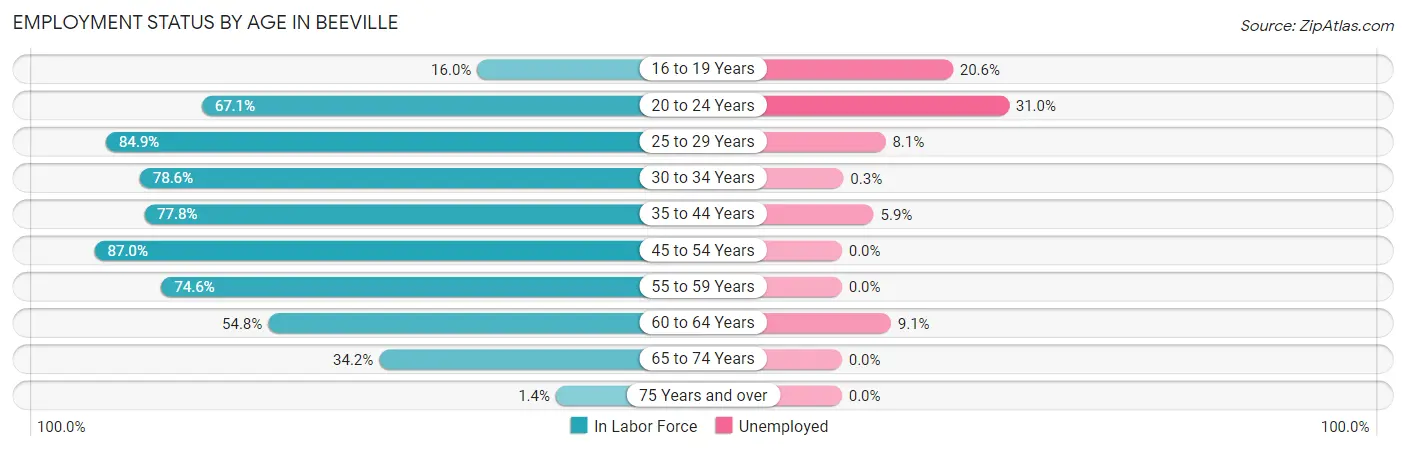
| Age Bracket | In Labor Force | Unemployed |
| 16 to 19 Years | 141 (16.0%) | 29 (20.6%) |
| 20 to 24 Years | 825 (67.1%) | 256 (31.0%) |
| 25 to 29 Years | 1,313 (84.9%) | 106 (8.1%) |
| 30 to 34 Years | 696 (78.6%) | 2 (0.3%) |
| 35 to 44 Years | 1,256 (77.8%) | 74 (5.9%) |
| 45 to 54 Years | 933 (87.0%) | 0 (0.0%) |
| 55 to 59 Years | 423 (74.6%) | 0 (0.0%) |
| 60 to 64 Years | 339 (54.8%) | 31 (9.1%) |
| 65 to 74 Years | 363 (34.2%) | 0 (0.0%) |
| 75 Years and over | 10 (1.4%) | 0 (0.0%) |
| Total | 6,301 (61.7%) | 498 (7.9%) |
Employment Status by Educational Attainment in Beeville
According to labor force statistics for Beeville, 78.7% of individuals (4,960) out of the total population between 25 and 64 years of age (6,303) are in the labor force, with 4.3% or 213 of them being unemployed. The group with the highest labor force participation rate are those with the educational attainment of bachelor's degree or higher, with 91.7% or 655 individuals in the labor force. Within the labor force, individuals with bachelor's degree or higher education have the highest percentage of unemployment, with 8.5% or 56 of them being unemployed.
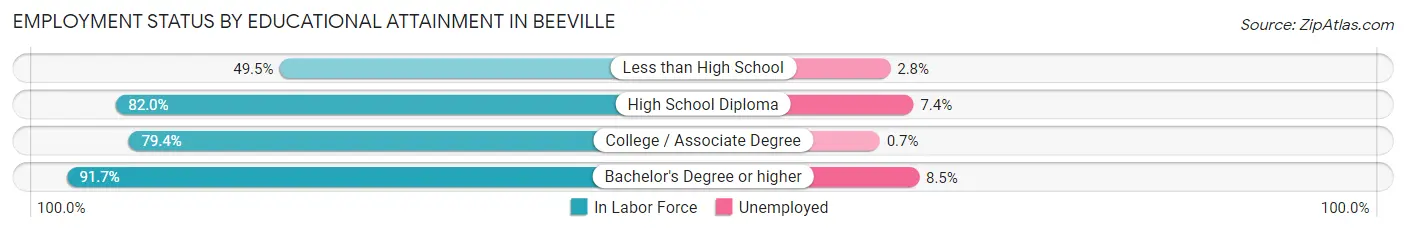
| Educational Attainment | In Labor Force | Unemployed |
| Less than High School | 316 (49.5%) | 18 (2.8%) |
| High School Diploma | 1,824 (82.0%) | 165 (7.4%) |
| College / Associate Degree | 2,165 (79.4%) | 19 (0.7%) |
| Bachelor's Degree or higher | 655 (91.7%) | 61 (8.5%) |
| Total | 4,960 (78.7%) | 271 (4.3%) |
Employment Occupations by Sex in Beeville
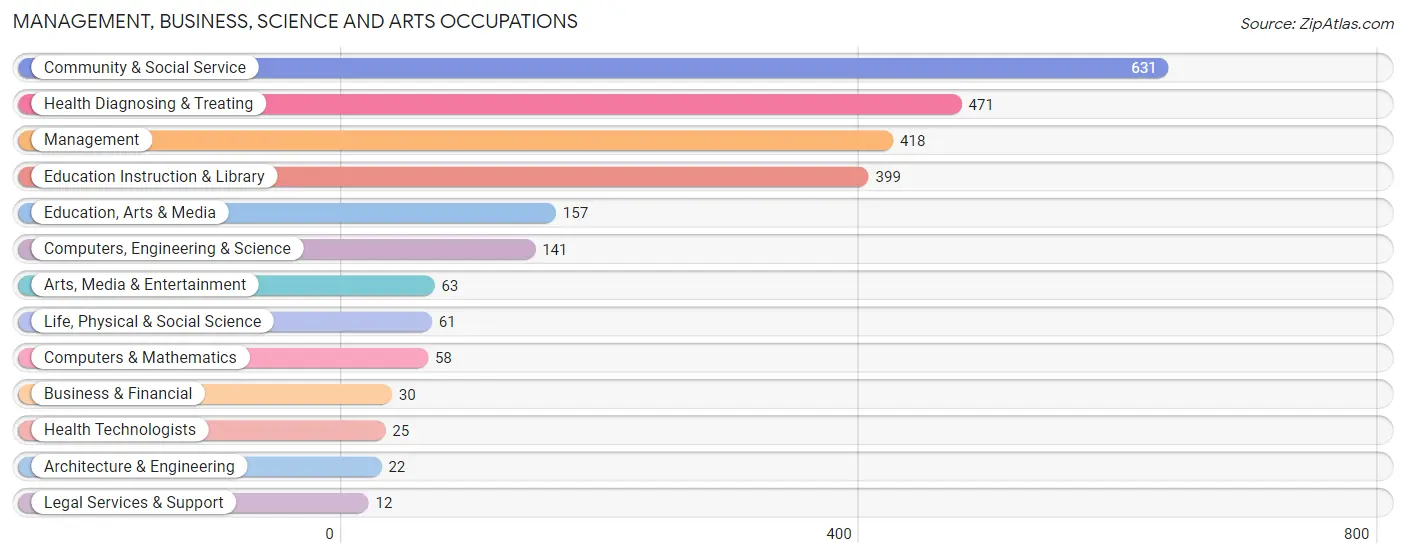
Management, Business, Science and Arts Occupations
The most common Management, Business, Science and Arts occupations in Beeville are Community & Social Service (631 | 10.9%), Health Diagnosing & Treating (471 | 8.1%), Management (418 | 7.2%), Education Instruction & Library (399 | 6.9%), and Education, Arts & Media (157 | 2.7%).
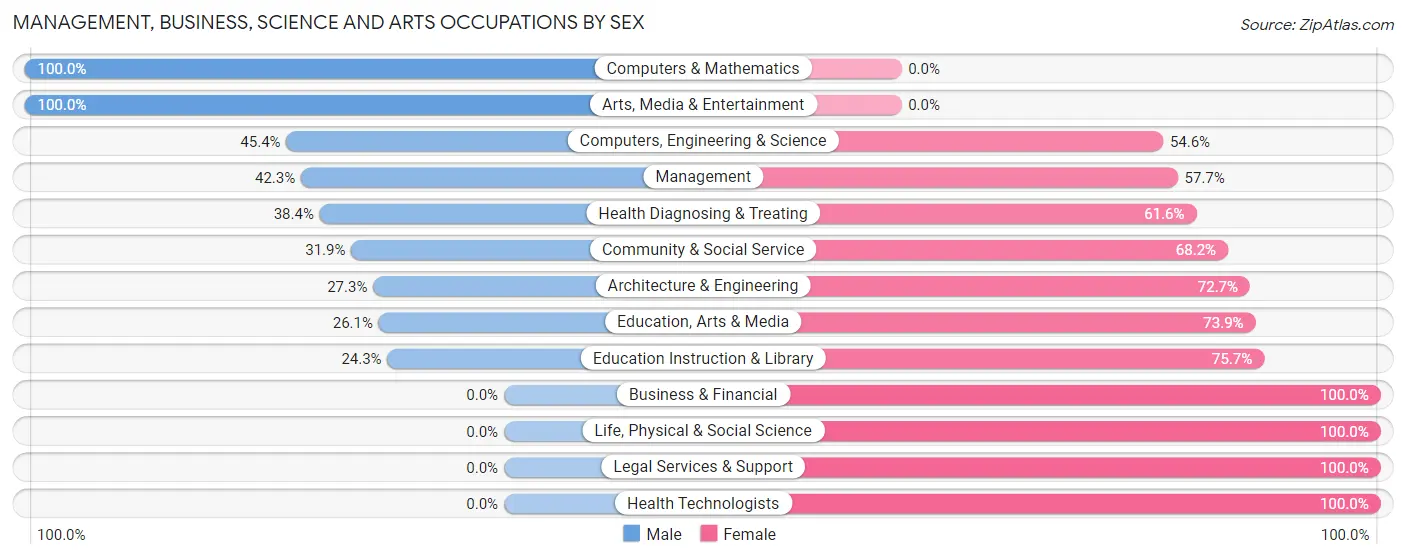
Management, Business, Science and Arts Occupations by Sex
Within the Management, Business, Science and Arts occupations in Beeville, the most male-oriented occupations are Computers & Mathematics (100.0%), Arts, Media & Entertainment (100.0%), and Computers, Engineering & Science (45.4%), while the most female-oriented occupations are Business & Financial (100.0%), Life, Physical & Social Science (100.0%), and Legal Services & Support (100.0%).
| Occupation | Male | Female |
| Management | 177 (42.3%) | 241 (57.7%) |
| Business & Financial | 0 (0.0%) | 30 (100.0%) |
| Computers, Engineering & Science | 64 (45.4%) | 77 (54.6%) |
| Computers & Mathematics | 58 (100.0%) | 0 (0.0%) |
| Architecture & Engineering | 6 (27.3%) | 16 (72.7%) |
| Life, Physical & Social Science | 0 (0.0%) | 61 (100.0%) |
| Community & Social Service | 201 (31.9%) | 430 (68.1%) |
| Education, Arts & Media | 41 (26.1%) | 116 (73.9%) |
| Legal Services & Support | 0 (0.0%) | 12 (100.0%) |
| Education Instruction & Library | 97 (24.3%) | 302 (75.7%) |
| Arts, Media & Entertainment | 63 (100.0%) | 0 (0.0%) |
| Health Diagnosing & Treating | 181 (38.4%) | 290 (61.6%) |
| Health Technologists | 0 (0.0%) | 25 (100.0%) |
| Total (Category) | 623 (36.8%) | 1,068 (63.2%) |
| Total (Overall) | 3,281 (56.6%) | 2,518 (43.4%) |
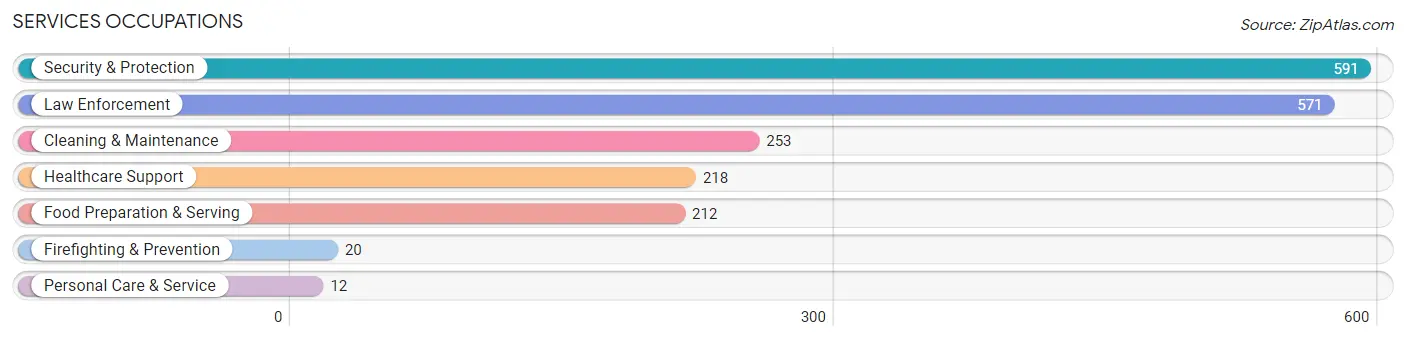
Services Occupations
The most common Services occupations in Beeville are Security & Protection (591 | 10.2%), Law Enforcement (571 | 9.9%), Cleaning & Maintenance (253 | 4.4%), Healthcare Support (218 | 3.8%), and Food Preparation & Serving (212 | 3.7%).
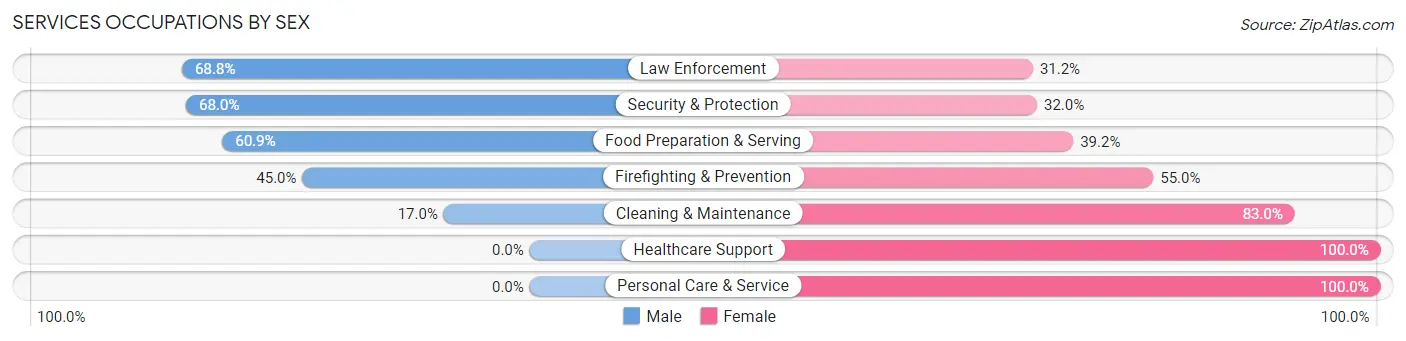
Services Occupations by Sex
Within the Services occupations in Beeville, the most male-oriented occupations are Law Enforcement (68.8%), Security & Protection (68.0%), and Food Preparation & Serving (60.9%), while the most female-oriented occupations are Healthcare Support (100.0%), Personal Care & Service (100.0%), and Cleaning & Maintenance (83.0%).
| Occupation | Male | Female |
| Healthcare Support | 0 (0.0%) | 218 (100.0%) |
| Security & Protection | 402 (68.0%) | 189 (32.0%) |
| Firefighting & Prevention | 9 (45.0%) | 11 (55.0%) |
| Law Enforcement | 393 (68.8%) | 178 (31.2%) |
| Food Preparation & Serving | 129 (60.9%) | 83 (39.2%) |
| Cleaning & Maintenance | 43 (17.0%) | 210 (83.0%) |
| Personal Care & Service | 0 (0.0%) | 12 (100.0%) |
| Total (Category) | 574 (44.6%) | 712 (55.4%) |
| Total (Overall) | 3,281 (56.6%) | 2,518 (43.4%) |
Sales and Office Occupations
The most common Sales and Office occupations in Beeville are Office & Administration (553 | 9.5%), and Sales & Related (503 | 8.7%).

Sales and Office Occupations by Sex
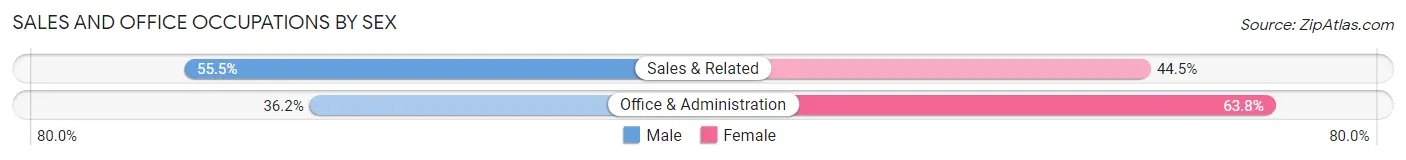
| Occupation | Male | Female |
| Sales & Related | 279 (55.5%) | 224 (44.5%) |
| Office & Administration | 200 (36.2%) | 353 (63.8%) |
| Total (Category) | 479 (45.4%) | 577 (54.6%) |
| Total (Overall) | 3,281 (56.6%) | 2,518 (43.4%) |
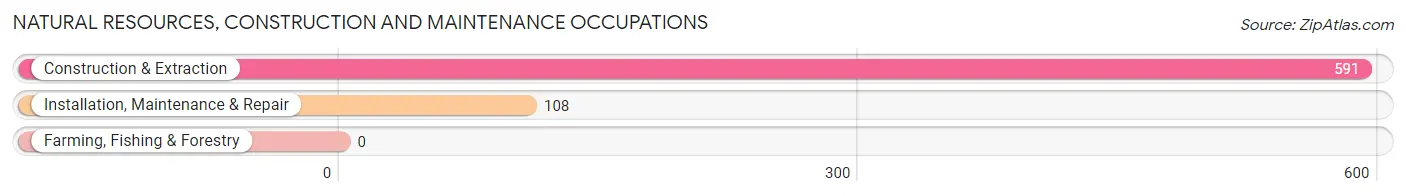
Natural Resources, Construction and Maintenance Occupations
The most common Natural Resources, Construction and Maintenance occupations in Beeville are Construction & Extraction (591 | 10.2%), and Installation, Maintenance & Repair (108 | 1.9%).
Natural Resources, Construction and Maintenance Occupations by Sex
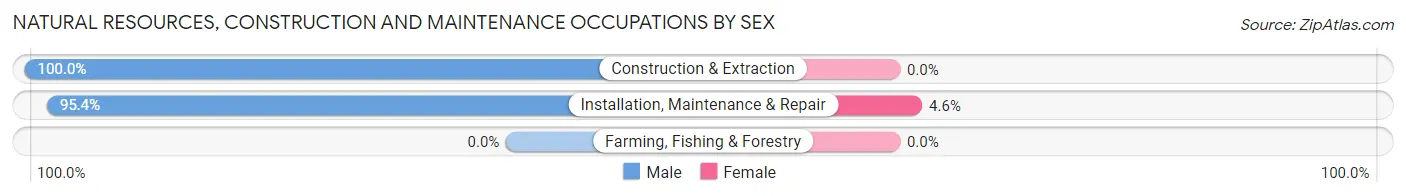
| Occupation | Male | Female |
| Farming, Fishing & Forestry | 0 (0.0%) | 0 (0.0%) |
| Construction & Extraction | 591 (100.0%) | 0 (0.0%) |
| Installation, Maintenance & Repair | 103 (95.4%) | 5 (4.6%) |
| Total (Category) | 694 (99.3%) | 5 (0.7%) |
| Total (Overall) | 3,281 (56.6%) | 2,518 (43.4%) |
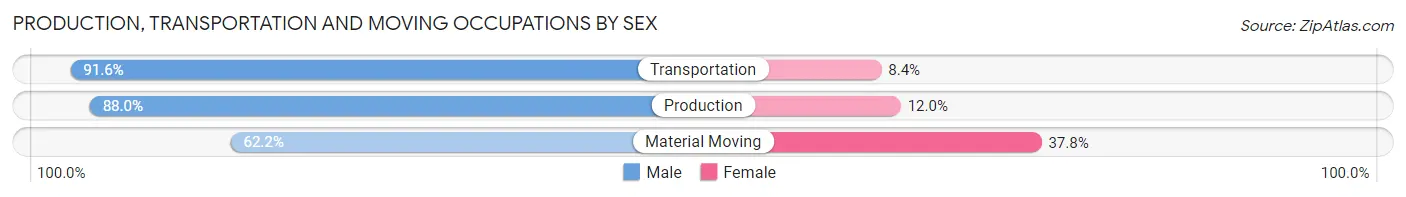
Production, Transportation and Moving Occupations
The most common Production, Transportation and Moving occupations in Beeville are Transportation (452 | 7.8%), Production (443 | 7.6%), and Material Moving (172 | 3.0%).
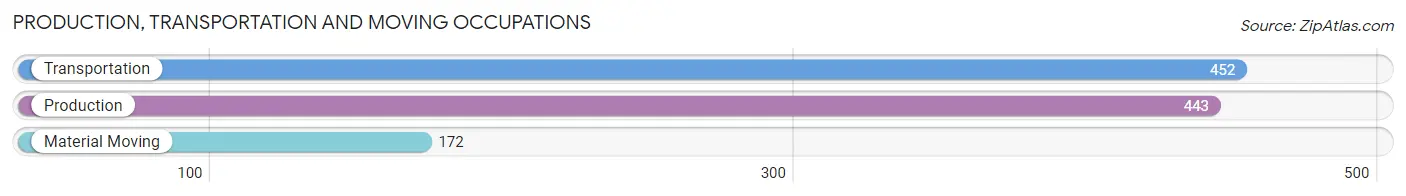
Production, Transportation and Moving Occupations by Sex
| Occupation | Male | Female |
| Production | 390 (88.0%) | 53 (12.0%) |
| Transportation | 414 (91.6%) | 38 (8.4%) |
| Material Moving | 107 (62.2%) | 65 (37.8%) |
| Total (Category) | 911 (85.4%) | 156 (14.6%) |
| Total (Overall) | 3,281 (56.6%) | 2,518 (43.4%) |
Employment Industries by Sex in Beeville
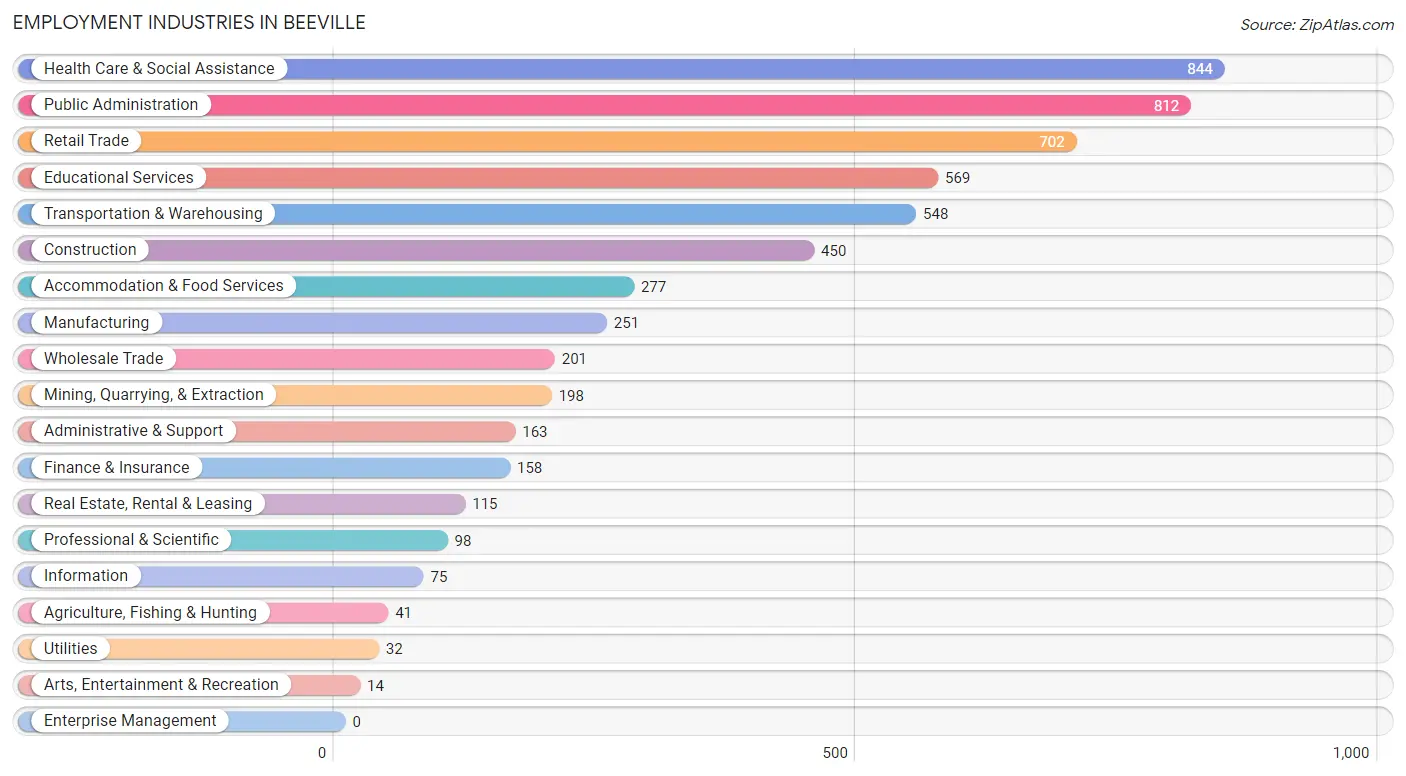
Employment Industries in Beeville
The major employment industries in Beeville include Health Care & Social Assistance (844 | 14.5%), Public Administration (812 | 14.0%), Retail Trade (702 | 12.1%), Educational Services (569 | 9.8%), and Transportation & Warehousing (548 | 9.5%).
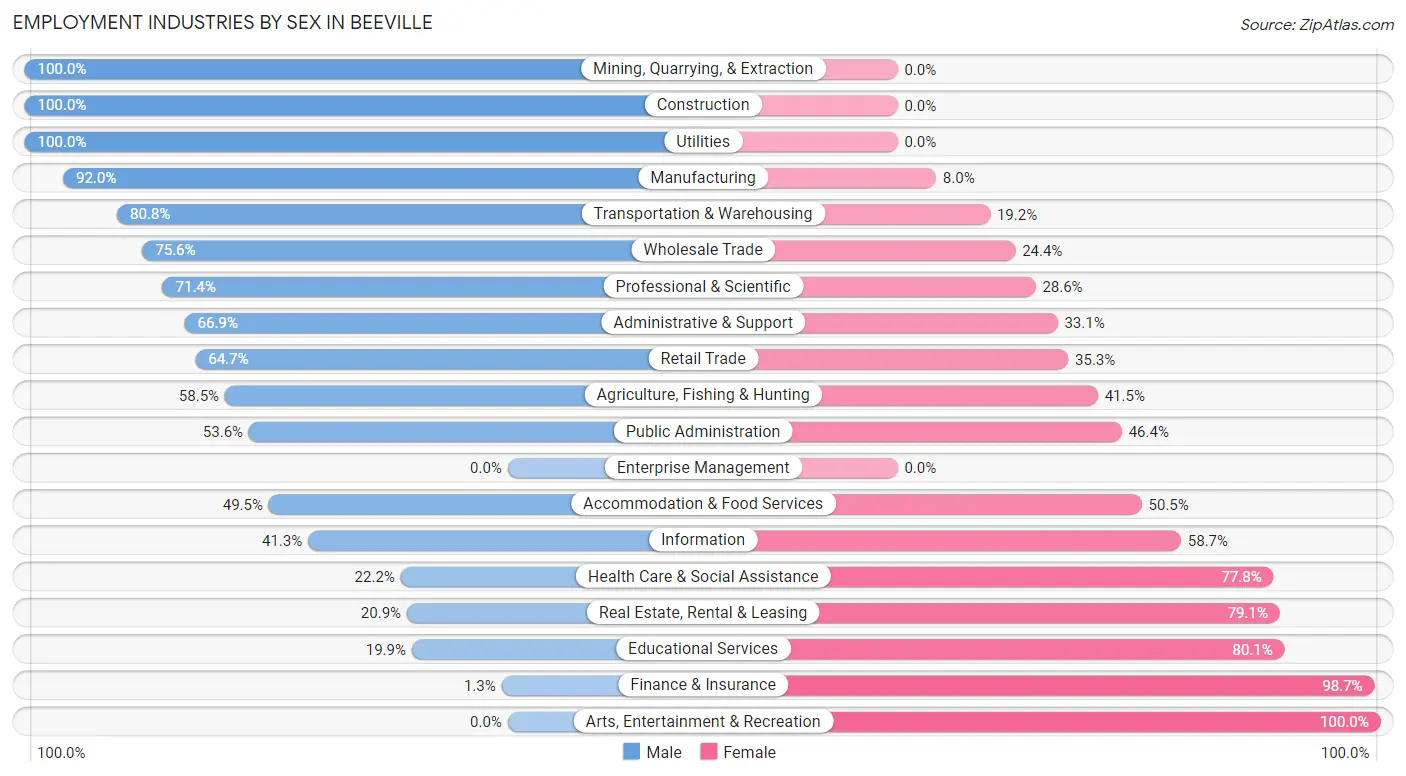
Employment Industries by Sex in Beeville
The Beeville industries that see more men than women are Mining, Quarrying, & Extraction (100.0%), Construction (100.0%), and Utilities (100.0%), whereas the industries that tend to have a higher number of women are Arts, Entertainment & Recreation (100.0%), Finance & Insurance (98.7%), and Educational Services (80.1%).
| Industry | Male | Female |
| Agriculture, Fishing & Hunting | 24 (58.5%) | 17 (41.5%) |
| Mining, Quarrying, & Extraction | 198 (100.0%) | 0 (0.0%) |
| Construction | 450 (100.0%) | 0 (0.0%) |
| Manufacturing | 231 (92.0%) | 20 (8.0%) |
| Wholesale Trade | 152 (75.6%) | 49 (24.4%) |
| Retail Trade | 454 (64.7%) | 248 (35.3%) |
| Transportation & Warehousing | 443 (80.8%) | 105 (19.2%) |
| Utilities | 32 (100.0%) | 0 (0.0%) |
| Information | 31 (41.3%) | 44 (58.7%) |
| Finance & Insurance | 2 (1.3%) | 156 (98.7%) |
| Real Estate, Rental & Leasing | 24 (20.9%) | 91 (79.1%) |
| Professional & Scientific | 70 (71.4%) | 28 (28.6%) |
| Enterprise Management | 0 (0.0%) | 0 (0.0%) |
| Administrative & Support | 109 (66.9%) | 54 (33.1%) |
| Educational Services | 113 (19.9%) | 456 (80.1%) |
| Health Care & Social Assistance | 187 (22.2%) | 657 (77.8%) |
| Arts, Entertainment & Recreation | 0 (0.0%) | 14 (100.0%) |
| Accommodation & Food Services | 137 (49.5%) | 140 (50.5%) |
| Public Administration | 435 (53.6%) | 377 (46.4%) |
| Total | 3,281 (56.6%) | 2,518 (43.4%) |
Education in Beeville
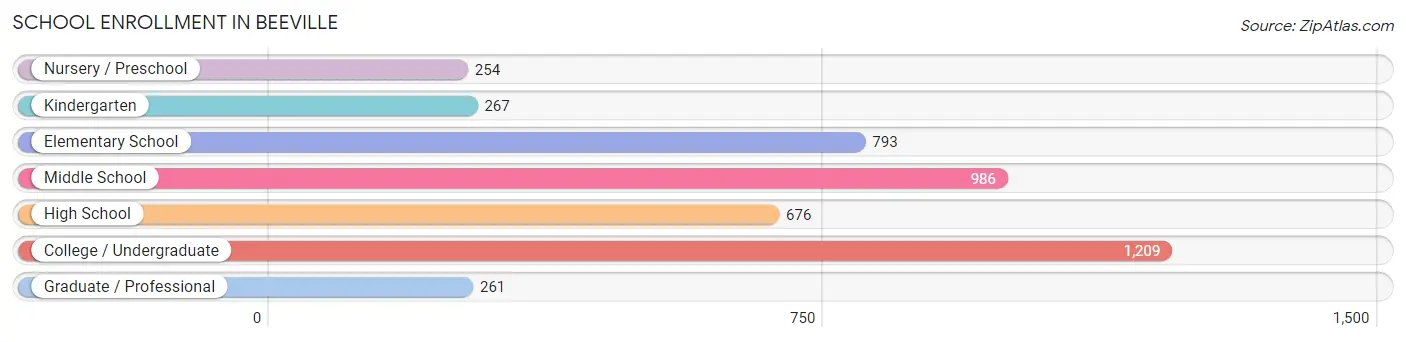
School Enrollment in Beeville
The most common levels of schooling among the 4,446 students in Beeville are college / undergraduate (1,209 | 27.2%), middle school (986 | 22.2%), and elementary school (793 | 17.8%).
| School Level | # Students | % Students |
| Nursery / Preschool | 254 | 5.7% |
| Kindergarten | 267 | 6.0% |
| Elementary School | 793 | 17.8% |
| Middle School | 986 | 22.2% |
| High School | 676 | 15.2% |
| College / Undergraduate | 1,209 | 27.2% |
| Graduate / Professional | 261 | 5.9% |
| Total | 4,446 | 100.0% |
School Enrollment by Age by Funding Source in Beeville
Out of a total of 4,446 students who are enrolled in schools in Beeville, 156 (3.5%) attend a private institution, while the remaining 4,290 (96.5%) are enrolled in public schools. The age group of 3 to 4 year olds has the highest likelihood of being enrolled in private schools, with 18 (10.6% in the age bracket) enrolled. Conversely, the age group of 20 to 24 year olds has the lowest likelihood of being enrolled in a private school, with 585 (100.0% in the age bracket) attending a public institution.
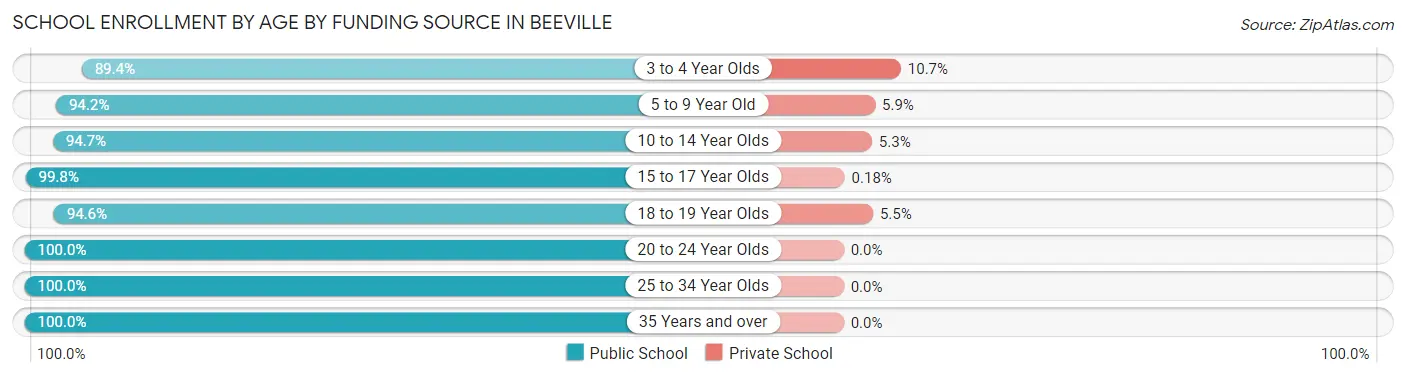
| Age Bracket | Public School | Private School |
| 3 to 4 Year Olds | 151 (89.3%) | 18 (10.6%) |
| 5 to 9 Year Old | 998 (94.2%) | 62 (5.9%) |
| 10 to 14 Year Olds | 1,009 (94.7%) | 56 (5.3%) |
| 15 to 17 Year Olds | 548 (99.8%) | 1 (0.2%) |
| 18 to 19 Year Olds | 312 (94.6%) | 18 (5.4%) |
| 20 to 24 Year Olds | 585 (100.0%) | 0 (0.0%) |
| 25 to 34 Year Olds | 581 (100.0%) | 0 (0.0%) |
| 35 Years and over | 107 (100.0%) | 0 (0.0%) |
| Total | 4,290 (96.5%) | 156 (3.5%) |
Educational Attainment by Field of Study in Beeville
Education (355 | 38.0%), arts & humanities (149 | 15.9%), business (90 | 9.6%), communications (64 | 6.8%), and psychology (63 | 6.7%) are the most common fields of study among 935 individuals in Beeville who have obtained a bachelor's degree or higher.
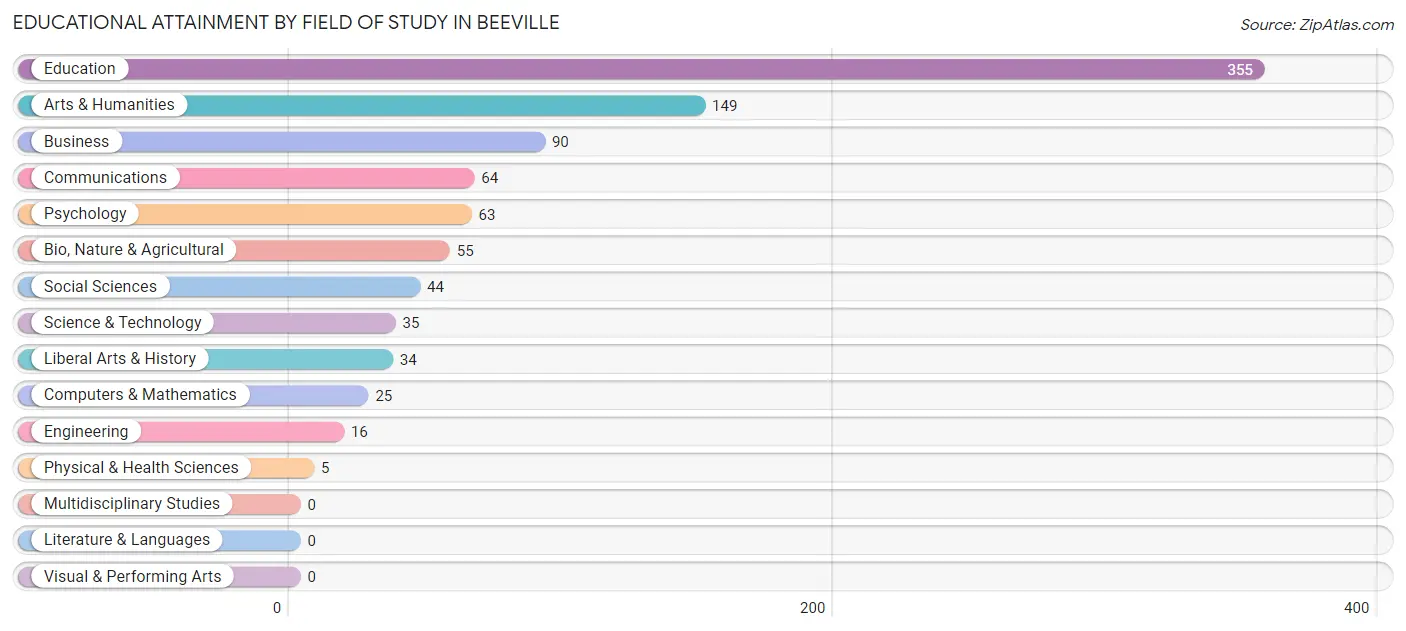
| Field of Study | # Graduates | % Graduates |
| Computers & Mathematics | 25 | 2.7% |
| Bio, Nature & Agricultural | 55 | 5.9% |
| Physical & Health Sciences | 5 | 0.5% |
| Psychology | 63 | 6.7% |
| Social Sciences | 44 | 4.7% |
| Engineering | 16 | 1.7% |
| Multidisciplinary Studies | 0 | 0.0% |
| Science & Technology | 35 | 3.7% |
| Business | 90 | 9.6% |
| Education | 355 | 38.0% |
| Literature & Languages | 0 | 0.0% |
| Liberal Arts & History | 34 | 3.6% |
| Visual & Performing Arts | 0 | 0.0% |
| Communications | 64 | 6.8% |
| Arts & Humanities | 149 | 15.9% |
| Total | 935 | 100.0% |
Transportation & Commute in Beeville
Vehicle Availability by Sex in Beeville
The most prevalent vehicle ownership categories in Beeville are males with 2 vehicles (1,504, accounting for 46.2%) and females with 2 vehicles (1,073, making up 62.9%).
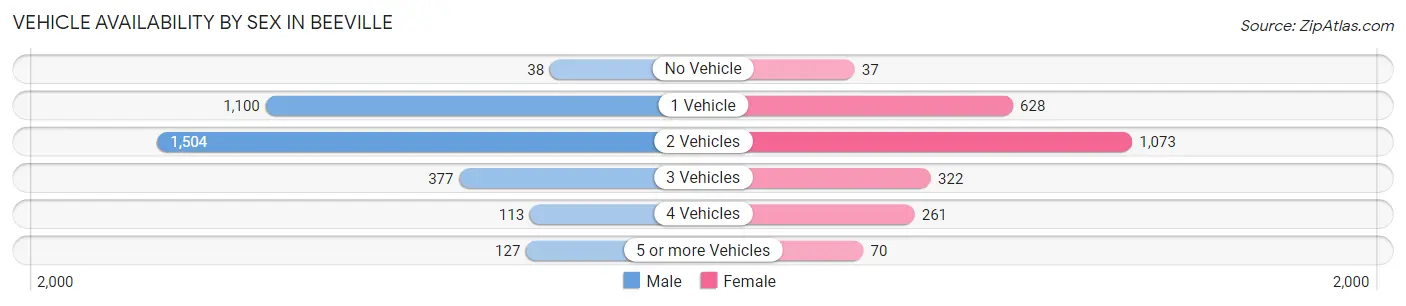
| Vehicles Available | Male | Female |
| No Vehicle | 38 (1.2%) | 37 (1.5%) |
| 1 Vehicle | 1,100 (33.8%) | 628 (26.3%) |
| 2 Vehicles | 1,504 (46.2%) | 1,073 (44.9%) |
| 3 Vehicles | 377 (11.6%) | 322 (13.5%) |
| 4 Vehicles | 113 (3.5%) | 261 (10.9%) |
| 5 or more Vehicles | 127 (3.9%) | 70 (2.9%) |
| Total | 3,259 (100.0%) | 2,391 (100.0%) |
Commute Time in Beeville
The most frequently occuring commute durations in Beeville are 5 to 9 minutes (1,427 commuters, 26.4%), 10 to 14 minutes (1,170 commuters, 21.6%), and 15 to 19 minutes (665 commuters, 12.3%).
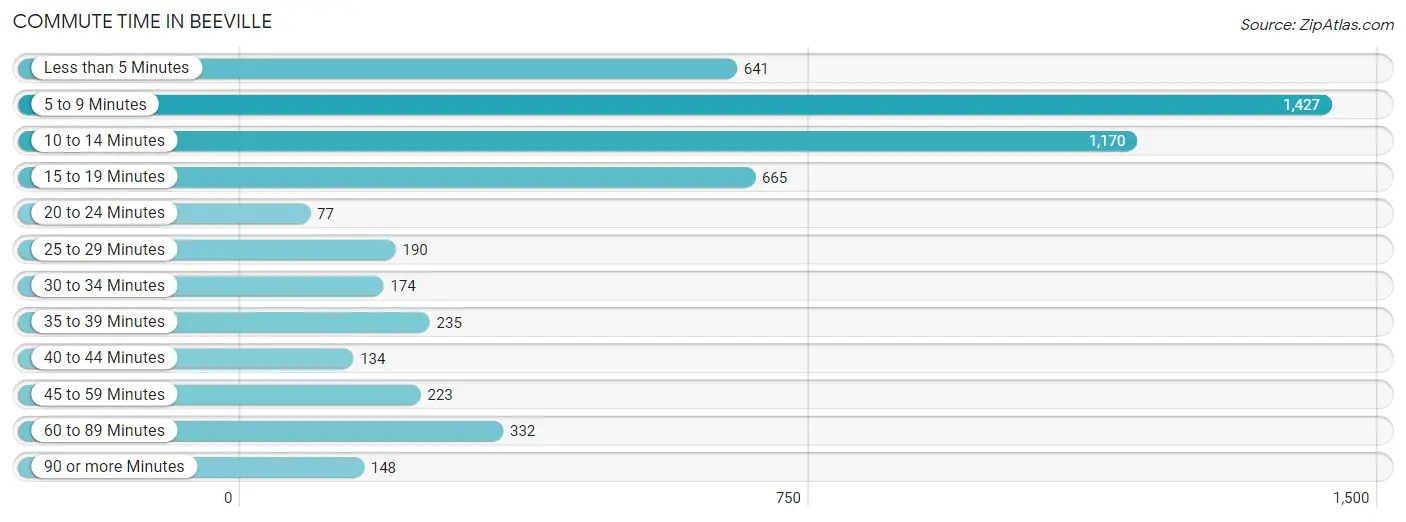
| Commute Time | # Commuters | % Commuters |
| Less than 5 Minutes | 641 | 11.8% |
| 5 to 9 Minutes | 1,427 | 26.4% |
| 10 to 14 Minutes | 1,170 | 21.6% |
| 15 to 19 Minutes | 665 | 12.3% |
| 20 to 24 Minutes | 77 | 1.4% |
| 25 to 29 Minutes | 190 | 3.5% |
| 30 to 34 Minutes | 174 | 3.2% |
| 35 to 39 Minutes | 235 | 4.3% |
| 40 to 44 Minutes | 134 | 2.5% |
| 45 to 59 Minutes | 223 | 4.1% |
| 60 to 89 Minutes | 332 | 6.1% |
| 90 or more Minutes | 148 | 2.7% |
Commute Time by Sex in Beeville
The most common commute times in Beeville are 10 to 14 minutes (656 commuters, 21.2%) for males and 5 to 9 minutes (802 commuters, 34.4%) for females.
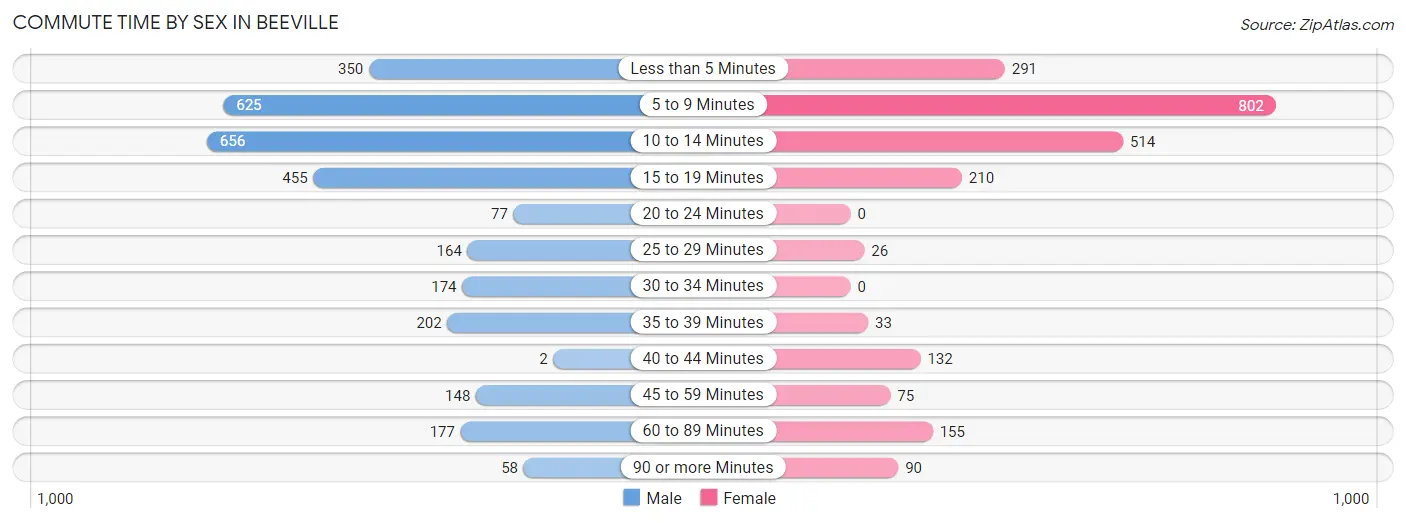
| Commute Time | Male | Female |
| Less than 5 Minutes | 350 (11.3%) | 291 (12.5%) |
| 5 to 9 Minutes | 625 (20.2%) | 802 (34.4%) |
| 10 to 14 Minutes | 656 (21.2%) | 514 (22.1%) |
| 15 to 19 Minutes | 455 (14.7%) | 210 (9.0%) |
| 20 to 24 Minutes | 77 (2.5%) | 0 (0.0%) |
| 25 to 29 Minutes | 164 (5.3%) | 26 (1.1%) |
| 30 to 34 Minutes | 174 (5.6%) | 0 (0.0%) |
| 35 to 39 Minutes | 202 (6.5%) | 33 (1.4%) |
| 40 to 44 Minutes | 2 (0.1%) | 132 (5.7%) |
| 45 to 59 Minutes | 148 (4.8%) | 75 (3.2%) |
| 60 to 89 Minutes | 177 (5.7%) | 155 (6.7%) |
| 90 or more Minutes | 58 (1.9%) | 90 (3.9%) |
Time of Departure to Work by Sex in Beeville
The most frequent times of departure to work in Beeville are 8:00 AM to 8:29 AM (547, 17.7%) for males and 7:30 AM to 7:59 AM (404, 17.3%) for females.
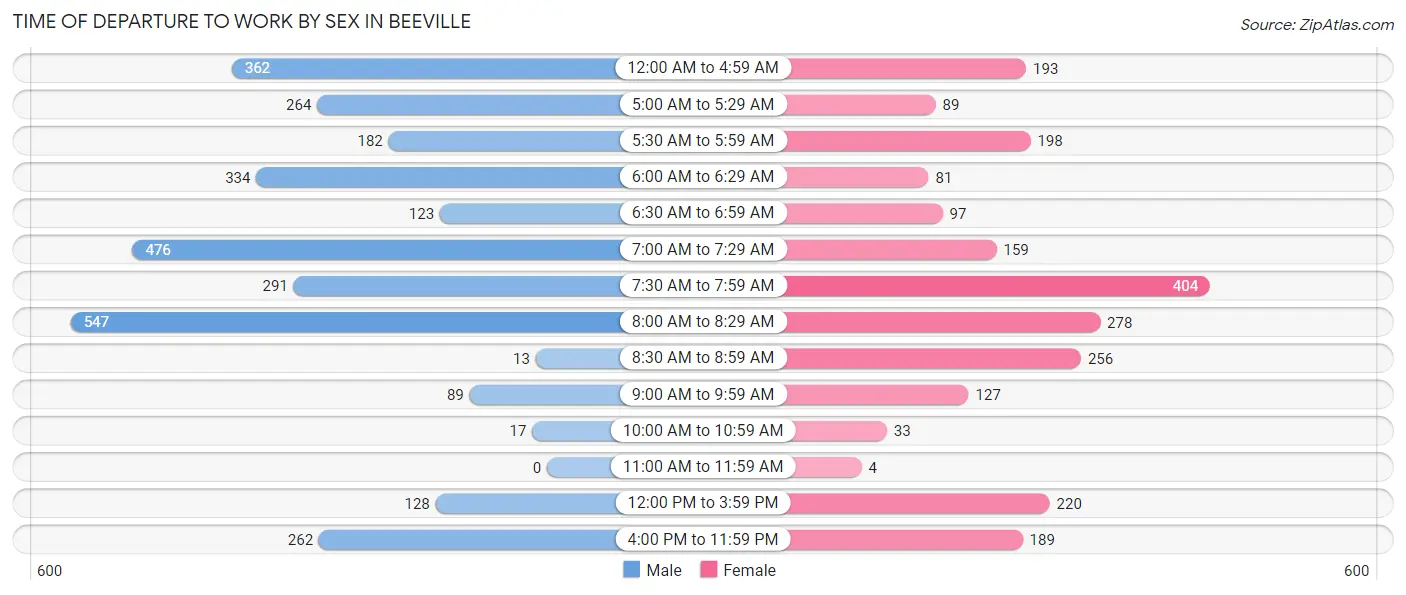
| Time of Departure | Male | Female |
| 12:00 AM to 4:59 AM | 362 (11.7%) | 193 (8.3%) |
| 5:00 AM to 5:29 AM | 264 (8.6%) | 89 (3.8%) |
| 5:30 AM to 5:59 AM | 182 (5.9%) | 198 (8.5%) |
| 6:00 AM to 6:29 AM | 334 (10.8%) | 81 (3.5%) |
| 6:30 AM to 6:59 AM | 123 (4.0%) | 97 (4.2%) |
| 7:00 AM to 7:29 AM | 476 (15.4%) | 159 (6.8%) |
| 7:30 AM to 7:59 AM | 291 (9.4%) | 404 (17.3%) |
| 8:00 AM to 8:29 AM | 547 (17.7%) | 278 (11.9%) |
| 8:30 AM to 8:59 AM | 13 (0.4%) | 256 (11.0%) |
| 9:00 AM to 9:59 AM | 89 (2.9%) | 127 (5.5%) |
| 10:00 AM to 10:59 AM | 17 (0.5%) | 33 (1.4%) |
| 11:00 AM to 11:59 AM | 0 (0.0%) | 4 (0.2%) |
| 12:00 PM to 3:59 PM | 128 (4.2%) | 220 (9.5%) |
| 4:00 PM to 11:59 PM | 262 (8.5%) | 189 (8.1%) |
| Total | 3,088 (100.0%) | 2,328 (100.0%) |
Housing Occupancy in Beeville
Occupancy by Ownership in Beeville
Of the total 4,847 dwellings in Beeville, owner-occupied units account for 2,727 (56.3%), while renter-occupied units make up 2,120 (43.7%).
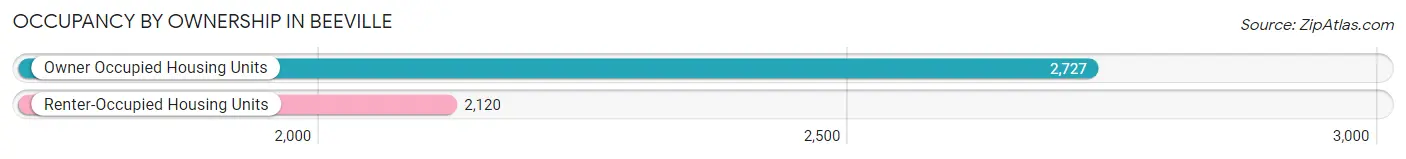
| Occupancy | # Housing Units | % Housing Units |
| Owner Occupied Housing Units | 2,727 | 56.3% |
| Renter-Occupied Housing Units | 2,120 | 43.7% |
| Total Occupied Housing Units | 4,847 | 100.0% |
Occupancy by Household Size in Beeville
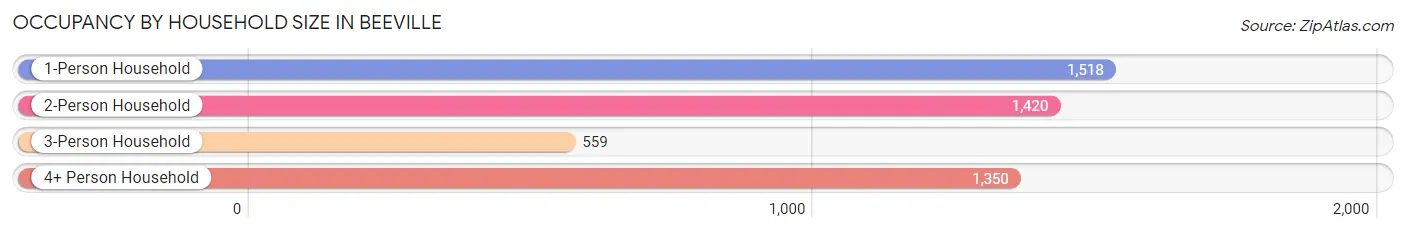
| Household Size | # Housing Units | % Housing Units |
| 1-Person Household | 1,518 | 31.3% |
| 2-Person Household | 1,420 | 29.3% |
| 3-Person Household | 559 | 11.5% |
| 4+ Person Household | 1,350 | 27.9% |
| Total Housing Units | 4,847 | 100.0% |
Occupancy by Ownership by Household Size in Beeville
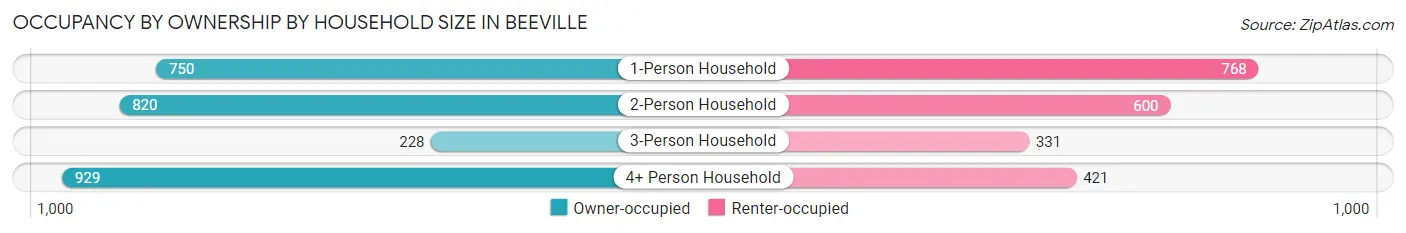
| Household Size | Owner-occupied | Renter-occupied |
| 1-Person Household | 750 (49.4%) | 768 (50.6%) |
| 2-Person Household | 820 (57.8%) | 600 (42.2%) |
| 3-Person Household | 228 (40.8%) | 331 (59.2%) |
| 4+ Person Household | 929 (68.8%) | 421 (31.2%) |
| Total Housing Units | 2,727 (56.3%) | 2,120 (43.7%) |
Occupancy by Educational Attainment in Beeville
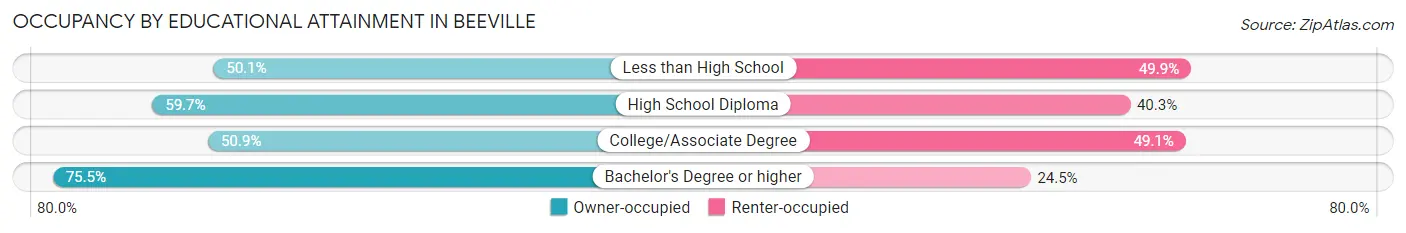
| Household Size | Owner-occupied | Renter-occupied |
| Less than High School | 369 (50.1%) | 368 (49.9%) |
| High School Diploma | 932 (59.7%) | 628 (40.3%) |
| College/Associate Degree | 1,034 (50.9%) | 997 (49.1%) |
| Bachelor's Degree or higher | 392 (75.5%) | 127 (24.5%) |
Occupancy by Age of Householder in Beeville
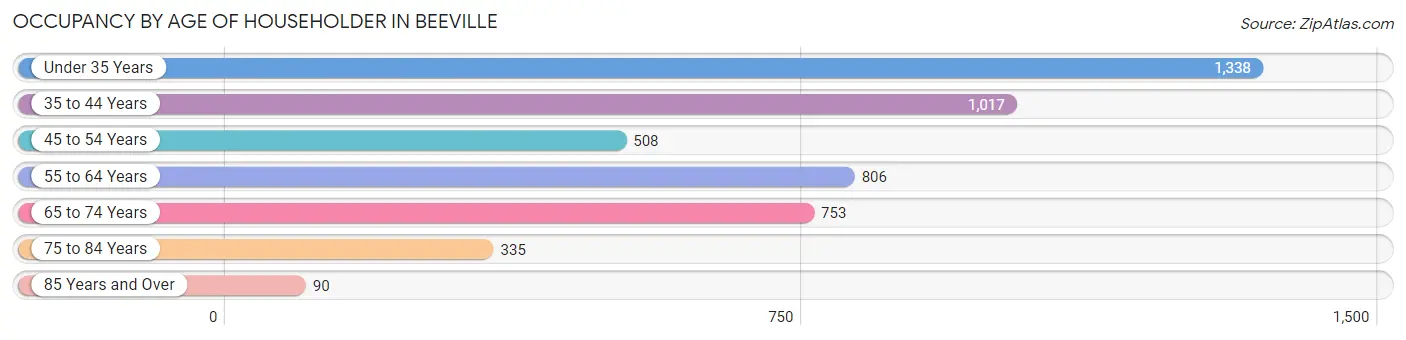
| Age Bracket | # Households | % Households |
| Under 35 Years | 1,338 | 27.6% |
| 35 to 44 Years | 1,017 | 21.0% |
| 45 to 54 Years | 508 | 10.5% |
| 55 to 64 Years | 806 | 16.6% |
| 65 to 74 Years | 753 | 15.5% |
| 75 to 84 Years | 335 | 6.9% |
| 85 Years and Over | 90 | 1.9% |
| Total | 4,847 | 100.0% |
Housing Finances in Beeville
Median Income by Occupancy in Beeville
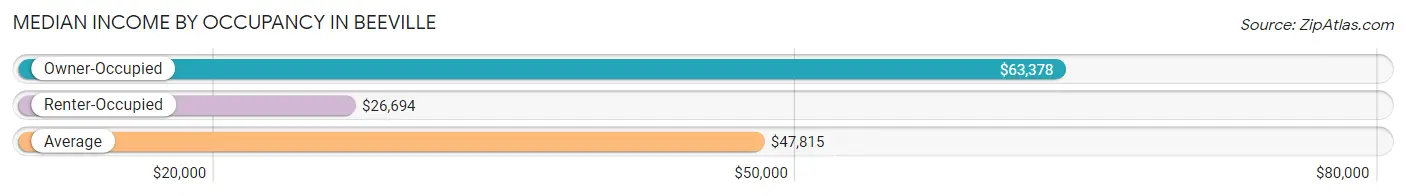
| Occupancy Type | # Households | Median Income |
| Owner-Occupied | 2,727 (56.3%) | $63,378 |
| Renter-Occupied | 2,120 (43.7%) | $26,694 |
| Average | 4,847 (100.0%) | $47,815 |
Occupancy by Householder Income Bracket in Beeville
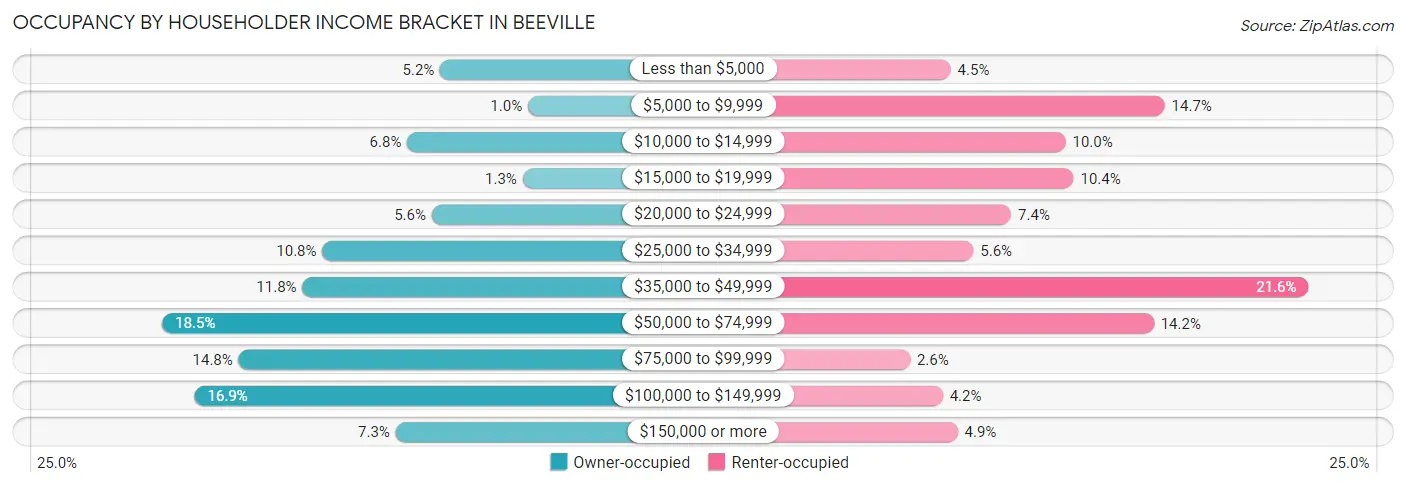
| Income Bracket | Owner-occupied | Renter-occupied |
| Less than $5,000 | 142 (5.2%) | 96 (4.5%) |
| $5,000 to $9,999 | 28 (1.0%) | 312 (14.7%) |
| $10,000 to $14,999 | 185 (6.8%) | 212 (10.0%) |
| $15,000 to $19,999 | 35 (1.3%) | 220 (10.4%) |
| $20,000 to $24,999 | 153 (5.6%) | 157 (7.4%) |
| $25,000 to $34,999 | 295 (10.8%) | 119 (5.6%) |
| $35,000 to $49,999 | 321 (11.8%) | 457 (21.6%) |
| $50,000 to $74,999 | 503 (18.4%) | 301 (14.2%) |
| $75,000 to $99,999 | 404 (14.8%) | 55 (2.6%) |
| $100,000 to $149,999 | 461 (16.9%) | 88 (4.2%) |
| $150,000 or more | 200 (7.3%) | 103 (4.9%) |
| Total | 2,727 (100.0%) | 2,120 (100.0%) |
Monthly Housing Cost Tiers in Beeville
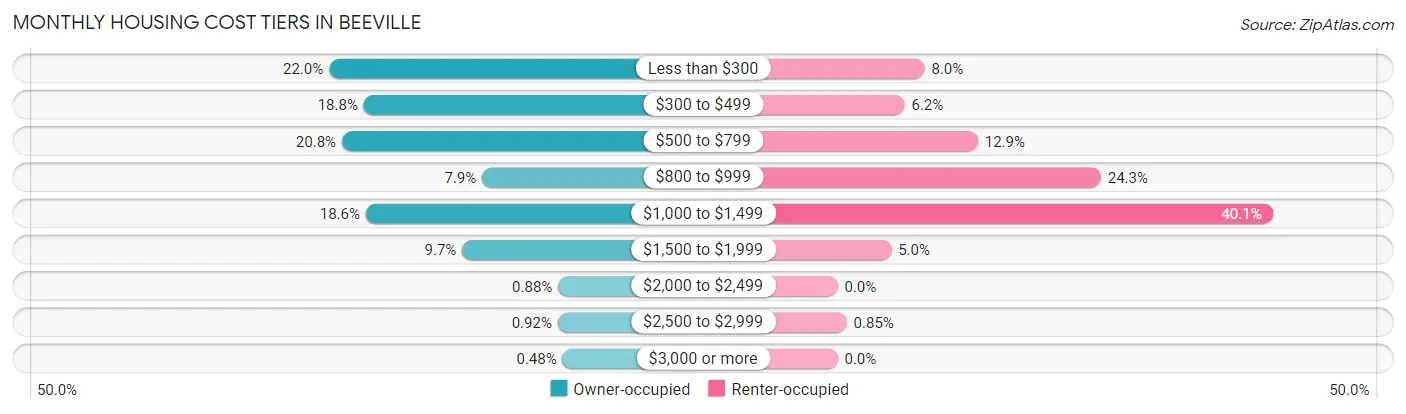
| Monthly Cost | Owner-occupied | Renter-occupied |
| Less than $300 | 599 (22.0%) | 170 (8.0%) |
| $300 to $499 | 512 (18.8%) | 131 (6.2%) |
| $500 to $799 | 567 (20.8%) | 274 (12.9%) |
| $800 to $999 | 215 (7.9%) | 514 (24.2%) |
| $1,000 to $1,499 | 507 (18.6%) | 851 (40.1%) |
| $1,500 to $1,999 | 265 (9.7%) | 105 (5.0%) |
| $2,000 to $2,499 | 24 (0.9%) | 0 (0.0%) |
| $2,500 to $2,999 | 25 (0.9%) | 18 (0.9%) |
| $3,000 or more | 13 (0.5%) | 0 (0.0%) |
| Total | 2,727 (100.0%) | 2,120 (100.0%) |
Physical Housing Characteristics in Beeville
Housing Structures in Beeville
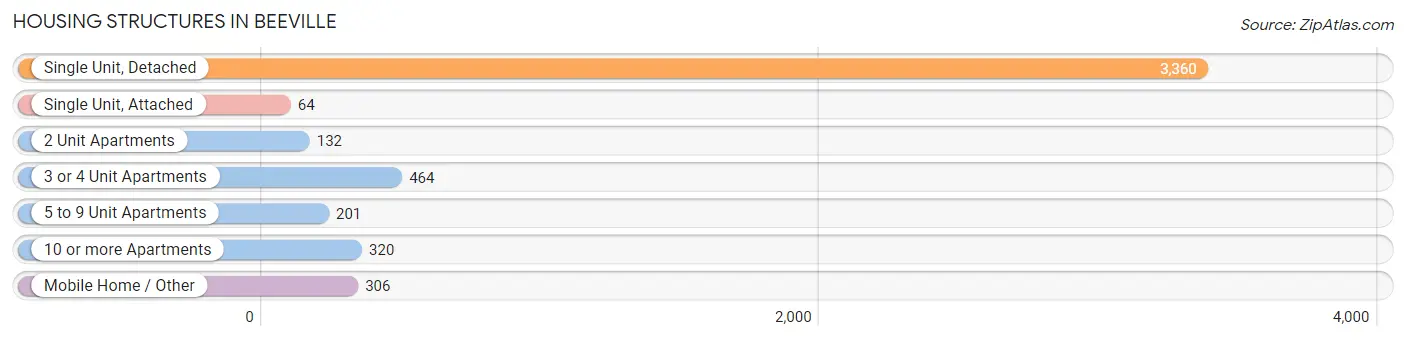
| Structure Type | # Housing Units | % Housing Units |
| Single Unit, Detached | 3,360 | 69.3% |
| Single Unit, Attached | 64 | 1.3% |
| 2 Unit Apartments | 132 | 2.7% |
| 3 or 4 Unit Apartments | 464 | 9.6% |
| 5 to 9 Unit Apartments | 201 | 4.2% |
| 10 or more Apartments | 320 | 6.6% |
| Mobile Home / Other | 306 | 6.3% |
| Total | 4,847 | 100.0% |
Housing Structures by Occupancy in Beeville
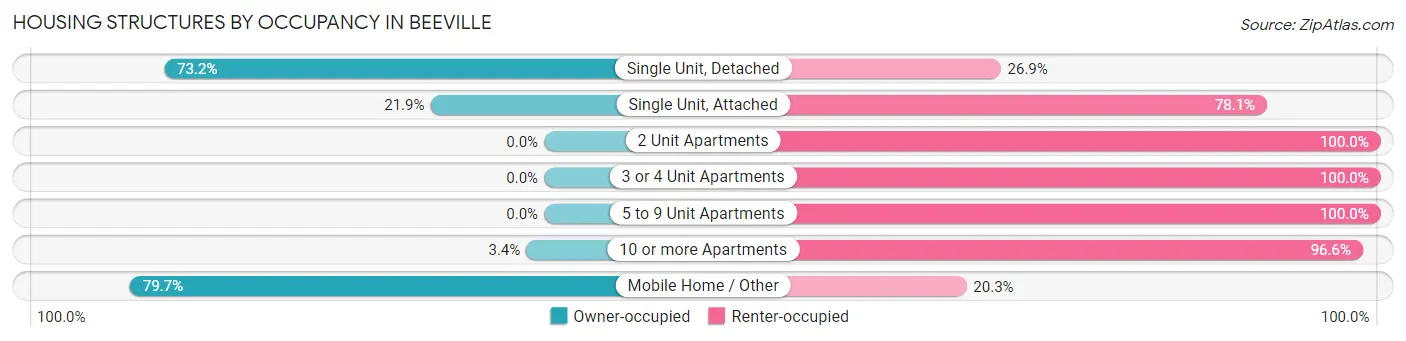
| Structure Type | Owner-occupied | Renter-occupied |
| Single Unit, Detached | 2,458 (73.2%) | 902 (26.9%) |
| Single Unit, Attached | 14 (21.9%) | 50 (78.1%) |
| 2 Unit Apartments | 0 (0.0%) | 132 (100.0%) |
| 3 or 4 Unit Apartments | 0 (0.0%) | 464 (100.0%) |
| 5 to 9 Unit Apartments | 0 (0.0%) | 201 (100.0%) |
| 10 or more Apartments | 11 (3.4%) | 309 (96.6%) |
| Mobile Home / Other | 244 (79.7%) | 62 (20.3%) |
| Total | 2,727 (56.3%) | 2,120 (43.7%) |
Housing Structures by Number of Rooms in Beeville
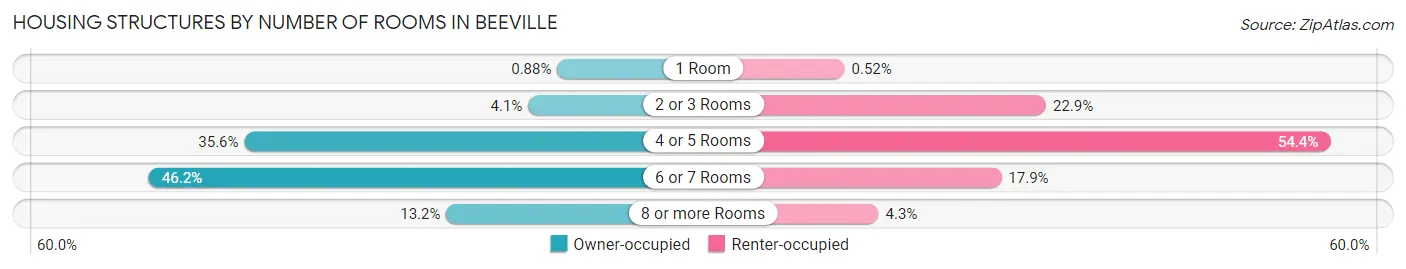
| Number of Rooms | Owner-occupied | Renter-occupied |
| 1 Room | 24 (0.9%) | 11 (0.5%) |
| 2 or 3 Rooms | 112 (4.1%) | 485 (22.9%) |
| 4 or 5 Rooms | 971 (35.6%) | 1,153 (54.4%) |
| 6 or 7 Rooms | 1,260 (46.2%) | 380 (17.9%) |
| 8 or more Rooms | 360 (13.2%) | 91 (4.3%) |
| Total | 2,727 (100.0%) | 2,120 (100.0%) |
Housing Structure by Heating Type in Beeville
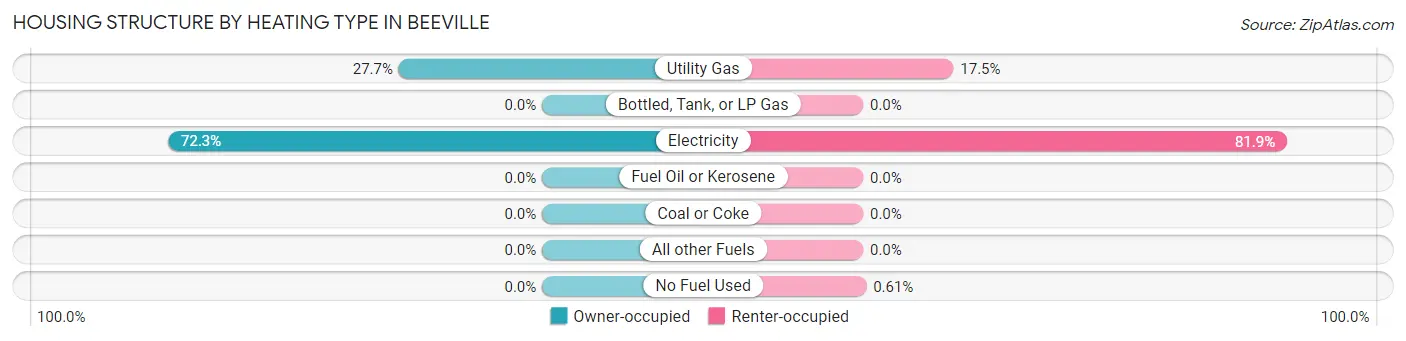
| Heating Type | Owner-occupied | Renter-occupied |
| Utility Gas | 755 (27.7%) | 370 (17.4%) |
| Bottled, Tank, or LP Gas | 0 (0.0%) | 0 (0.0%) |
| Electricity | 1,972 (72.3%) | 1,737 (81.9%) |
| Fuel Oil or Kerosene | 0 (0.0%) | 0 (0.0%) |
| Coal or Coke | 0 (0.0%) | 0 (0.0%) |
| All other Fuels | 0 (0.0%) | 0 (0.0%) |
| No Fuel Used | 0 (0.0%) | 13 (0.6%) |
| Total | 2,727 (100.0%) | 2,120 (100.0%) |
Household Vehicle Usage in Beeville
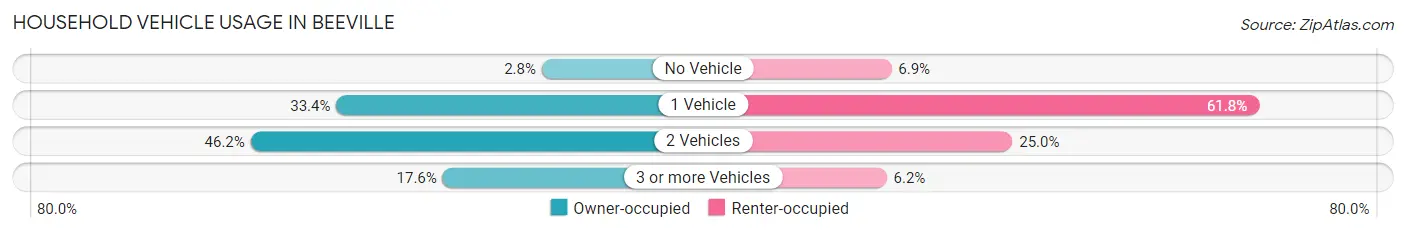
| Vehicles per Household | Owner-occupied | Renter-occupied |
| No Vehicle | 75 (2.8%) | 147 (6.9%) |
| 1 Vehicle | 912 (33.4%) | 1,311 (61.8%) |
| 2 Vehicles | 1,261 (46.2%) | 530 (25.0%) |
| 3 or more Vehicles | 479 (17.6%) | 132 (6.2%) |
| Total | 2,727 (100.0%) | 2,120 (100.0%) |
Real Estate & Mortgages in Beeville
Real Estate and Mortgage Overview in Beeville
| Characteristic | Without Mortgage | With Mortgage |
| Housing Units | 1,710 | 1,017 |
| Median Property Value | $84,000 | $137,100 |
| Median Household Income | $49,211 | $132 |
| Monthly Housing Costs | $366 | $13 |
| Real Estate Taxes | $1,082 | $61 |
Property Value by Mortgage Status in Beeville
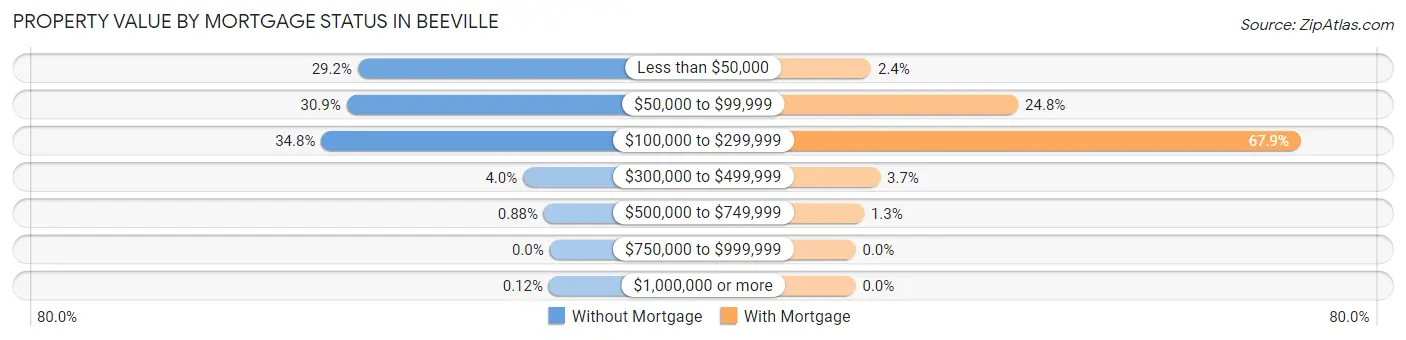
| Property Value | Without Mortgage | With Mortgage |
| Less than $50,000 | 500 (29.2%) | 24 (2.4%) |
| $50,000 to $99,999 | 529 (30.9%) | 252 (24.8%) |
| $100,000 to $299,999 | 595 (34.8%) | 690 (67.8%) |
| $300,000 to $499,999 | 69 (4.0%) | 38 (3.7%) |
| $500,000 to $749,999 | 15 (0.9%) | 13 (1.3%) |
| $750,000 to $999,999 | 0 (0.0%) | 0 (0.0%) |
| $1,000,000 or more | 2 (0.1%) | 0 (0.0%) |
| Total | 1,710 (100.0%) | 1,017 (100.0%) |
Household Income by Mortgage Status in Beeville
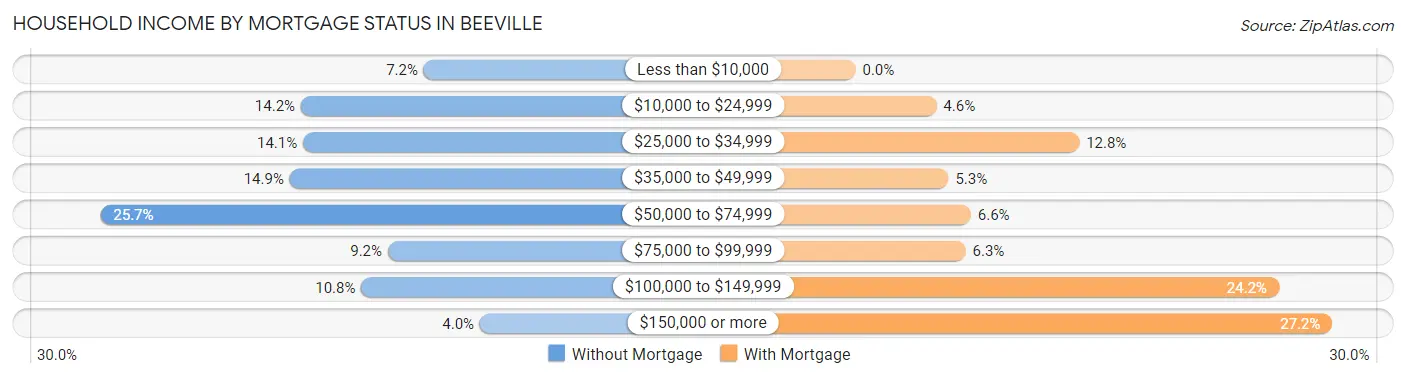
| Household Income | Without Mortgage | With Mortgage |
| Less than $10,000 | 123 (7.2%) | 0 (0.0%) |
| $10,000 to $24,999 | 243 (14.2%) | 47 (4.6%) |
| $25,000 to $34,999 | 241 (14.1%) | 130 (12.8%) |
| $35,000 to $49,999 | 254 (14.8%) | 54 (5.3%) |
| $50,000 to $74,999 | 439 (25.7%) | 67 (6.6%) |
| $75,000 to $99,999 | 158 (9.2%) | 64 (6.3%) |
| $100,000 to $149,999 | 184 (10.8%) | 246 (24.2%) |
| $150,000 or more | 68 (4.0%) | 277 (27.2%) |
| Total | 1,710 (100.0%) | 1,017 (100.0%) |
Property Value to Household Income Ratio in Beeville
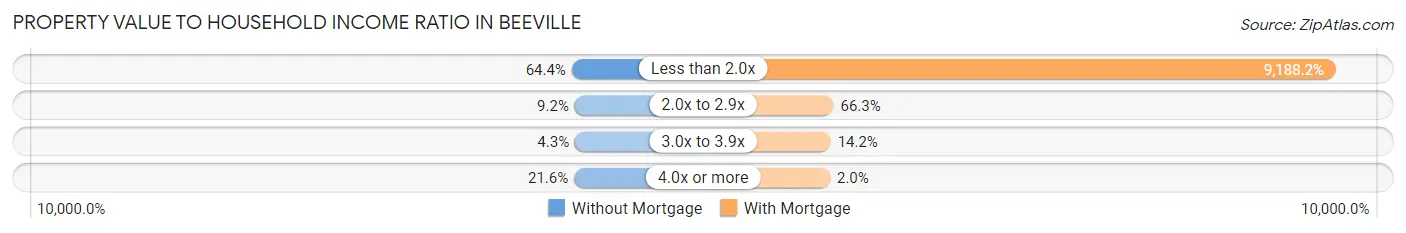
| Value-to-Income Ratio | Without Mortgage | With Mortgage |
| Less than 2.0x | 1,101 (64.4%) | 93,444 (9,188.2%) |
| 2.0x to 2.9x | 157 (9.2%) | 674 (66.3%) |
| 3.0x to 3.9x | 73 (4.3%) | 144 (14.2%) |
| 4.0x or more | 369 (21.6%) | 20 (2.0%) |
| Total | 1,710 (100.0%) | 1,017 (100.0%) |
Real Estate Taxes by Mortgage Status in Beeville
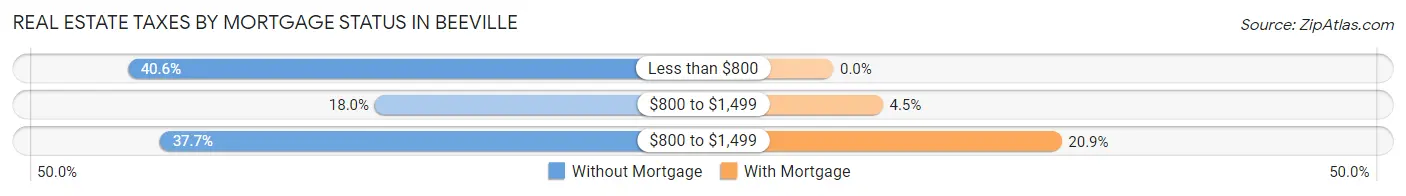
| Property Taxes | Without Mortgage | With Mortgage |
| Less than $800 | 694 (40.6%) | 0 (0.0%) |
| $800 to $1,499 | 308 (18.0%) | 46 (4.5%) |
| $800 to $1,499 | 644 (37.7%) | 212 (20.8%) |
| Total | 1,710 (100.0%) | 1,017 (100.0%) |
Health & Disability in Beeville
Health Insurance Coverage by Age in Beeville
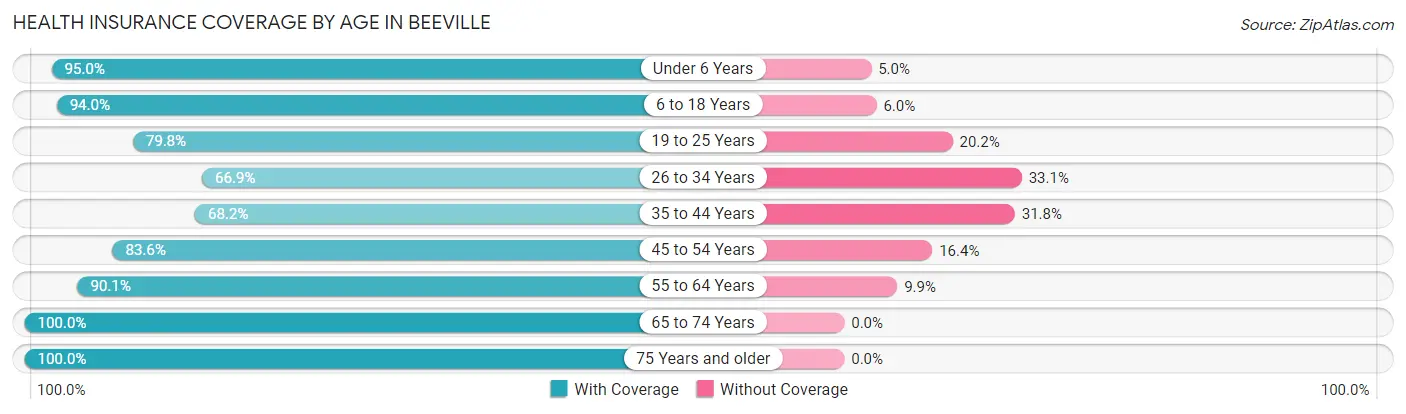
| Age Bracket | With Coverage | Without Coverage |
| Under 6 Years | 1,211 (95.0%) | 64 (5.0%) |
| 6 to 18 Years | 2,446 (94.0%) | 156 (6.0%) |
| 19 to 25 Years | 1,720 (79.8%) | 435 (20.2%) |
| 26 to 34 Years | 1,258 (66.9%) | 622 (33.1%) |
| 35 to 44 Years | 1,088 (68.2%) | 507 (31.8%) |
| 45 to 54 Years | 877 (83.6%) | 172 (16.4%) |
| 55 to 64 Years | 1,069 (90.1%) | 117 (9.9%) |
| 65 to 74 Years | 1,060 (100.0%) | 0 (0.0%) |
| 75 Years and older | 677 (100.0%) | 0 (0.0%) |
| Total | 11,406 (84.6%) | 2,073 (15.4%) |
Health Insurance Coverage by Citizenship Status in Beeville
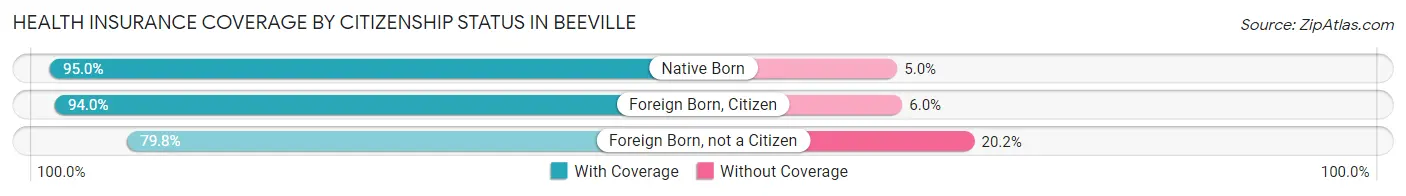
| Citizenship Status | With Coverage | Without Coverage |
| Native Born | 1,211 (95.0%) | 64 (5.0%) |
| Foreign Born, Citizen | 2,446 (94.0%) | 156 (6.0%) |
| Foreign Born, not a Citizen | 1,720 (79.8%) | 435 (20.2%) |
Health Insurance Coverage by Household Income in Beeville
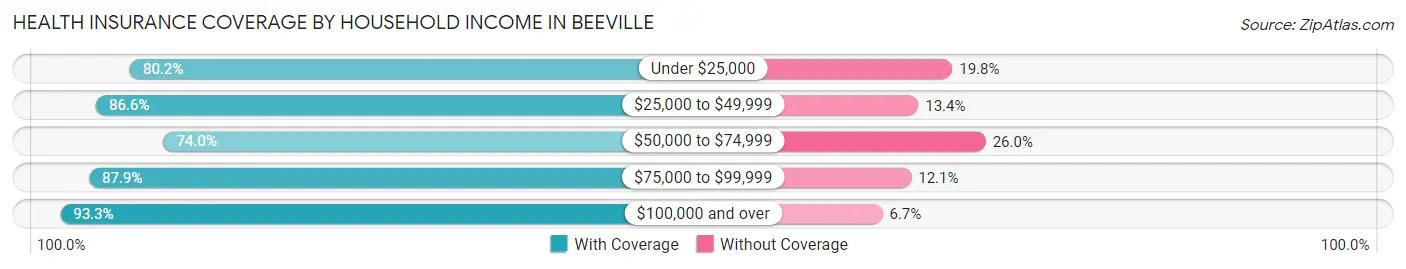
| Household Income | With Coverage | Without Coverage |
| Under $25,000 | 2,569 (80.2%) | 633 (19.8%) |
| $25,000 to $49,999 | 2,658 (86.6%) | 411 (13.4%) |
| $50,000 to $74,999 | 1,716 (74.0%) | 604 (26.0%) |
| $75,000 to $99,999 | 1,666 (87.9%) | 229 (12.1%) |
| $100,000 and over | 2,693 (93.3%) | 193 (6.7%) |
Public vs Private Health Insurance Coverage by Age in Beeville
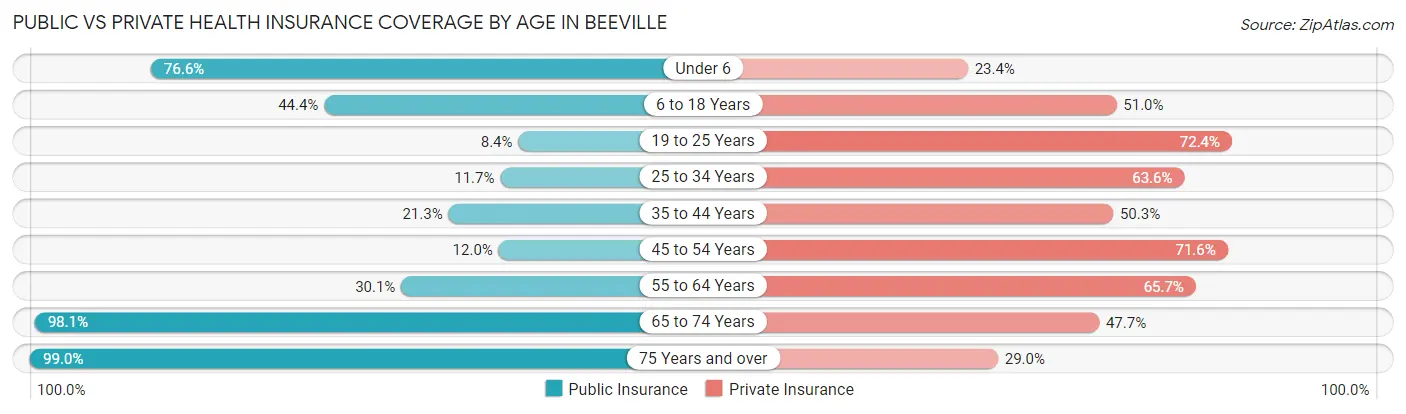
| Age Bracket | Public Insurance | Private Insurance |
| Under 6 | 976 (76.5%) | 298 (23.4%) |
| 6 to 18 Years | 1,155 (44.4%) | 1,326 (51.0%) |
| 19 to 25 Years | 180 (8.4%) | 1,560 (72.4%) |
| 25 to 34 Years | 220 (11.7%) | 1,195 (63.6%) |
| 35 to 44 Years | 340 (21.3%) | 803 (50.3%) |
| 45 to 54 Years | 126 (12.0%) | 751 (71.6%) |
| 55 to 64 Years | 357 (30.1%) | 779 (65.7%) |
| 65 to 74 Years | 1,040 (98.1%) | 506 (47.7%) |
| 75 Years and over | 670 (99.0%) | 196 (28.9%) |
| Total | 5,064 (37.6%) | 7,414 (55.0%) |
Disability Status by Sex by Age in Beeville
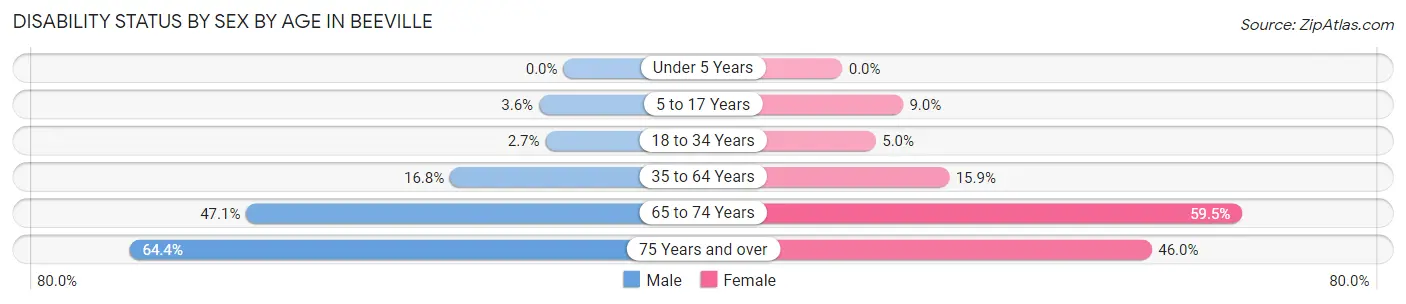
| Age Bracket | Male | Female |
| Under 5 Years | 0 (0.0%) | 0 (0.0%) |
| 5 to 17 Years | 46 (3.6%) | 137 (9.0%) |
| 18 to 34 Years | 62 (2.7%) | 91 (5.0%) |
| 35 to 64 Years | 299 (16.8%) | 326 (15.9%) |
| 65 to 74 Years | 275 (47.1%) | 283 (59.5%) |
| 75 Years and over | 181 (64.4%) | 182 (46.0%) |
Disability Class by Sex by Age in Beeville
Disability Class: Hearing Difficulty
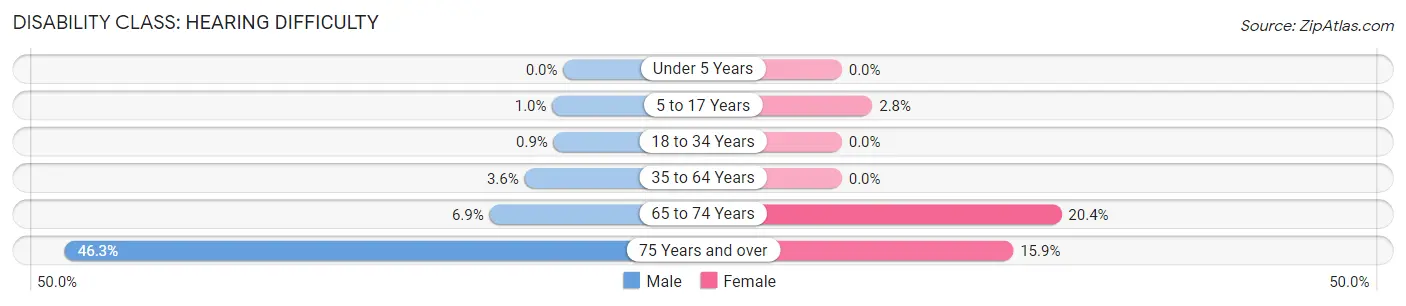
| Age Bracket | Male | Female |
| Under 5 Years | 0 (0.0%) | 0 (0.0%) |
| 5 to 17 Years | 13 (1.0%) | 43 (2.8%) |
| 18 to 34 Years | 21 (0.9%) | 0 (0.0%) |
| 35 to 64 Years | 64 (3.6%) | 0 (0.0%) |
| 65 to 74 Years | 40 (6.9%) | 97 (20.4%) |
| 75 Years and over | 130 (46.3%) | 63 (15.9%) |
Disability Class: Vision Difficulty
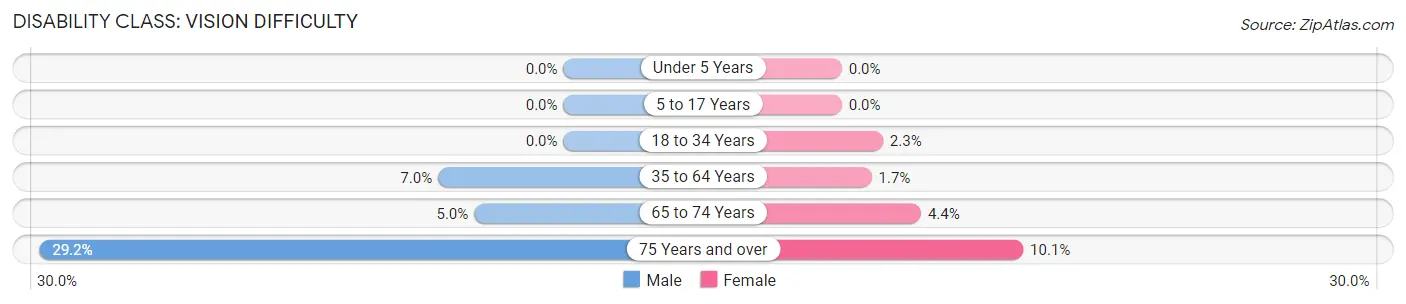
| Age Bracket | Male | Female |
| Under 5 Years | 0 (0.0%) | 0 (0.0%) |
| 5 to 17 Years | 0 (0.0%) | 0 (0.0%) |
| 18 to 34 Years | 0 (0.0%) | 42 (2.3%) |
| 35 to 64 Years | 124 (7.0%) | 34 (1.7%) |
| 65 to 74 Years | 29 (5.0%) | 21 (4.4%) |
| 75 Years and over | 82 (29.2%) | 40 (10.1%) |
Disability Class: Cognitive Difficulty
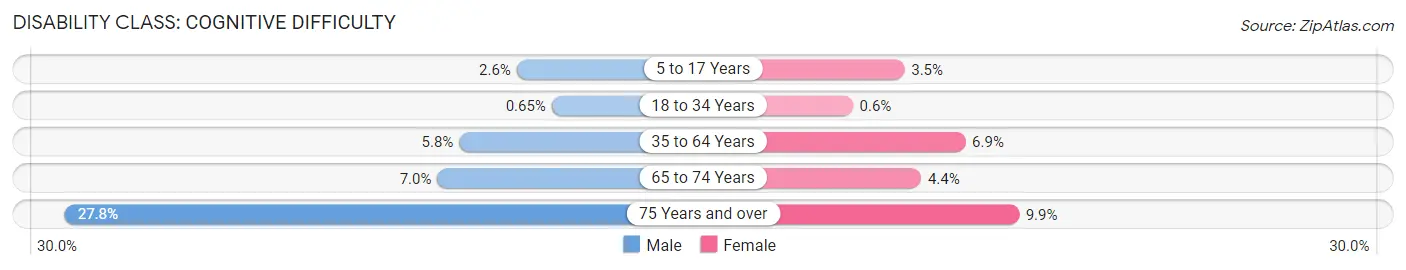
| Age Bracket | Male | Female |
| 5 to 17 Years | 33 (2.6%) | 53 (3.5%) |
| 18 to 34 Years | 15 (0.6%) | 11 (0.6%) |
| 35 to 64 Years | 103 (5.8%) | 141 (6.9%) |
| 65 to 74 Years | 41 (7.0%) | 21 (4.4%) |
| 75 Years and over | 78 (27.8%) | 39 (9.9%) |
Disability Class: Ambulatory Difficulty
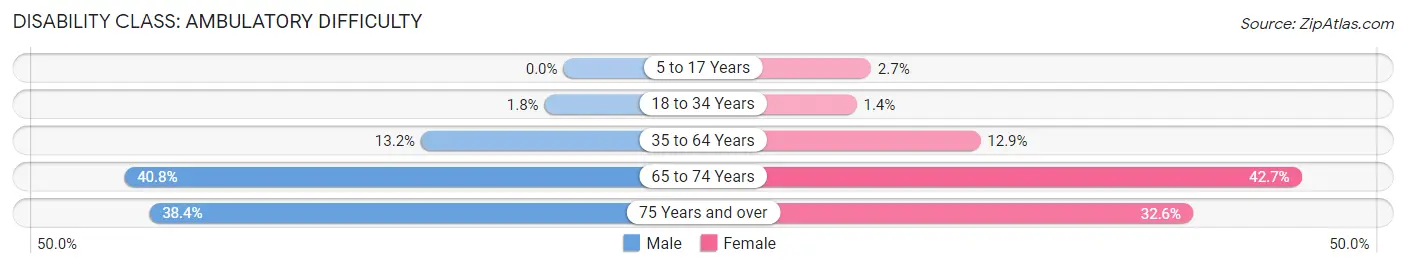
| Age Bracket | Male | Female |
| 5 to 17 Years | 0 (0.0%) | 41 (2.7%) |
| 18 to 34 Years | 41 (1.8%) | 25 (1.4%) |
| 35 to 64 Years | 235 (13.2%) | 264 (12.9%) |
| 65 to 74 Years | 238 (40.7%) | 203 (42.6%) |
| 75 Years and over | 108 (38.4%) | 129 (32.6%) |
Disability Class: Self-Care Difficulty
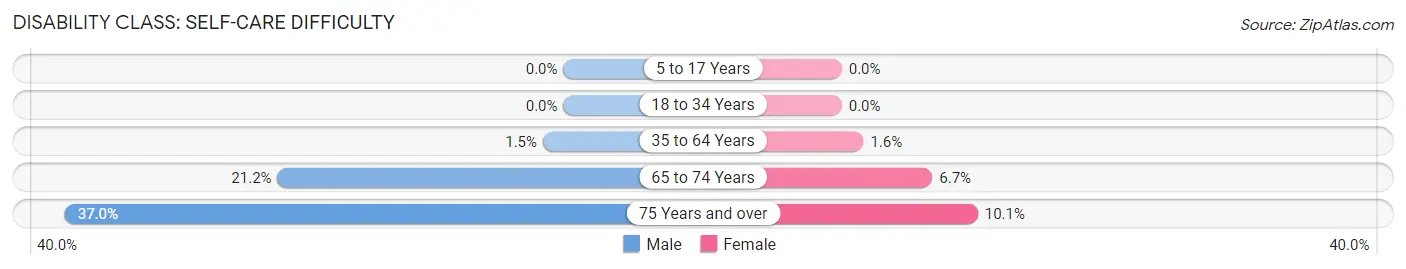
| Age Bracket | Male | Female |
| 5 to 17 Years | 0 (0.0%) | 0 (0.0%) |
| 18 to 34 Years | 0 (0.0%) | 0 (0.0%) |
| 35 to 64 Years | 27 (1.5%) | 33 (1.6%) |
| 65 to 74 Years | 124 (21.2%) | 32 (6.7%) |
| 75 Years and over | 104 (37.0%) | 40 (10.1%) |
Technology Access in Beeville
Computing Device Access in Beeville
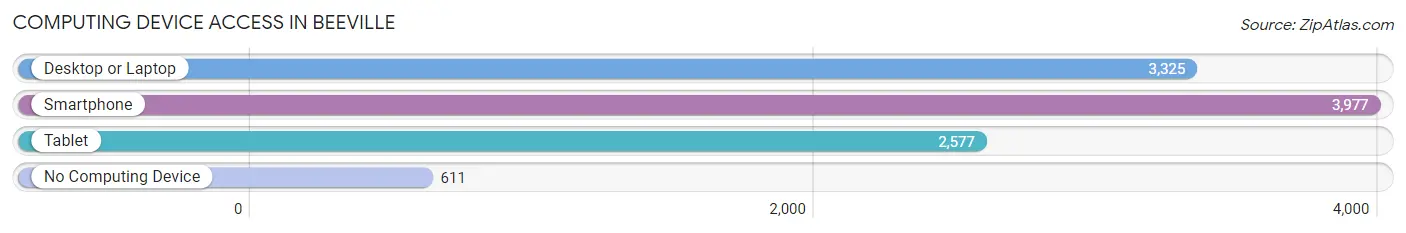
| Device Type | # Households | % Households |
| Desktop or Laptop | 3,325 | 68.6% |
| Smartphone | 3,977 | 82.1% |
| Tablet | 2,577 | 53.2% |
| No Computing Device | 611 | 12.6% |
| Total | 4,847 | 100.0% |
Internet Access in Beeville
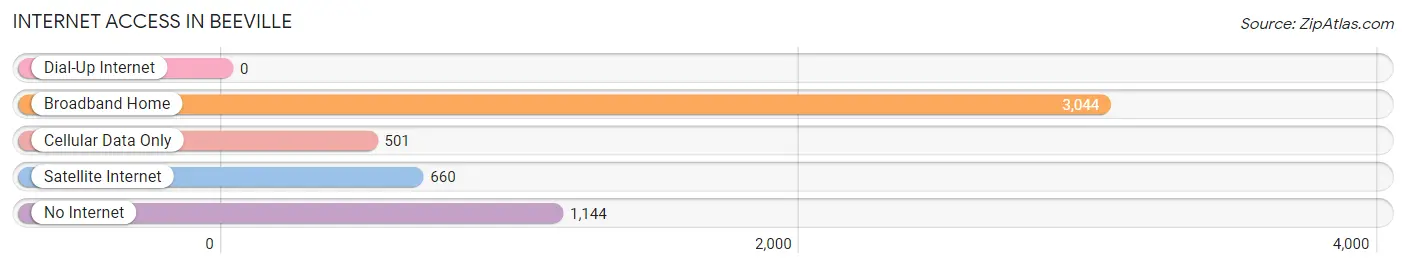
| Internet Type | # Households | % Households |
| Dial-Up Internet | 0 | 0.0% |
| Broadband Home | 3,044 | 62.8% |
| Cellular Data Only | 501 | 10.3% |
| Satellite Internet | 660 | 13.6% |
| No Internet | 1,144 | 23.6% |
| Total | 4,847 | 100.0% |
Beeville Summary
Beeville is a city located in Bee County, Texas, United States. It is the county seat of Bee County and is located in the Coastal Bend region of South Texas. The population of Beeville was 13,129 at the 2010 census.
History
Beeville was founded in 1859 by James B. Miller, a rancher from the area. The town was named after Miller's ranch, which was named after the many honeybees that lived in the area. The town was officially incorporated in 1871.
In the late 19th century, Beeville was a major center for the cattle industry. The town was also home to a large number of sheep and goat ranches. In the early 20th century, Beeville was a major center for the oil industry. The town was home to several oil refineries and was the site of the first oil well in Texas.
Geography
Beeville is located at 28°24'25" North, 97°45'25" West (28.406944, -97.756944). The city is situated in the Coastal Bend region of South Texas, approximately 50 miles south of Corpus Christi and 100 miles north of Brownsville.
The city has a total area of 5.3 square miles, all of which is land. Beeville is located in the Chihuahuan Desert, and the climate is generally hot and dry. The average temperature in the summer is around 90°F, and the average temperature in the winter is around 60°F.
Economy
Beeville's economy is largely based on the oil and gas industry. The city is home to several oil refineries and is the site of the first oil well in Texas. The city is also home to several manufacturing companies, including a large paper mill.
The city is also home to a large number of retail stores, restaurants, and other businesses. The city is home to a large number of government offices, including the Bee County Courthouse.
Demographics
As of the 2010 census, there were 13,129 people, 4,845 households, and 3,323 families residing in the city. The population density was 2,459.3 people per square mile. The racial makeup of the city was 75.2% White, 1.7% African American, 0.7% Native American, 0.5% Asian, 0.1% Pacific Islander, 19.3% from other races, and 2.6% from two or more races. Hispanic or Latino of any race were 44.2% of the population.
The median income for a household in the city was $30,945, and the median income for a family was $37,945. The per capita income for the city was $15,945. About 22.2% of families and 25.7% of the population were below the poverty line, including 36.2% of those under age 18 and 16.2% of those age 65 or over.
Conclusion
Beeville is a city located in Bee County, Texas, United States. It is the county seat of Bee County and is located in the Coastal Bend region of South Texas. The population of Beeville was 13,129 at the 2010 census. The city has a long history, dating back to 1859 when it was founded by James B. Miller. The city's economy is largely based on the oil and gas industry, and it is also home to several manufacturing companies and retail stores. The population of Beeville is diverse, with a majority of the population being Hispanic or Latino. The median income for a household in the city was $30,945, and the median income for a family was $37,945.
Common Questions
What is Per Capita Income in Beeville?
Per Capita income in Beeville is $23,481.
What is the Median Family Income in Beeville?
Median Family Income in Beeville is $55,697.
What is the Median Household income in Beeville?
Median Household Income in Beeville is $47,815.
What is Income or Wage Gap in Beeville?
Income or Wage Gap in Beeville is 47.7%.
Women in Beeville earn 52.3 cents for every dollar earned by a man.
What is Inequality or Gini Index in Beeville?
Inequality or Gini Index in Beeville is 0.49.
What is the Total Population of Beeville?
Total Population of Beeville is 13,637.
What is the Total Male Population of Beeville?
Total Male Population of Beeville is 6,770.
What is the Total Female Population of Beeville?
Total Female Population of Beeville is 6,867.
What is the Ratio of Males per 100 Females in Beeville?
There are 98.59 Males per 100 Females in Beeville.
What is the Ratio of Females per 100 Males in Beeville?
There are 101.43 Females per 100 Males in Beeville.
What is the Median Population Age in Beeville?
Median Population Age in Beeville is 28.5 Years.
What is the Average Family Size in Beeville
Average Family Size in Beeville is 3.6 People.
What is the Average Household Size in Beeville
Average Household Size in Beeville is 2.8 People.
How Large is the Labor Force in Beeville?
There are 6,301 People in the Labor Forcein in Beeville.
What is the Percentage of People in the Labor Force in Beeville?
61.7% of People are in the Labor Force in Beeville.
What is the Unemployment Rate in Beeville?
Unemployment Rate in Beeville is 7.9%.