Beckville, TX Map & Demographics
Beckville Map
Beckville Overview
$24,531
PER CAPITA INCOME
$78,214
AVG FAMILY INCOME
$48,750
AVG HOUSEHOLD INCOME
35.8%
WAGE / INCOME GAP [ % ]
64.2¢/ $1
WAGE / INCOME GAP [ $ ]
0.38
INEQUALITY / GINI INDEX
811
TOTAL POPULATION
393
MALE POPULATION
418
FEMALE POPULATION
94.02
MALES / 100 FEMALES
106.36
FEMALES / 100 MALES
30.6
MEDIAN AGE
3.9
AVG FAMILY SIZE
3.1
AVG HOUSEHOLD SIZE
359
LABOR FORCE [ PEOPLE ]
59.9%
PERCENT IN LABOR FORCE
4.5%
UNEMPLOYMENT RATE
Beckville Zip Codes
Income in Beckville
Income Overview in Beckville
Per Capita Income in Beckville is $24,531, while median incomes of families and households are $78,214 and $48,750 respectively.
| Characteristic | Number | Measure |
| Per Capita Income | 811 | $24,531 |
| Median Family Income | 178 | $78,214 |
| Mean Family Income | 178 | $74,428 |
| Median Household Income | 264 | $48,750 |
| Mean Household Income | 264 | $66,108 |
| Income Deficit | 178 | $0 |
| Wage / Income Gap (%) | 811 | 35.84% |
| Wage / Income Gap ($) | 811 | 64.16¢ per $1 |
| Gini / Inequality Index | 811 | 0.38 |
Earnings by Sex in Beckville
Average Earnings in Beckville are $29,954, $44,063 for men and $28,272 for women, a difference of 35.8%.
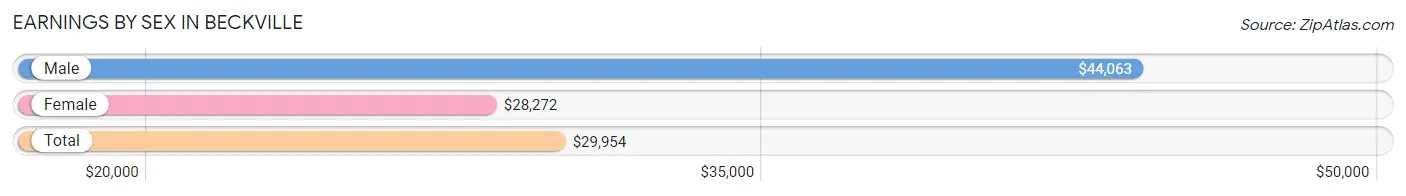
| Sex | Number | Average Earnings |
| Male | 228 (57.4%) | $44,063 |
| Female | 169 (42.6%) | $28,272 |
| Total | 397 (100.0%) | $29,954 |
Earnings by Sex by Income Bracket in Beckville
The most common earnings brackets in Beckville are $25,000 to $29,999 for men (47 | 20.6%) and $25,000 to $29,999 for women (47 | 27.8%).
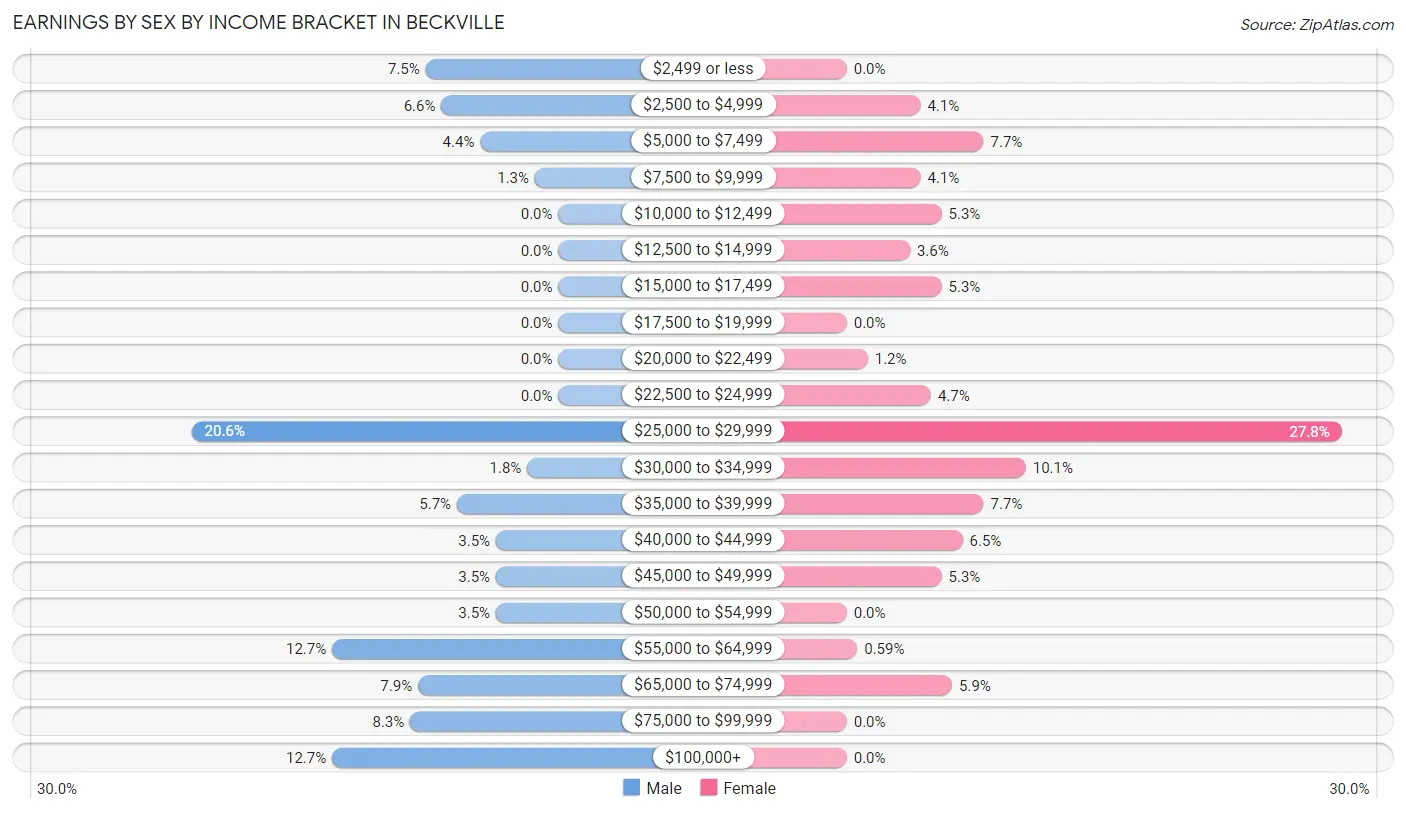
| Income | Male | Female |
| $2,499 or less | 17 (7.5%) | 0 (0.0%) |
| $2,500 to $4,999 | 15 (6.6%) | 7 (4.1%) |
| $5,000 to $7,499 | 10 (4.4%) | 13 (7.7%) |
| $7,500 to $9,999 | 3 (1.3%) | 7 (4.1%) |
| $10,000 to $12,499 | 0 (0.0%) | 9 (5.3%) |
| $12,500 to $14,999 | 0 (0.0%) | 6 (3.5%) |
| $15,000 to $17,499 | 0 (0.0%) | 9 (5.3%) |
| $17,500 to $19,999 | 0 (0.0%) | 0 (0.0%) |
| $20,000 to $22,499 | 0 (0.0%) | 2 (1.2%) |
| $22,500 to $24,999 | 0 (0.0%) | 8 (4.7%) |
| $25,000 to $29,999 | 47 (20.6%) | 47 (27.8%) |
| $30,000 to $34,999 | 4 (1.8%) | 17 (10.1%) |
| $35,000 to $39,999 | 13 (5.7%) | 13 (7.7%) |
| $40,000 to $44,999 | 8 (3.5%) | 11 (6.5%) |
| $45,000 to $49,999 | 8 (3.5%) | 9 (5.3%) |
| $50,000 to $54,999 | 8 (3.5%) | 0 (0.0%) |
| $55,000 to $64,999 | 29 (12.7%) | 1 (0.6%) |
| $65,000 to $74,999 | 18 (7.9%) | 10 (5.9%) |
| $75,000 to $99,999 | 19 (8.3%) | 0 (0.0%) |
| $100,000+ | 29 (12.7%) | 0 (0.0%) |
| Total | 228 (100.0%) | 169 (100.0%) |
Earnings by Sex by Educational Attainment in Beckville
Average earnings in Beckville are $63,482 for men and $29,265 for women, a difference of 53.9%. Men with an educational attainment of college or associate's degree enjoy the highest average annual earnings of $94,583, while those with less than high school education earn the least with $56,917. Women with an educational attainment of bachelor's degree earn the most with the average annual earnings of $29,167, while those with high school diploma education have the smallest earnings of $28,409.
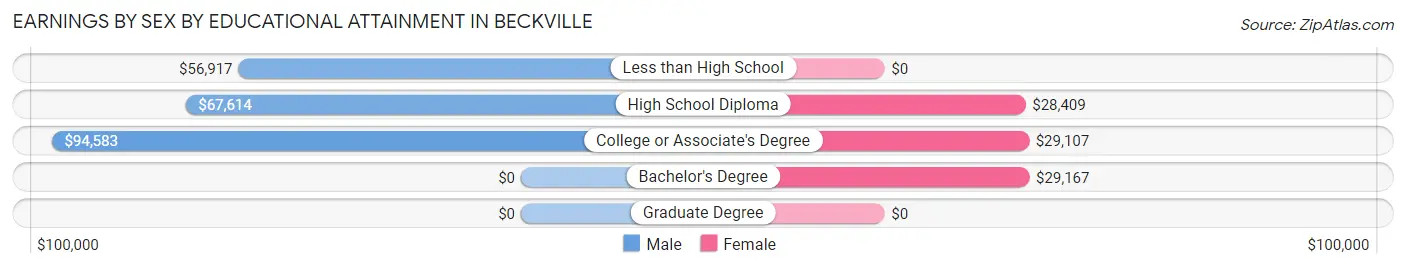
| Educational Attainment | Male Income | Female Income |
| Less than High School | $56,917 | $0 |
| High School Diploma | $67,614 | $28,409 |
| College or Associate's Degree | $94,583 | $29,107 |
| Bachelor's Degree | - | - |
| Graduate Degree | - | - |
| Total | $63,482 | $29,265 |
Family Income in Beckville
Family Income Brackets in Beckville
According to the Beckville family income data, there are 59 families falling into the $75,000 to $99,999 income range, which is the most common income bracket and makes up 33.2% of all families.
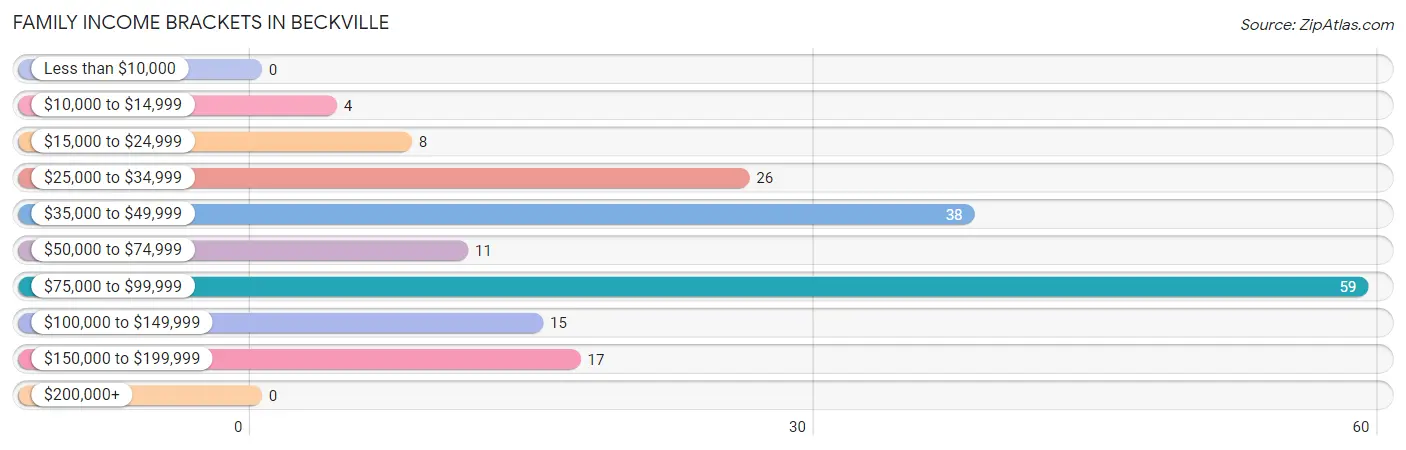
| Income Bracket | # Families | % Families |
| Less than $10,000 | 0 | 0.0% |
| $10,000 to $14,999 | 4 | 2.2% |
| $15,000 to $24,999 | 8 | 4.5% |
| $25,000 to $34,999 | 26 | 14.6% |
| $35,000 to $49,999 | 38 | 21.3% |
| $50,000 to $74,999 | 11 | 6.2% |
| $75,000 to $99,999 | 59 | 33.1% |
| $100,000 to $149,999 | 15 | 8.4% |
| $150,000 to $199,999 | 17 | 9.6% |
| $200,000+ | 0 | 0.0% |
Family Income by Famaliy Size in Beckville
5-person families (27 | 15.2%) account for the highest median family income in Beckville with $91,518 per family, while 2-person families (54 | 30.3%) have the highest median income of $40,938 per family member.
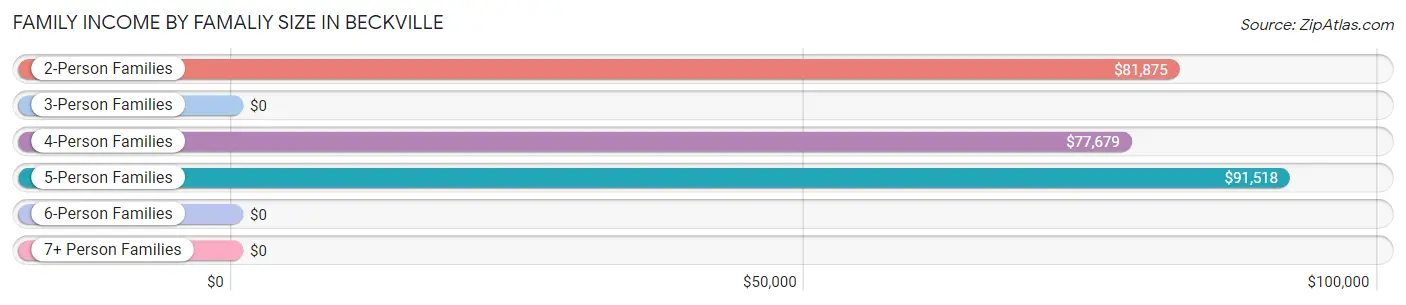
| Income Bracket | # Families | Median Income |
| 2-Person Families | 54 (30.3%) | $81,875 |
| 3-Person Families | 50 (28.1%) | $0 |
| 4-Person Families | 31 (17.4%) | $77,679 |
| 5-Person Families | 27 (15.2%) | $91,518 |
| 6-Person Families | 5 (2.8%) | $0 |
| 7+ Person Families | 11 (6.2%) | $0 |
| Total | 178 (100.0%) | $78,214 |
Family Income by Number of Earners in Beckville
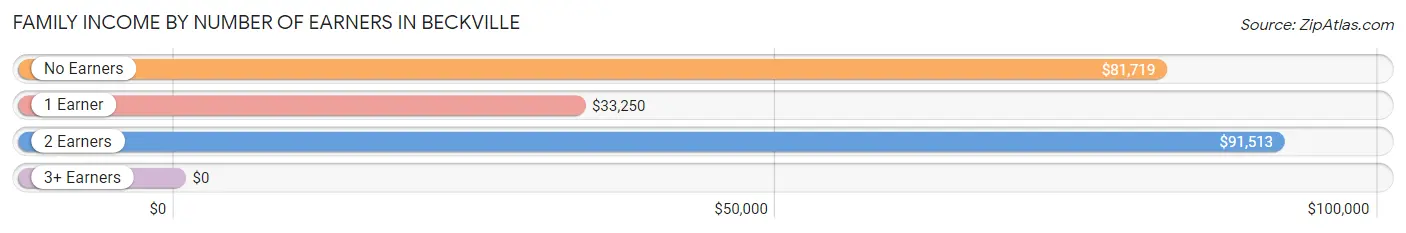
| Number of Earners | # Families | Median Income |
| No Earners | 19 (10.7%) | $81,719 |
| 1 Earner | 57 (32.0%) | $33,250 |
| 2 Earners | 87 (48.9%) | $91,513 |
| 3+ Earners | 15 (8.4%) | $0 |
| Total | 178 (100.0%) | $78,214 |
Household Income in Beckville
Household Income Brackets in Beckville
With 61 households falling in the category, the $25,000 to $34,999 income range is the most frequent in Beckville, accounting for 23.1% of all households.
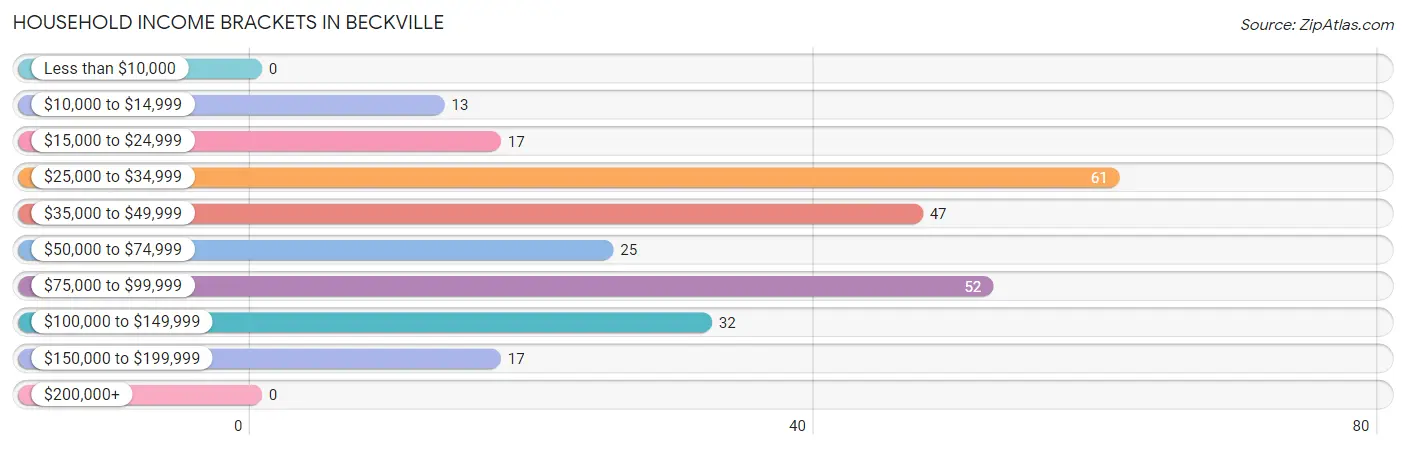
| Income Bracket | # Households | % Households |
| Less than $10,000 | 0 | 0.0% |
| $10,000 to $14,999 | 13 | 4.9% |
| $15,000 to $24,999 | 17 | 6.4% |
| $25,000 to $34,999 | 61 | 23.1% |
| $35,000 to $49,999 | 47 | 17.8% |
| $50,000 to $74,999 | 25 | 9.5% |
| $75,000 to $99,999 | 52 | 19.7% |
| $100,000 to $149,999 | 32 | 12.1% |
| $150,000 to $199,999 | 17 | 6.4% |
| $200,000+ | 0 | 0.0% |
Household Income by Householder Age in Beckville
The median household income in Beckville is $48,750, with the highest median household income of $45,625 found in the 45 to 64 years age bracket for the primary householder. A total of 87 households (33.0%) fall into this category. Meanwhile, the 15 to 24 years age bracket for the primary householder has the lowest median household income of $0, with 3 households (1.1%) in this group.
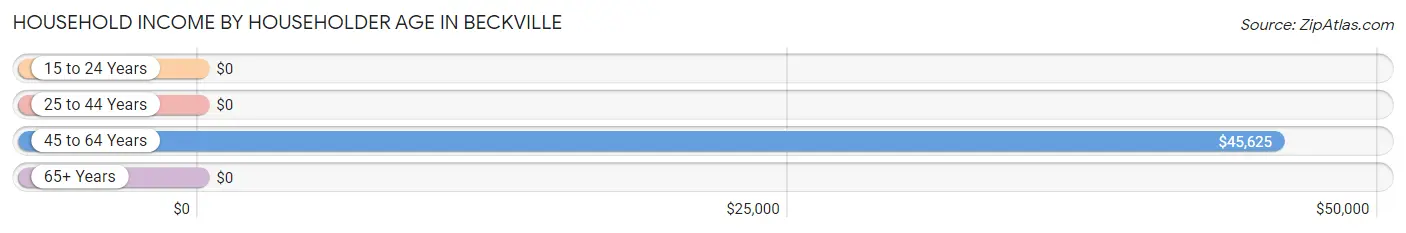
| Income Bracket | # Households | Median Income |
| 15 to 24 Years | 3 (1.1%) | $0 |
| 25 to 44 Years | 118 (44.7%) | $0 |
| 45 to 64 Years | 87 (33.0%) | $45,625 |
| 65+ Years | 56 (21.2%) | $0 |
| Total | 264 (100.0%) | $48,750 |
Poverty in Beckville
Income Below Poverty by Sex and Age in Beckville
With 14.2% poverty level for males and 12.9% for females among the residents of Beckville, 15 year old males and 15 year old females are the most vulnerable to poverty, with 12 males (100.0%) and 7 females (100.0%) in their respective age groups living below the poverty level.
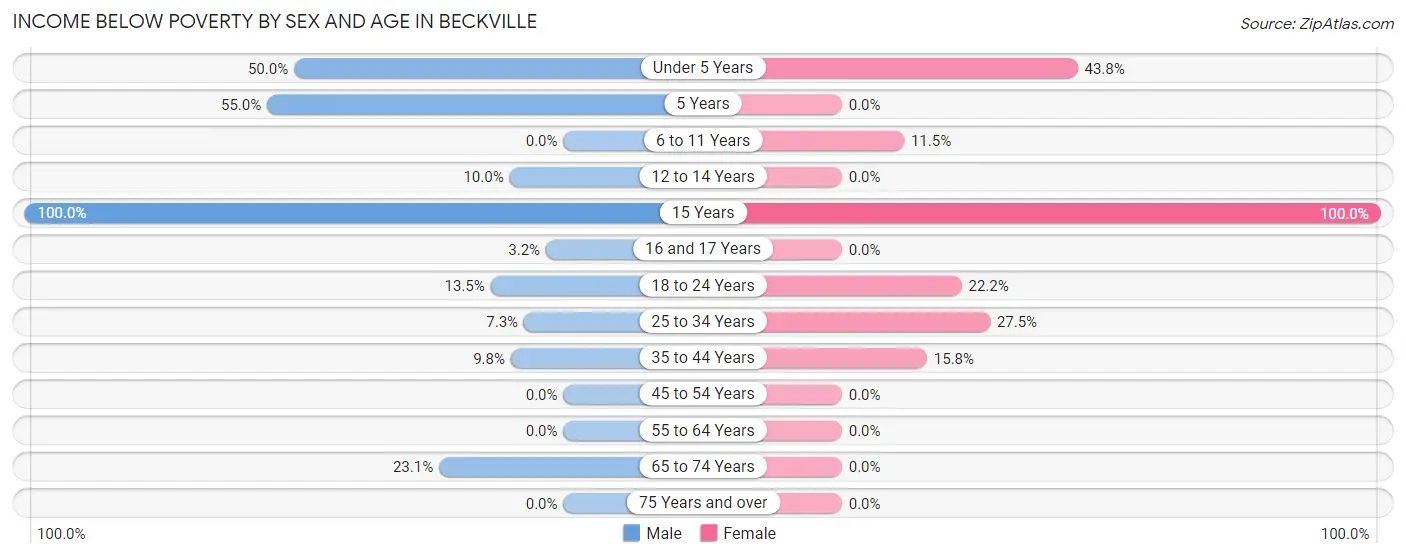
| Age Bracket | Male | Female |
| Under 5 Years | 7 (50.0%) | 14 (43.8%) |
| 5 Years | 11 (55.0%) | 0 (0.0%) |
| 6 to 11 Years | 0 (0.0%) | 6 (11.5%) |
| 12 to 14 Years | 2 (10.0%) | 0 (0.0%) |
| 15 Years | 12 (100.0%) | 7 (100.0%) |
| 16 and 17 Years | 1 (3.2%) | 0 (0.0%) |
| 18 to 24 Years | 10 (13.5%) | 4 (22.2%) |
| 25 to 34 Years | 3 (7.3%) | 11 (27.5%) |
| 35 to 44 Years | 4 (9.8%) | 12 (15.8%) |
| 45 to 54 Years | 0 (0.0%) | 0 (0.0%) |
| 55 to 64 Years | 0 (0.0%) | 0 (0.0%) |
| 65 to 74 Years | 6 (23.1%) | 0 (0.0%) |
| 75 Years and over | 0 (0.0%) | 0 (0.0%) |
| Total | 56 (14.2%) | 54 (12.9%) |
Income Above Poverty by Sex and Age in Beckville
According to the poverty statistics in Beckville, males aged 6 to 11 years and females aged 12 to 14 years are the age groups that are most secure financially, with 100.0% of males and 100.0% of females in these age groups living above the poverty line.
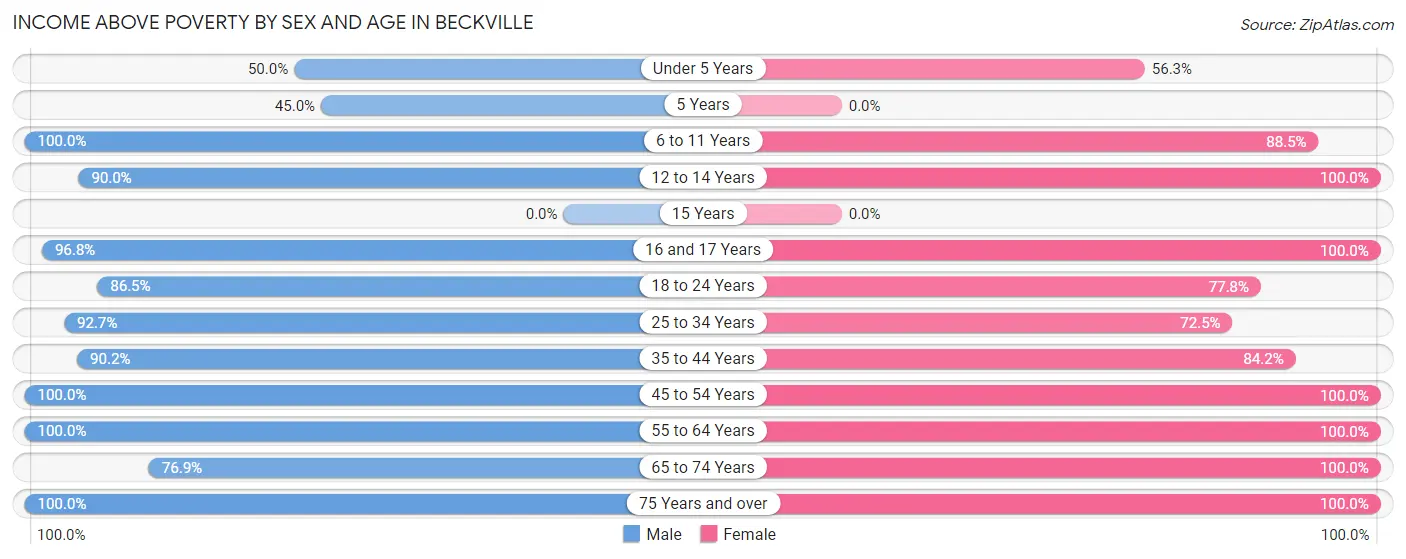
| Age Bracket | Male | Female |
| Under 5 Years | 7 (50.0%) | 18 (56.2%) |
| 5 Years | 9 (45.0%) | 0 (0.0%) |
| 6 to 11 Years | 35 (100.0%) | 46 (88.5%) |
| 12 to 14 Years | 18 (90.0%) | 20 (100.0%) |
| 15 Years | 0 (0.0%) | 0 (0.0%) |
| 16 and 17 Years | 30 (96.8%) | 28 (100.0%) |
| 18 to 24 Years | 64 (86.5%) | 14 (77.8%) |
| 25 to 34 Years | 38 (92.7%) | 29 (72.5%) |
| 35 to 44 Years | 37 (90.2%) | 64 (84.2%) |
| 45 to 54 Years | 33 (100.0%) | 54 (100.0%) |
| 55 to 64 Years | 36 (100.0%) | 46 (100.0%) |
| 65 to 74 Years | 20 (76.9%) | 30 (100.0%) |
| 75 Years and over | 10 (100.0%) | 15 (100.0%) |
| Total | 337 (85.8%) | 364 (87.1%) |
Income Below Poverty Among Married-Couple Families in Beckville
The poverty statistics for married-couple families in Beckville show that 8.9% or 11 of the total 124 families live below the poverty line. Families with 3 or 4 children have the highest poverty rate of 55.0%, comprising of 11 families. On the other hand, families with no children have the lowest poverty rate of 0.0%, which includes 0 families.
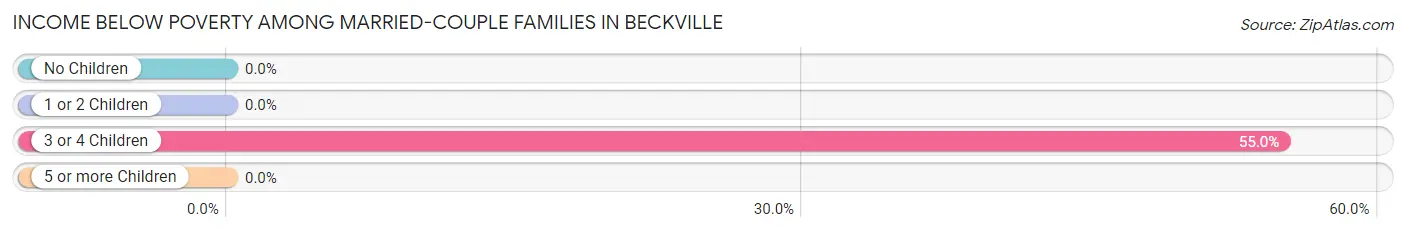
| Children | Above Poverty | Below Poverty |
| No Children | 59 (100.0%) | 0 (0.0%) |
| 1 or 2 Children | 45 (100.0%) | 0 (0.0%) |
| 3 or 4 Children | 9 (45.0%) | 11 (55.0%) |
| 5 or more Children | 0 (0.0%) | 0 (0.0%) |
| Total | 113 (91.1%) | 11 (8.9%) |
Income Below Poverty Among Single-Parent Households in Beckville
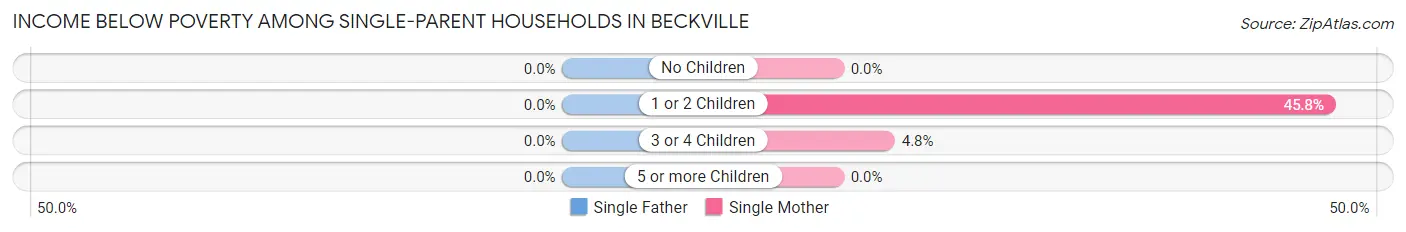
| Children | Single Father | Single Mother |
| No Children | 0 (0.0%) | 0 (0.0%) |
| 1 or 2 Children | 0 (0.0%) | 11 (45.8%) |
| 3 or 4 Children | 0 (0.0%) | 1 (4.8%) |
| 5 or more Children | 0 (0.0%) | 0 (0.0%) |
| Total | 0 (0.0%) | 12 (25.5%) |
Income Below Poverty Among Married-Couple vs Single-Parent Households in Beckville
The poverty data for Beckville shows that 11 of the married-couple family households (8.9%) and 12 of the single-parent households (22.2%) are living below the poverty level. Within the married-couple family households, those with 3 or 4 children have the highest poverty rate, with 11 households (55.0%) falling below the poverty line. Among the single-parent households, those with 1 or 2 children have the highest poverty rate, with 11 household (45.8%) living below poverty.
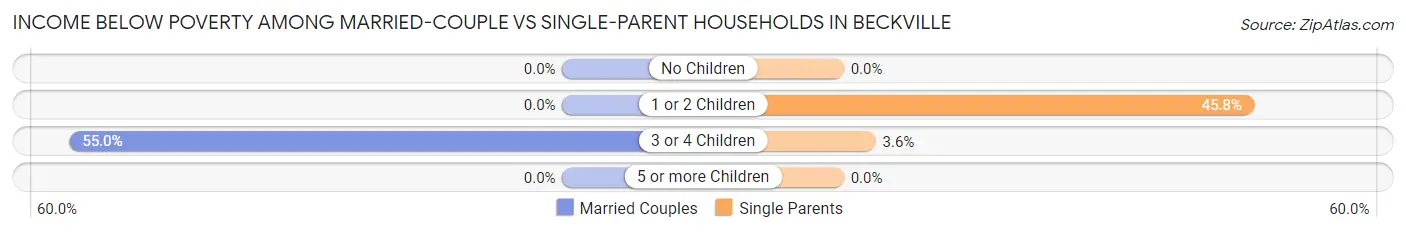
| Children | Married-Couple Families | Single-Parent Households |
| No Children | 0 (0.0%) | 0 (0.0%) |
| 1 or 2 Children | 0 (0.0%) | 11 (45.8%) |
| 3 or 4 Children | 11 (55.0%) | 1 (3.6%) |
| 5 or more Children | 0 (0.0%) | 0 (0.0%) |
| Total | 11 (8.9%) | 12 (22.2%) |
Race in Beckville
The most populous races in Beckville are White / Caucasian (527 | 65.0%), Hispanic or Latino (144 | 17.8%), and Black / African American (123 | 15.2%).
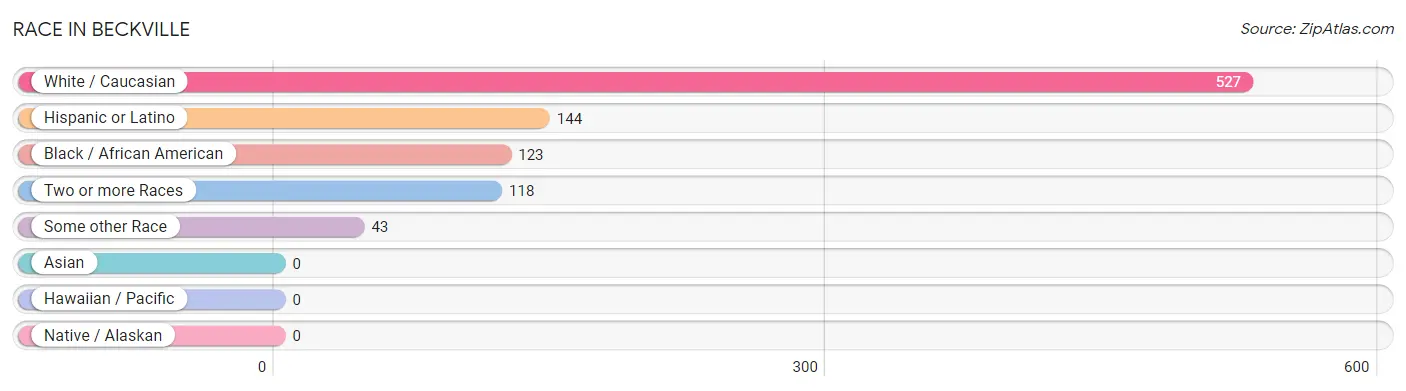
| Race | # Population | % Population |
| Asian | 0 | 0.0% |
| Black / African American | 123 | 15.2% |
| Hawaiian / Pacific | 0 | 0.0% |
| Hispanic or Latino | 144 | 17.8% |
| Native / Alaskan | 0 | 0.0% |
| White / Caucasian | 527 | 65.0% |
| Two or more Races | 118 | 14.5% |
| Some other Race | 43 | 5.3% |
| Total | 811 | 100.0% |
Ancestry in Beckville
The most populous ancestries reported in Beckville are Irish (191 | 23.5%), American (150 | 18.5%), Mexican (144 | 17.8%), German (102 | 12.6%), and English (76 | 9.4%), together accounting for 81.8% of all Beckville residents.

| Ancestry | # Population | % Population |
| American | 150 | 18.5% |
| Cherokee | 7 | 0.9% |
| English | 76 | 9.4% |
| French | 20 | 2.5% |
| French Canadian | 6 | 0.7% |
| German | 102 | 12.6% |
| Iranian | 44 | 5.4% |
| Irish | 191 | 23.5% |
| Italian | 16 | 2.0% |
| Mexican | 144 | 17.8% |
| Norwegian | 9 | 1.1% |
| Swedish | 2 | 0.3% | View All 12 Rows |
Immigrants in Beckville
The most numerous immigrant groups reported in Beckville came from Central America (59 | 7.3%), Latin America (59 | 7.3%), and Mexico (59 | 7.3%), together accounting for 21.8% of all Beckville residents.
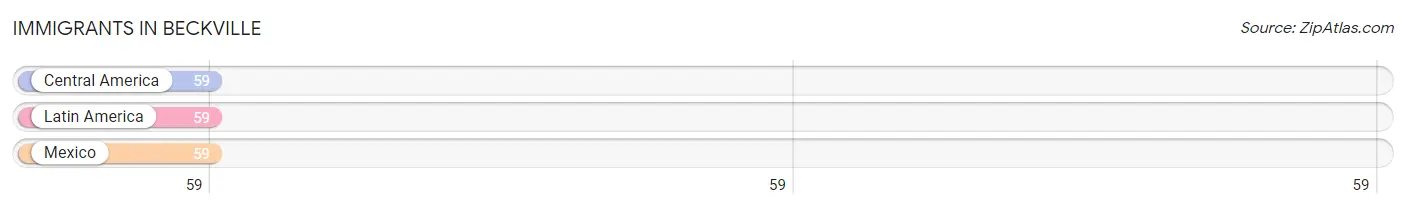
| Immigration Origin | # Population | % Population |
| Central America | 59 | 7.3% |
| Latin America | 59 | 7.3% |
| Mexico | 59 | 7.3% | View All 3 Rows |
Sex and Age in Beckville
Sex and Age in Beckville
The most populous age groups in Beckville are 15 to 19 Years (69 | 17.6%) for men and 5 to 9 Years (45 | 10.8%) for women.
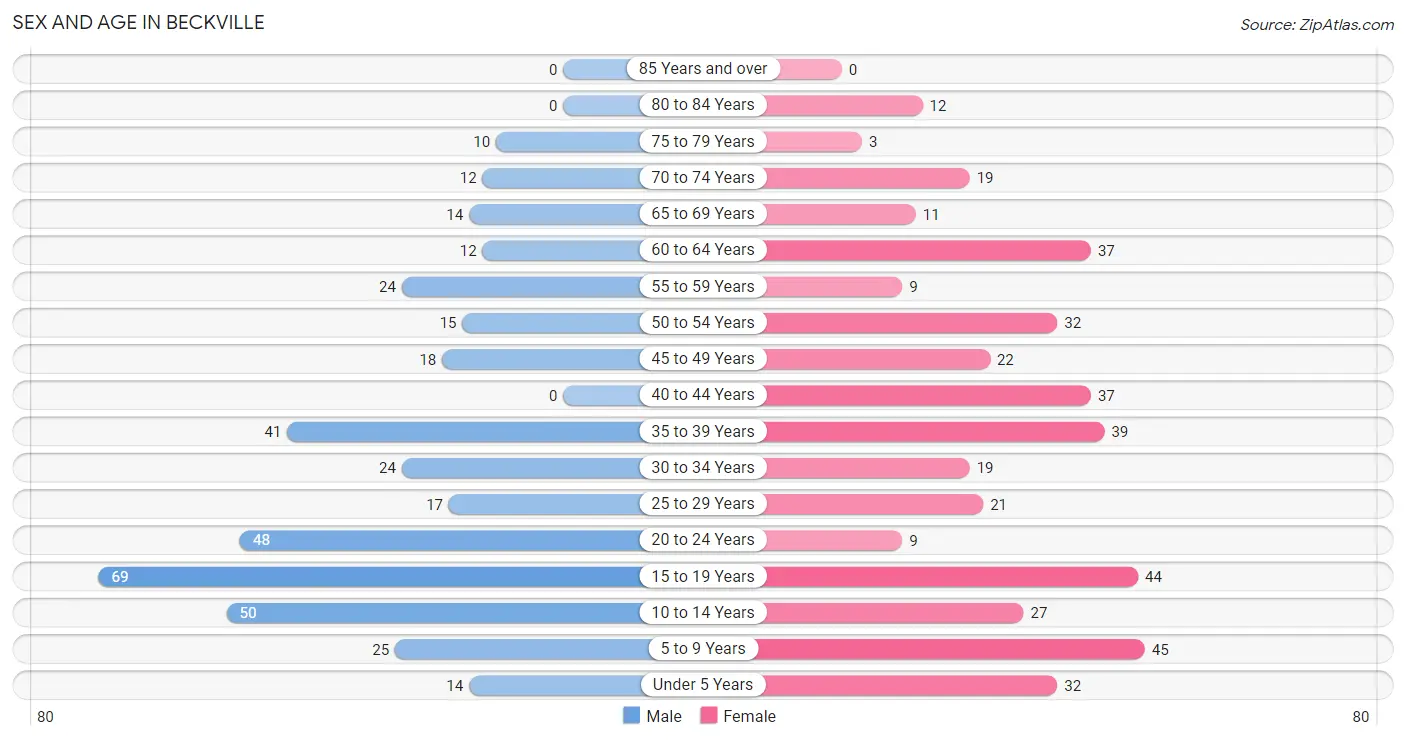
| Age Bracket | Male | Female |
| Under 5 Years | 14 (3.6%) | 32 (7.7%) |
| 5 to 9 Years | 25 (6.4%) | 45 (10.8%) |
| 10 to 14 Years | 50 (12.7%) | 27 (6.5%) |
| 15 to 19 Years | 69 (17.6%) | 44 (10.5%) |
| 20 to 24 Years | 48 (12.2%) | 9 (2.1%) |
| 25 to 29 Years | 17 (4.3%) | 21 (5.0%) |
| 30 to 34 Years | 24 (6.1%) | 19 (4.5%) |
| 35 to 39 Years | 41 (10.4%) | 39 (9.3%) |
| 40 to 44 Years | 0 (0.0%) | 37 (8.8%) |
| 45 to 49 Years | 18 (4.6%) | 22 (5.3%) |
| 50 to 54 Years | 15 (3.8%) | 32 (7.7%) |
| 55 to 59 Years | 24 (6.1%) | 9 (2.1%) |
| 60 to 64 Years | 12 (3.0%) | 37 (8.8%) |
| 65 to 69 Years | 14 (3.6%) | 11 (2.6%) |
| 70 to 74 Years | 12 (3.0%) | 19 (4.5%) |
| 75 to 79 Years | 10 (2.5%) | 3 (0.7%) |
| 80 to 84 Years | 0 (0.0%) | 12 (2.9%) |
| 85 Years and over | 0 (0.0%) | 0 (0.0%) |
| Total | 393 (100.0%) | 418 (100.0%) |
Families and Households in Beckville
Median Family Size in Beckville
The median family size in Beckville is 3.92 persons per family, with single male/father families (7 | 3.9%) accounting for the largest median family size of 5.14 persons per family. On the other hand, married-couple families (124 | 69.7%) represent the smallest median family size with 3.61 persons per family.
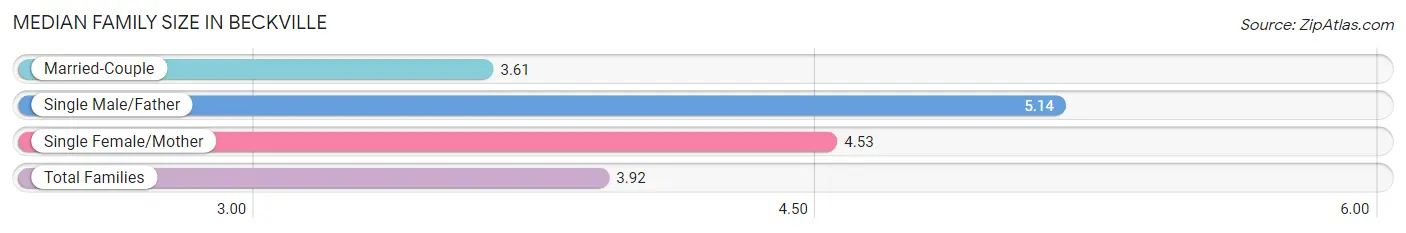
| Family Type | # Families | Family Size |
| Married-Couple | 124 (69.7%) | 3.61 |
| Single Male/Father | 7 (3.9%) | 5.14 |
| Single Female/Mother | 47 (26.4%) | 4.53 |
| Total Families | 178 (100.0%) | 3.92 |
Median Household Size in Beckville
The median household size in Beckville is 3.07 persons per household, with single male/father households (7 | 2.6%) accounting for the largest median household size of 5.86 persons per household. non-family households (86 | 32.6%) represent the smallest median household size with 1.16 persons per household.
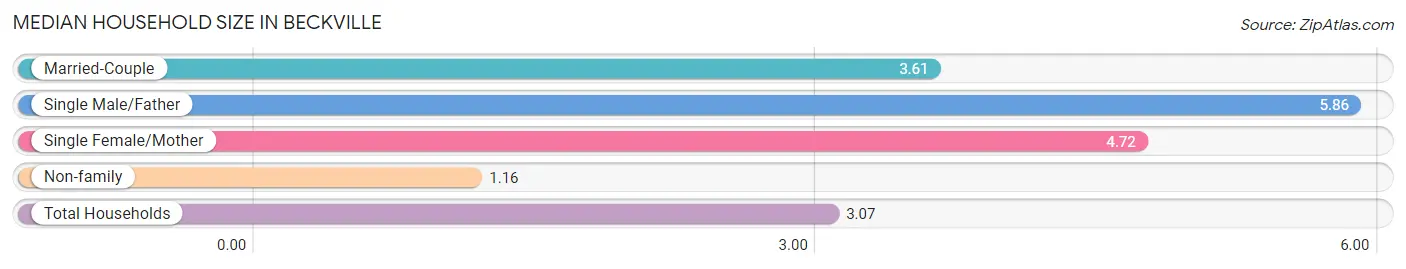
| Household Type | # Households | Household Size |
| Married-Couple | 124 (47.0%) | 3.61 |
| Single Male/Father | 7 (2.6%) | 5.86 |
| Single Female/Mother | 47 (17.8%) | 4.72 |
| Non-family | 86 (32.6%) | 1.16 |
| Total Households | 264 (100.0%) | 3.07 |
Household Size by Marriage Status in Beckville
Out of a total of 264 households in Beckville, 178 (67.4%) are family households, while 86 (32.6%) are nonfamily households. The most numerous type of family households are 2-person households, comprising 54, and the most common type of nonfamily households are 1-person households, comprising 82.
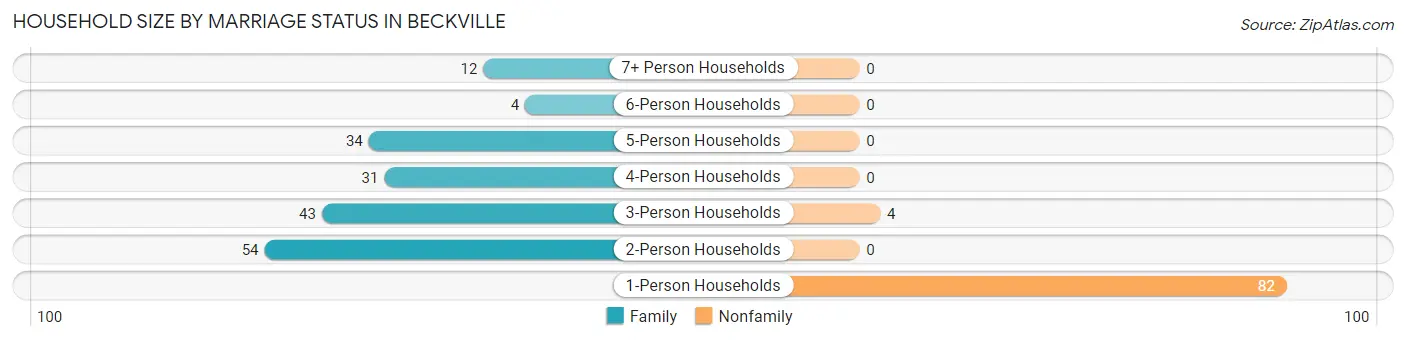
| Household Size | Family Households | Nonfamily Households |
| 1-Person Households | - | 82 (31.1%) |
| 2-Person Households | 54 (20.4%) | 0 (0.0%) |
| 3-Person Households | 43 (16.3%) | 4 (1.5%) |
| 4-Person Households | 31 (11.7%) | 0 (0.0%) |
| 5-Person Households | 34 (12.9%) | 0 (0.0%) |
| 6-Person Households | 4 (1.5%) | 0 (0.0%) |
| 7+ Person Households | 12 (4.5%) | 0 (0.0%) |
| Total | 178 (67.4%) | 86 (32.6%) |
Female Fertility in Beckville
Fertility by Age in Beckville
Average fertility rate in Beckville is 81.0 births per 1,000 women. Women in the age bracket of 35 to 50 years have the highest fertility rate with 106.0 births per 1,000 women. Women in the age bracket of 35 to 50 years acount for 68.8% of all women with births.
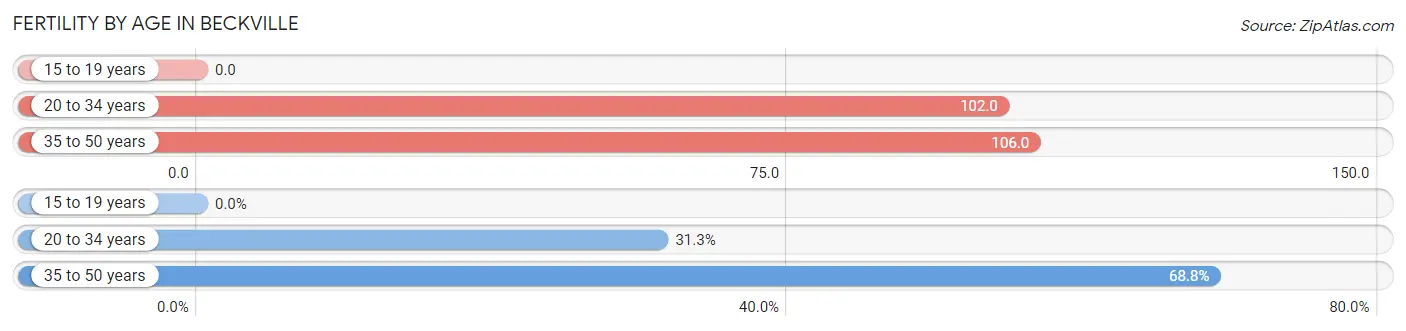
| Age Bracket | Women with Births | Births / 1,000 Women |
| 15 to 19 years | 0 (0.0%) | 0.0 |
| 20 to 34 years | 5 (31.2%) | 102.0 |
| 35 to 50 years | 11 (68.8%) | 106.0 |
| Total | 16 (100.0%) | 81.0 |
Fertility by Age by Marriage Status in Beckville
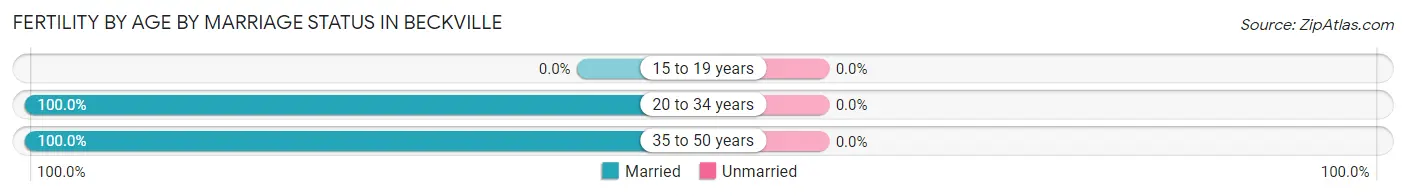
| Age Bracket | Married | Unmarried |
| 15 to 19 years | 0 (0.0%) | 0 (0.0%) |
| 20 to 34 years | 5 (100.0%) | 0 (0.0%) |
| 35 to 50 years | 11 (100.0%) | 0 (0.0%) |
| Total | 16 (100.0%) | 0 (0.0%) |
Fertility by Education in Beckville
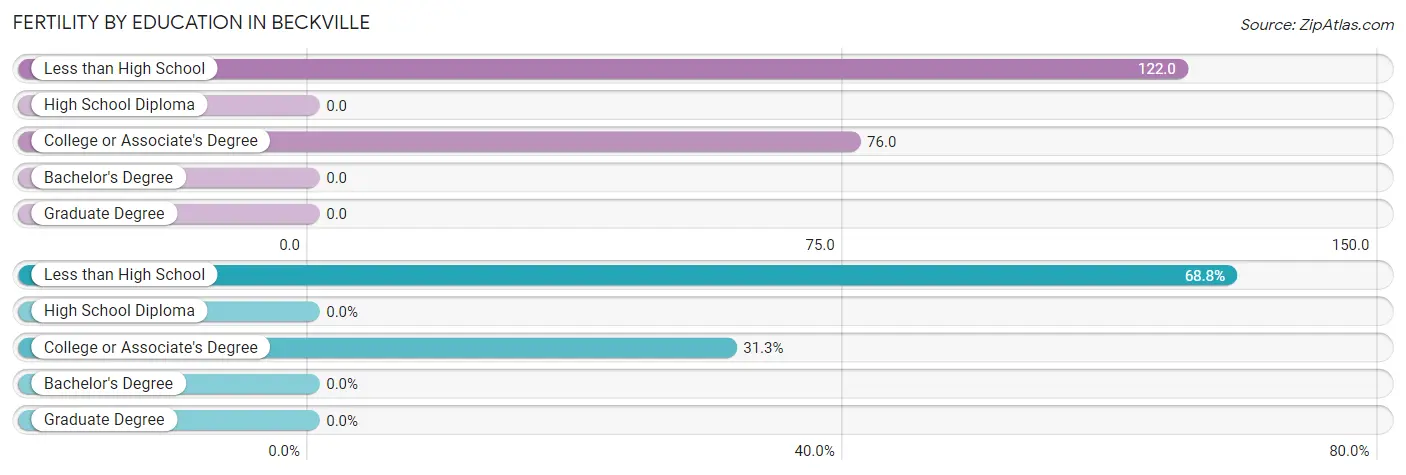
| Educational Attainment | Women with Births | Births / 1,000 Women |
| Less than High School | 11 (68.8%) | 122.0 |
| High School Diploma | 0 (0.0%) | 0.0 |
| College or Associate's Degree | 5 (31.2%) | 76.0 |
| Bachelor's Degree | 0 (0.0%) | 0.0 |
| Graduate Degree | 0 (0.0%) | 0.0 |
| Total | 16 (100.0%) | 81.0 |
Fertility by Education by Marriage Status in Beckville
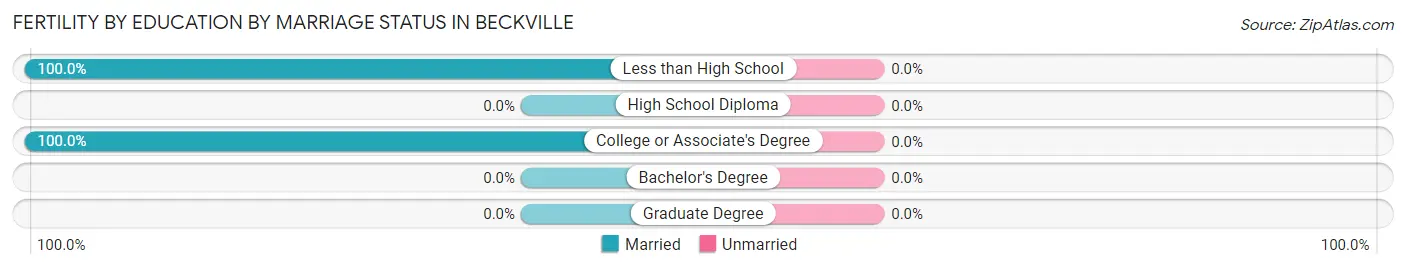
| Educational Attainment | Married | Unmarried |
| Less than High School | 11 (100.0%) | 0 (0.0%) |
| High School Diploma | 0 (0.0%) | 0 (0.0%) |
| College or Associate's Degree | 5 (100.0%) | 0 (0.0%) |
| Bachelor's Degree | 0 (0.0%) | 0 (0.0%) |
| Graduate Degree | 0 (0.0%) | 0 (0.0%) |
| Total | 16 (100.0%) | 0 (0.0%) |
Employment Characteristics in Beckville
Employment by Class of Employer in Beckville
Among the 343 employed individuals in Beckville, private company employees (234 | 68.2%), federal government employees (41 | 11.9%), and state government employees (27 | 7.9%) make up the most common classes of employment.
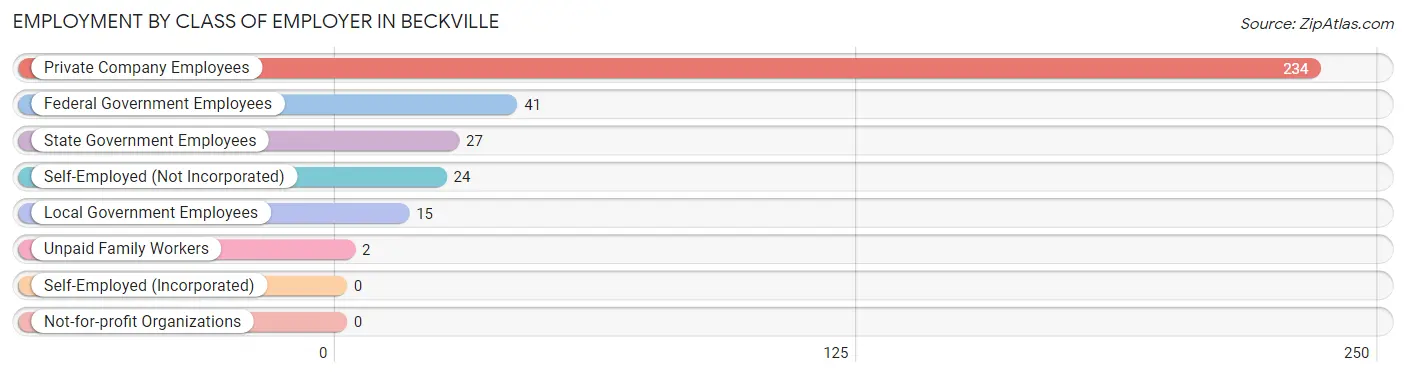
| Employer Class | # Employees | % Employees |
| Private Company Employees | 234 | 68.2% |
| Self-Employed (Incorporated) | 0 | 0.0% |
| Self-Employed (Not Incorporated) | 24 | 7.0% |
| Not-for-profit Organizations | 0 | 0.0% |
| Local Government Employees | 15 | 4.4% |
| State Government Employees | 27 | 7.9% |
| Federal Government Employees | 41 | 11.9% |
| Unpaid Family Workers | 2 | 0.6% |
| Total | 343 | 100.0% |
Employment Status by Age in Beckville
According to the labor force statistics for Beckville, out of the total population over 16 years of age (599), 59.9% or 359 individuals are in the labor force, with 4.5% or 16 of them unemployed. The age group with the highest labor force participation rate is 45 to 54 years, with 93.1% or 81 individuals in the labor force. Within the labor force, the 65 to 74 years age range has the highest percentage of unemployed individuals, with 54.5% or 6 of them being unemployed.
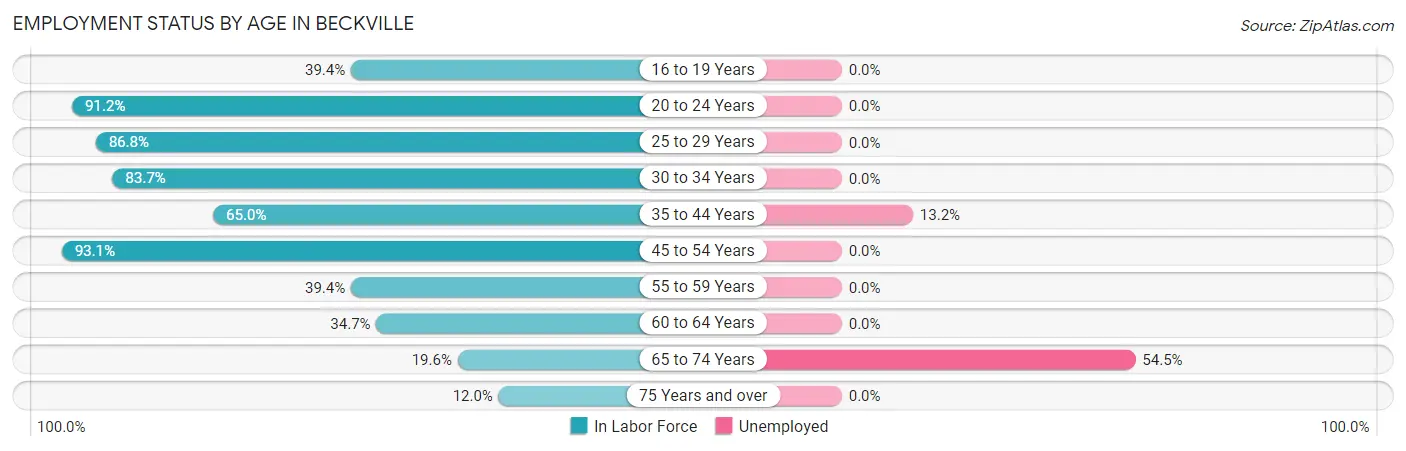
| Age Bracket | In Labor Force | Unemployed |
| 16 to 19 Years | 37 (39.4%) | 0 (0.0%) |
| 20 to 24 Years | 52 (91.2%) | 0 (0.0%) |
| 25 to 29 Years | 33 (86.8%) | 0 (0.0%) |
| 30 to 34 Years | 36 (83.7%) | 0 (0.0%) |
| 35 to 44 Years | 76 (65.0%) | 10 (13.2%) |
| 45 to 54 Years | 81 (93.1%) | 0 (0.0%) |
| 55 to 59 Years | 13 (39.4%) | 0 (0.0%) |
| 60 to 64 Years | 17 (34.7%) | 0 (0.0%) |
| 65 to 74 Years | 11 (19.6%) | 6 (54.5%) |
| 75 Years and over | 3 (12.0%) | 0 (0.0%) |
| Total | 359 (59.9%) | 16 (4.5%) |
Employment Status by Educational Attainment in Beckville
According to labor force statistics for Beckville, 69.8% of individuals (256) out of the total population between 25 and 64 years of age (367) are in the labor force, with 3.9% or 10 of them being unemployed. The group with the highest labor force participation rate are those with the educational attainment of bachelor's degree or higher, with 96.8% or 30 individuals in the labor force. Within the labor force, individuals with bachelor's degree or higher education have the highest percentage of unemployment, with 16.7% or 5 of them being unemployed.
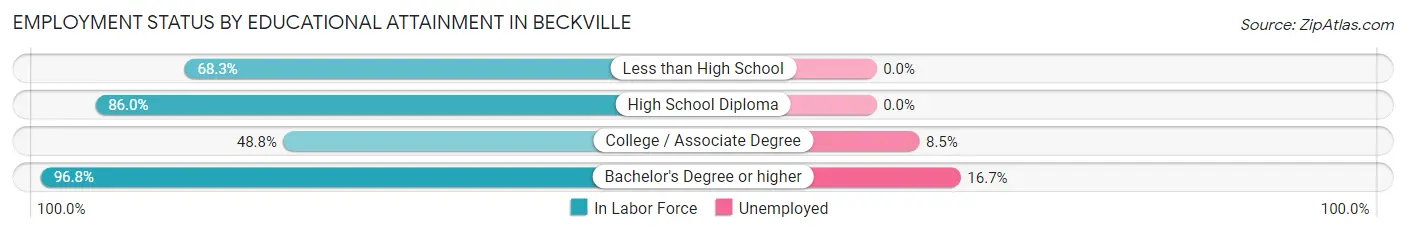
| Educational Attainment | In Labor Force | Unemployed |
| Less than High School | 69 (68.3%) | 0 (0.0%) |
| High School Diploma | 98 (86.0%) | 0 (0.0%) |
| College / Associate Degree | 59 (48.8%) | 10 (8.5%) |
| Bachelor's Degree or higher | 30 (96.8%) | 5 (16.7%) |
| Total | 256 (69.8%) | 14 (3.9%) |
Employment Occupations by Sex in Beckville
Management, Business, Science and Arts Occupations
The most common Management, Business, Science and Arts occupations in Beckville are Community & Social Service (23 | 6.7%), Arts, Media & Entertainment (18 | 5.2%), Management (17 | 5.0%), and Education Instruction & Library (5 | 1.5%).
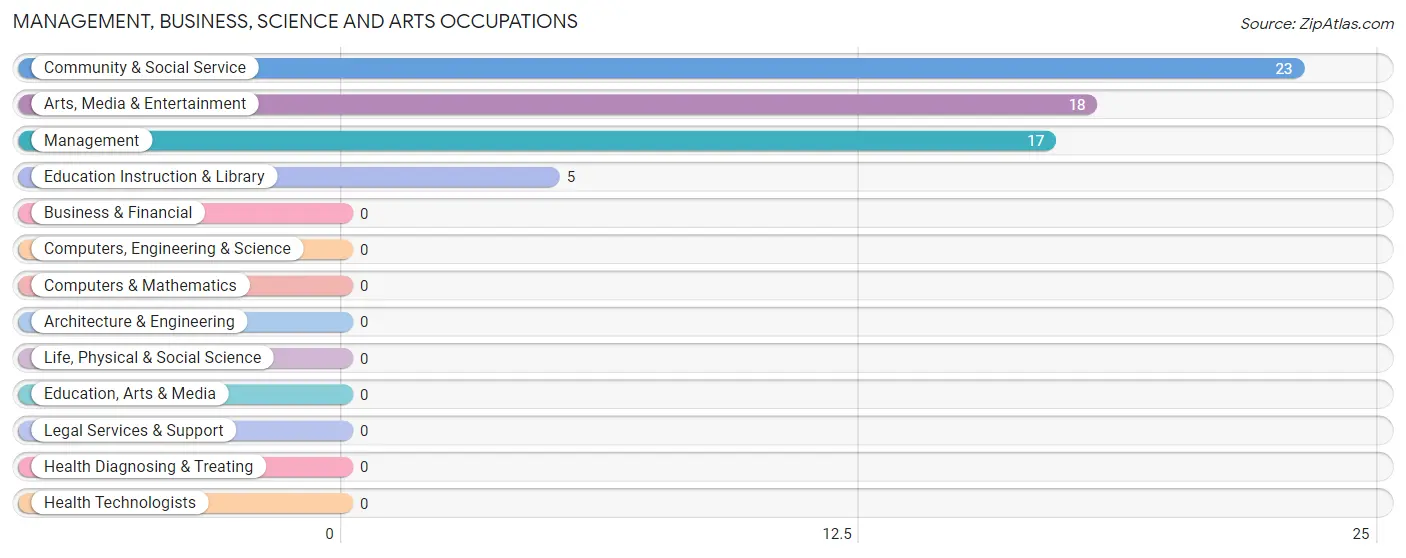
Management, Business, Science and Arts Occupations by Sex
Within the Management, Business, Science and Arts occupations in Beckville, the most male-oriented occupations are Management (64.7%), Education Instruction & Library (60.0%), and Community & Social Service (43.5%), while the most female-oriented occupations are Arts, Media & Entertainment (61.1%), Community & Social Service (56.5%), and Education Instruction & Library (40.0%).
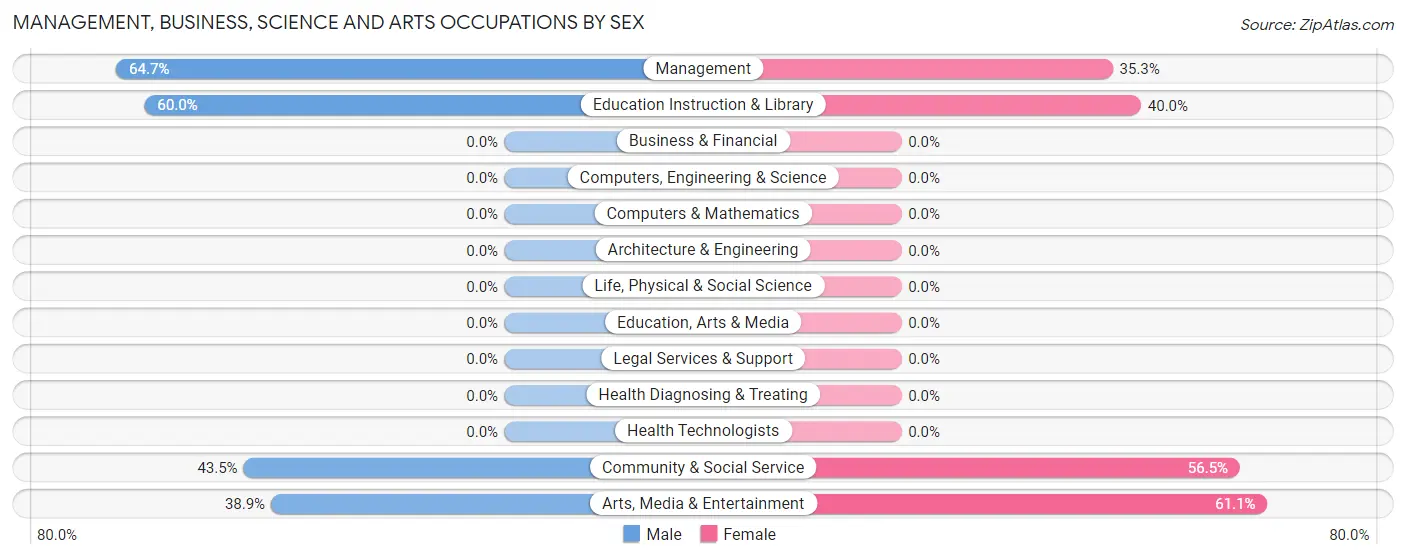
| Occupation | Male | Female |
| Management | 11 (64.7%) | 6 (35.3%) |
| Business & Financial | 0 (0.0%) | 0 (0.0%) |
| Computers, Engineering & Science | 0 (0.0%) | 0 (0.0%) |
| Computers & Mathematics | 0 (0.0%) | 0 (0.0%) |
| Architecture & Engineering | 0 (0.0%) | 0 (0.0%) |
| Life, Physical & Social Science | 0 (0.0%) | 0 (0.0%) |
| Community & Social Service | 10 (43.5%) | 13 (56.5%) |
| Education, Arts & Media | 0 (0.0%) | 0 (0.0%) |
| Legal Services & Support | 0 (0.0%) | 0 (0.0%) |
| Education Instruction & Library | 3 (60.0%) | 2 (40.0%) |
| Arts, Media & Entertainment | 7 (38.9%) | 11 (61.1%) |
| Health Diagnosing & Treating | 0 (0.0%) | 0 (0.0%) |
| Health Technologists | 0 (0.0%) | 0 (0.0%) |
| Total (Category) | 21 (52.5%) | 19 (47.5%) |
| Total (Overall) | 205 (59.8%) | 138 (40.2%) |
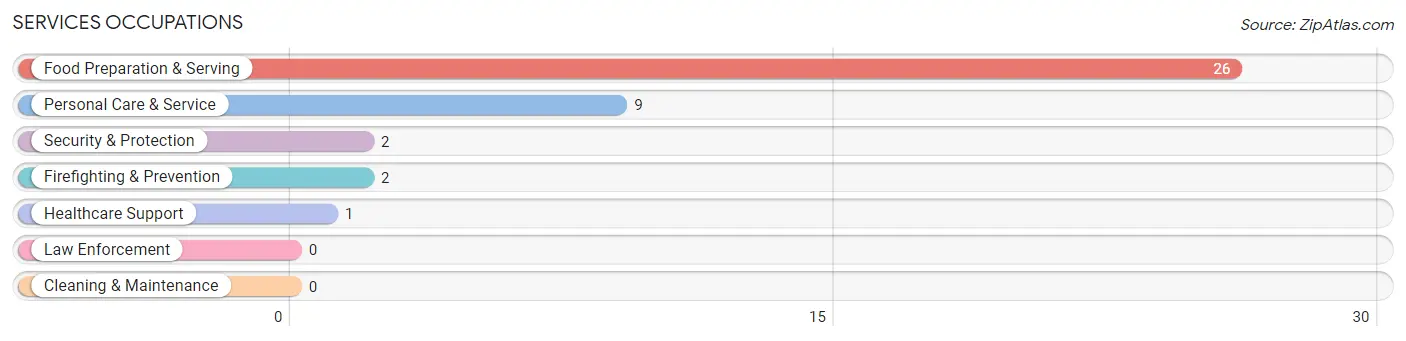
Services Occupations
The most common Services occupations in Beckville are Food Preparation & Serving (26 | 7.6%), Personal Care & Service (9 | 2.6%), Security & Protection (2 | 0.6%), Firefighting & Prevention (2 | 0.6%), and Healthcare Support (1 | 0.3%).
Services Occupations by Sex
Within the Services occupations in Beckville, the most male-oriented occupations are Security & Protection (100.0%), and Firefighting & Prevention (100.0%), while the most female-oriented occupations are Healthcare Support (100.0%), Food Preparation & Serving (100.0%), and Personal Care & Service (100.0%).
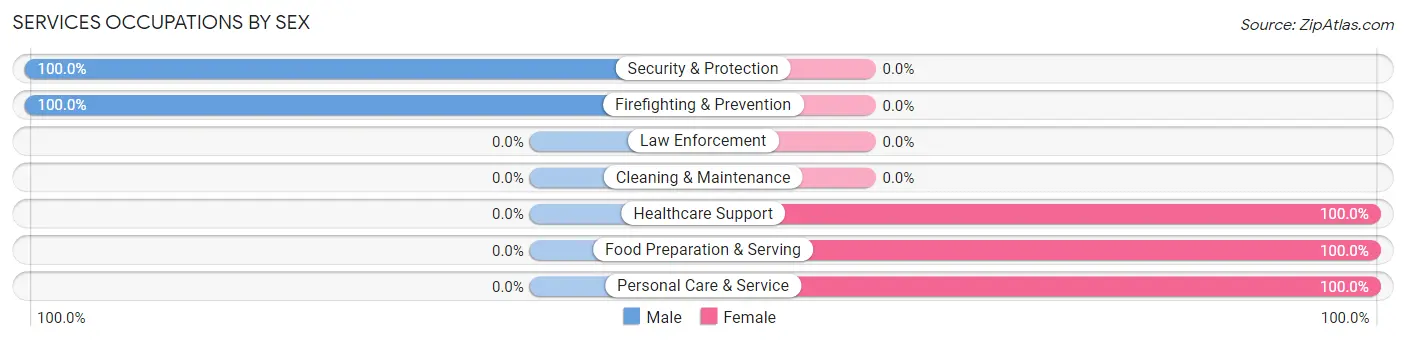
| Occupation | Male | Female |
| Healthcare Support | 0 (0.0%) | 1 (100.0%) |
| Security & Protection | 2 (100.0%) | 0 (0.0%) |
| Firefighting & Prevention | 2 (100.0%) | 0 (0.0%) |
| Law Enforcement | 0 (0.0%) | 0 (0.0%) |
| Food Preparation & Serving | 0 (0.0%) | 26 (100.0%) |
| Cleaning & Maintenance | 0 (0.0%) | 0 (0.0%) |
| Personal Care & Service | 0 (0.0%) | 9 (100.0%) |
| Total (Category) | 2 (5.3%) | 36 (94.7%) |
| Total (Overall) | 205 (59.8%) | 138 (40.2%) |
Sales and Office Occupations
The most common Sales and Office occupations in Beckville are Office & Administration (72 | 21.0%), and Sales & Related (21 | 6.1%).
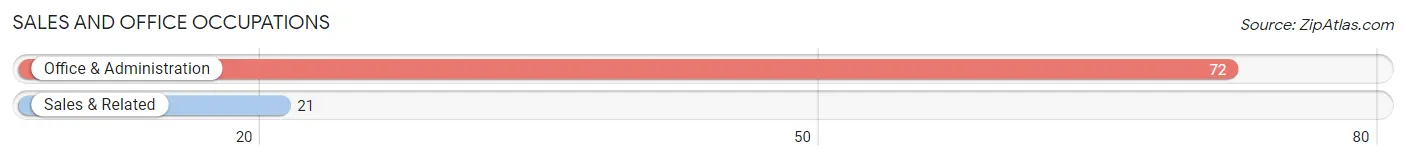
Sales and Office Occupations by Sex
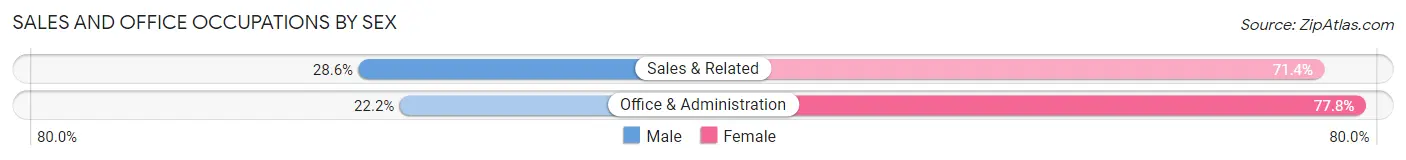
| Occupation | Male | Female |
| Sales & Related | 6 (28.6%) | 15 (71.4%) |
| Office & Administration | 16 (22.2%) | 56 (77.8%) |
| Total (Category) | 22 (23.7%) | 71 (76.3%) |
| Total (Overall) | 205 (59.8%) | 138 (40.2%) |
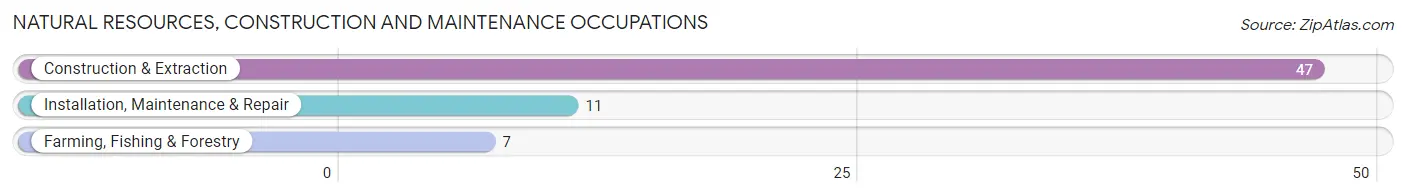
Natural Resources, Construction and Maintenance Occupations
The most common Natural Resources, Construction and Maintenance occupations in Beckville are Construction & Extraction (47 | 13.7%), Installation, Maintenance & Repair (11 | 3.2%), and Farming, Fishing & Forestry (7 | 2.0%).
Natural Resources, Construction and Maintenance Occupations by Sex
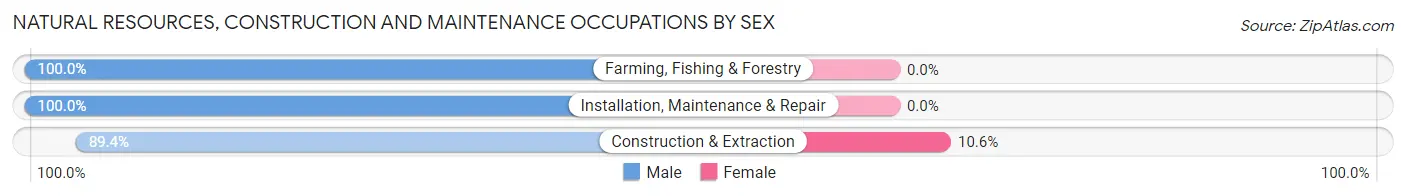
| Occupation | Male | Female |
| Farming, Fishing & Forestry | 7 (100.0%) | 0 (0.0%) |
| Construction & Extraction | 42 (89.4%) | 5 (10.6%) |
| Installation, Maintenance & Repair | 11 (100.0%) | 0 (0.0%) |
| Total (Category) | 60 (92.3%) | 5 (7.7%) |
| Total (Overall) | 205 (59.8%) | 138 (40.2%) |
Production, Transportation and Moving Occupations
The most common Production, Transportation and Moving occupations in Beckville are Material Moving (56 | 16.3%), Transportation (34 | 9.9%), and Production (17 | 5.0%).
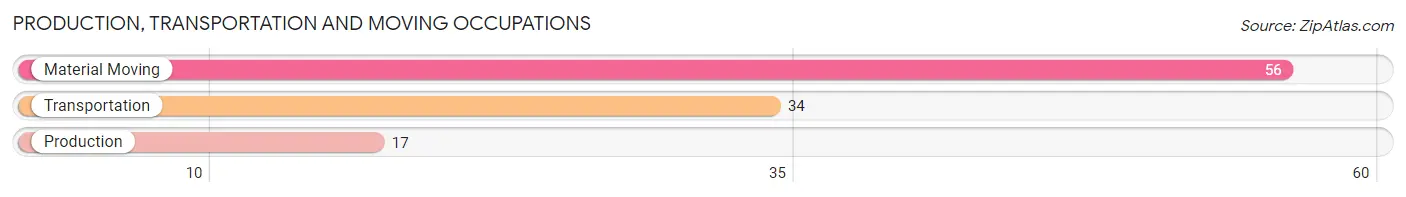
Production, Transportation and Moving Occupations by Sex
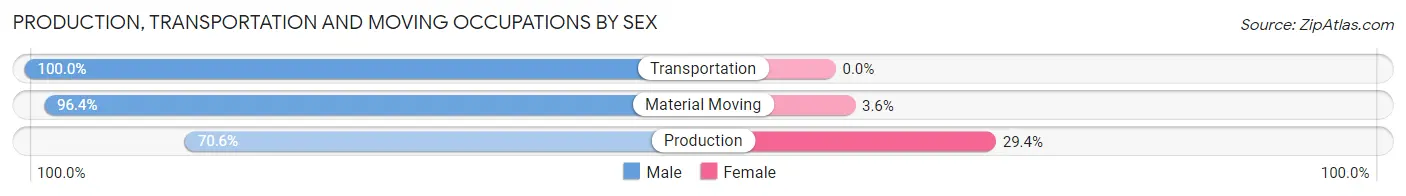
| Occupation | Male | Female |
| Production | 12 (70.6%) | 5 (29.4%) |
| Transportation | 34 (100.0%) | 0 (0.0%) |
| Material Moving | 54 (96.4%) | 2 (3.6%) |
| Total (Category) | 100 (93.5%) | 7 (6.5%) |
| Total (Overall) | 205 (59.8%) | 138 (40.2%) |
Employment Industries by Sex in Beckville
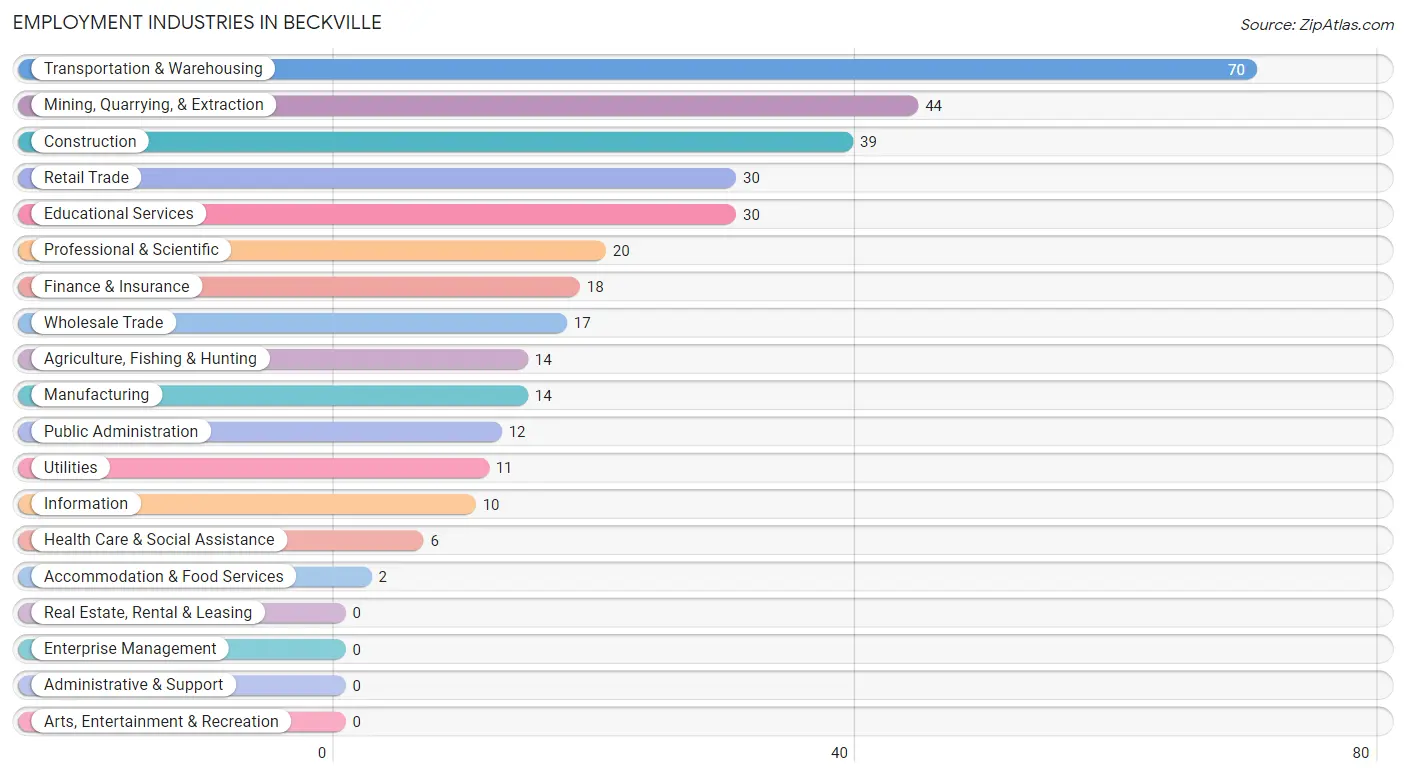
Employment Industries in Beckville
The major employment industries in Beckville include Transportation & Warehousing (70 | 20.4%), Mining, Quarrying, & Extraction (44 | 12.8%), Construction (39 | 11.4%), Retail Trade (30 | 8.7%), and Educational Services (30 | 8.7%).
Employment Industries by Sex in Beckville
The Beckville industries that see more men than women are Agriculture, Fishing & Hunting (100.0%), Utilities (100.0%), and Transportation & Warehousing (98.6%), whereas the industries that tend to have a higher number of women are Information (100.0%), Finance & Insurance (100.0%), and Professional & Scientific (100.0%).
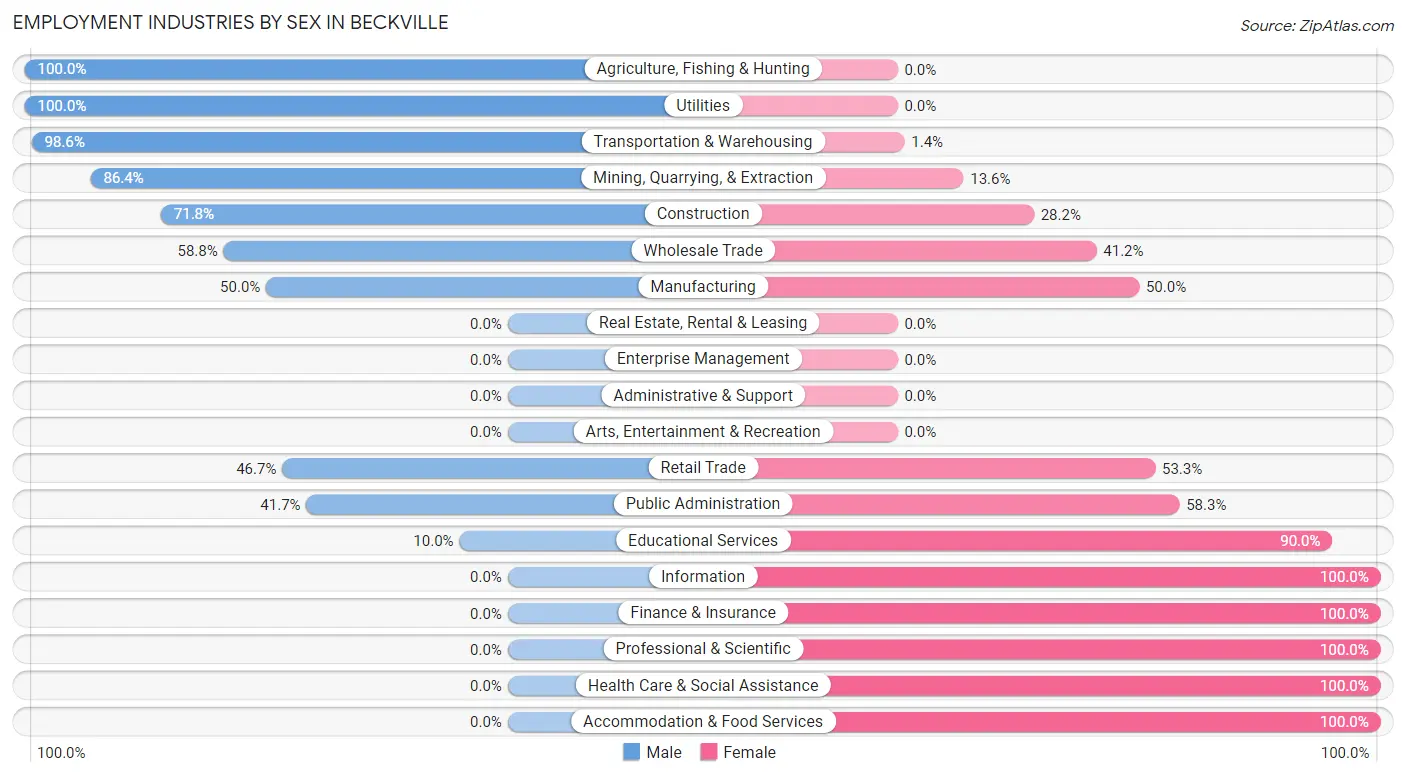
| Industry | Male | Female |
| Agriculture, Fishing & Hunting | 14 (100.0%) | 0 (0.0%) |
| Mining, Quarrying, & Extraction | 38 (86.4%) | 6 (13.6%) |
| Construction | 28 (71.8%) | 11 (28.2%) |
| Manufacturing | 7 (50.0%) | 7 (50.0%) |
| Wholesale Trade | 10 (58.8%) | 7 (41.2%) |
| Retail Trade | 14 (46.7%) | 16 (53.3%) |
| Transportation & Warehousing | 69 (98.6%) | 1 (1.4%) |
| Utilities | 11 (100.0%) | 0 (0.0%) |
| Information | 0 (0.0%) | 10 (100.0%) |
| Finance & Insurance | 0 (0.0%) | 18 (100.0%) |
| Real Estate, Rental & Leasing | 0 (0.0%) | 0 (0.0%) |
| Professional & Scientific | 0 (0.0%) | 20 (100.0%) |
| Enterprise Management | 0 (0.0%) | 0 (0.0%) |
| Administrative & Support | 0 (0.0%) | 0 (0.0%) |
| Educational Services | 3 (10.0%) | 27 (90.0%) |
| Health Care & Social Assistance | 0 (0.0%) | 6 (100.0%) |
| Arts, Entertainment & Recreation | 0 (0.0%) | 0 (0.0%) |
| Accommodation & Food Services | 0 (0.0%) | 2 (100.0%) |
| Public Administration | 5 (41.7%) | 7 (58.3%) |
| Total | 205 (59.8%) | 138 (40.2%) |
Education in Beckville
School Enrollment in Beckville
The most common levels of schooling among the 264 students in Beckville are high school (109 | 41.3%), middle school (74 | 28.0%), and elementary school (53 | 20.1%).
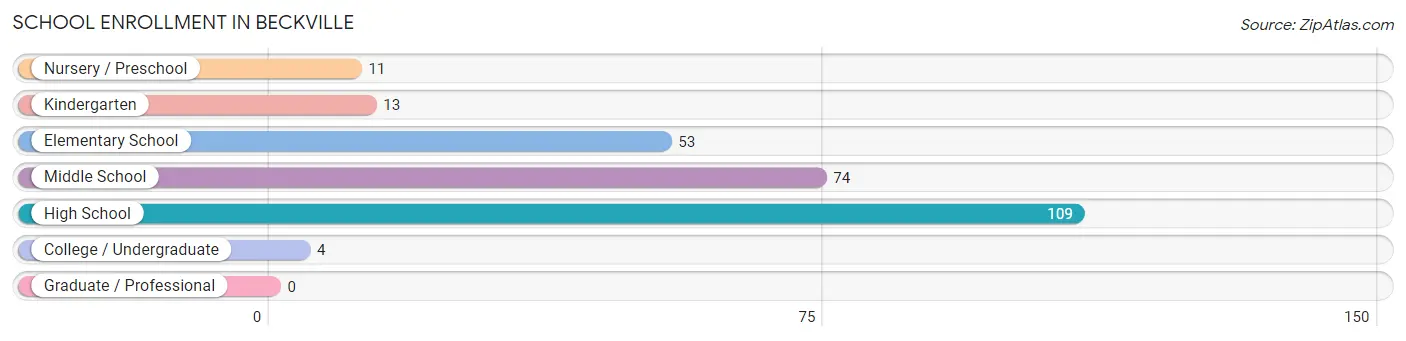
| School Level | # Students | % Students |
| Nursery / Preschool | 11 | 4.2% |
| Kindergarten | 13 | 4.9% |
| Elementary School | 53 | 20.1% |
| Middle School | 74 | 28.0% |
| High School | 109 | 41.3% |
| College / Undergraduate | 4 | 1.5% |
| Graduate / Professional | 0 | 0.0% |
| Total | 264 | 100.0% |
School Enrollment by Age by Funding Source in Beckville
Out of a total of 264 students who are enrolled in schools in Beckville, 1 (0.4%) attend a private institution, while the remaining 263 (99.6%) are enrolled in public schools. The age group of 15 to 17 year olds has the highest likelihood of being enrolled in private schools, with 1 (1.3% in the age bracket) enrolled. Conversely, the age group of 3 to 4 year olds has the lowest likelihood of being enrolled in a private school, with 4 (100.0% in the age bracket) attending a public institution.
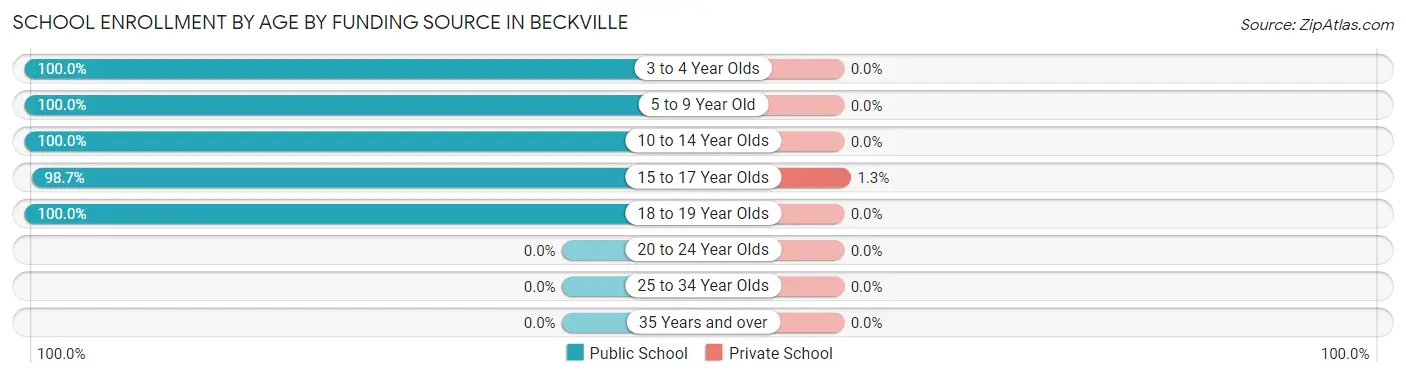
| Age Bracket | Public School | Private School |
| 3 to 4 Year Olds | 4 (100.0%) | 0 (0.0%) |
| 5 to 9 Year Old | 70 (100.0%) | 0 (0.0%) |
| 10 to 14 Year Olds | 77 (100.0%) | 0 (0.0%) |
| 15 to 17 Year Olds | 77 (98.7%) | 1 (1.3%) |
| 18 to 19 Year Olds | 35 (100.0%) | 0 (0.0%) |
| 20 to 24 Year Olds | 0 (0.0%) | 0 (0.0%) |
| 25 to 34 Year Olds | 0 (0.0%) | 0 (0.0%) |
| 35 Years and over | 0 (0.0%) | 0 (0.0%) |
| Total | 263 (99.6%) | 1 (0.4%) |
Educational Attainment by Field of Study in Beckville
Business (12 | 31.6%), arts & humanities (12 | 31.6%), education (7 | 18.4%), visual & performing arts (6 | 15.8%), and science & technology (1 | 2.6%) are the most common fields of study among 38 individuals in Beckville who have obtained a bachelor's degree or higher.
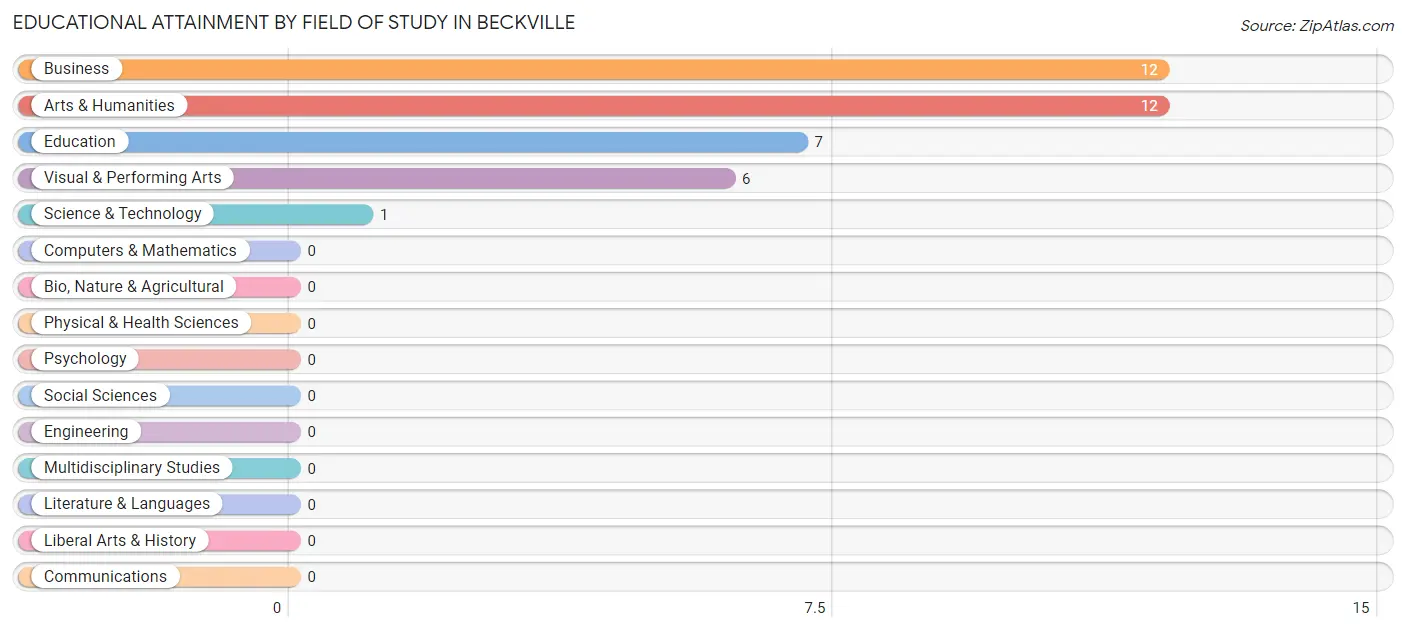
| Field of Study | # Graduates | % Graduates |
| Computers & Mathematics | 0 | 0.0% |
| Bio, Nature & Agricultural | 0 | 0.0% |
| Physical & Health Sciences | 0 | 0.0% |
| Psychology | 0 | 0.0% |
| Social Sciences | 0 | 0.0% |
| Engineering | 0 | 0.0% |
| Multidisciplinary Studies | 0 | 0.0% |
| Science & Technology | 1 | 2.6% |
| Business | 12 | 31.6% |
| Education | 7 | 18.4% |
| Literature & Languages | 0 | 0.0% |
| Liberal Arts & History | 0 | 0.0% |
| Visual & Performing Arts | 6 | 15.8% |
| Communications | 0 | 0.0% |
| Arts & Humanities | 12 | 31.6% |
| Total | 38 | 100.0% |
Transportation & Commute in Beckville
Vehicle Availability by Sex in Beckville
The most prevalent vehicle ownership categories in Beckville are males with 2 vehicles (90, accounting for 43.9%) and females with 2 vehicles (75, making up 65.2%).
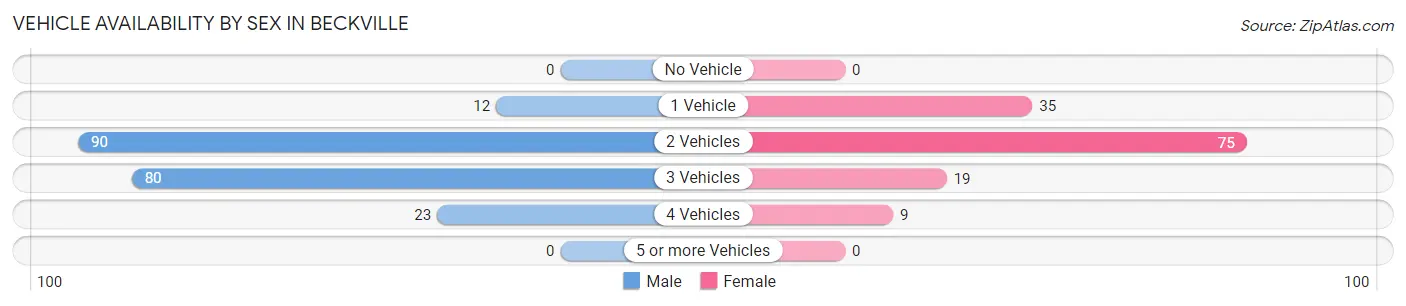
| Vehicles Available | Male | Female |
| No Vehicle | 0 (0.0%) | 0 (0.0%) |
| 1 Vehicle | 12 (5.9%) | 35 (25.4%) |
| 2 Vehicles | 90 (43.9%) | 75 (54.3%) |
| 3 Vehicles | 80 (39.0%) | 19 (13.8%) |
| 4 Vehicles | 23 (11.2%) | 9 (6.5%) |
| 5 or more Vehicles | 0 (0.0%) | 0 (0.0%) |
| Total | 205 (100.0%) | 138 (100.0%) |
Commute Time in Beckville
The most frequently occuring commute durations in Beckville are 20 to 24 minutes (81 commuters, 25.3%), 15 to 19 minutes (72 commuters, 22.5%), and 45 to 59 minutes (37 commuters, 11.6%).
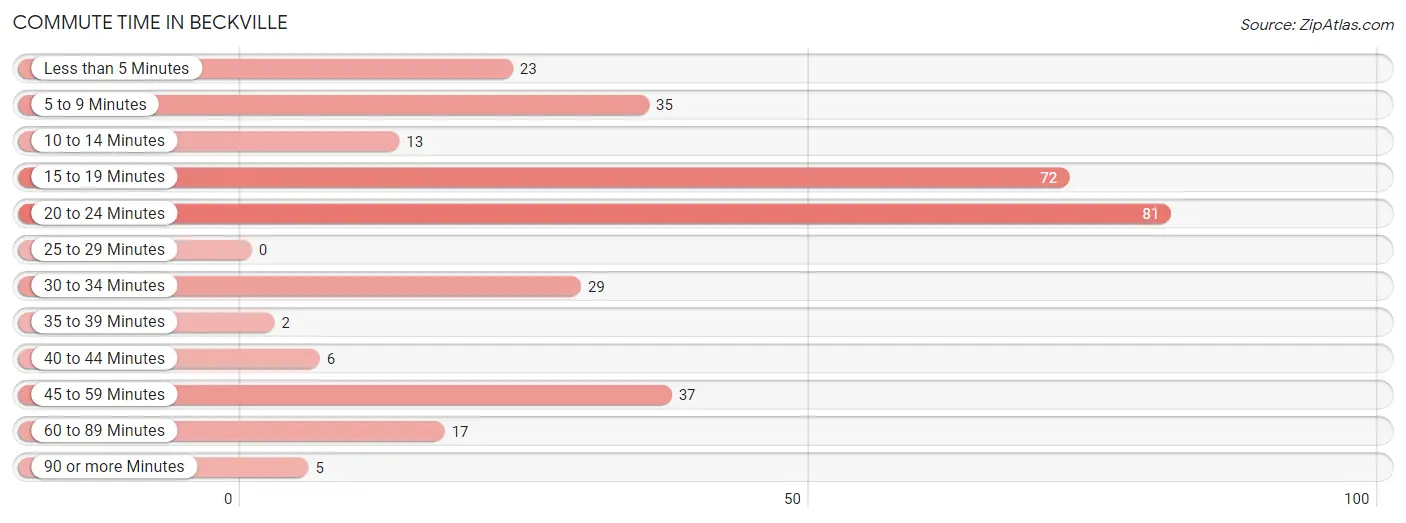
| Commute Time | # Commuters | % Commuters |
| Less than 5 Minutes | 23 | 7.2% |
| 5 to 9 Minutes | 35 | 10.9% |
| 10 to 14 Minutes | 13 | 4.1% |
| 15 to 19 Minutes | 72 | 22.5% |
| 20 to 24 Minutes | 81 | 25.3% |
| 25 to 29 Minutes | 0 | 0.0% |
| 30 to 34 Minutes | 29 | 9.1% |
| 35 to 39 Minutes | 2 | 0.6% |
| 40 to 44 Minutes | 6 | 1.9% |
| 45 to 59 Minutes | 37 | 11.6% |
| 60 to 89 Minutes | 17 | 5.3% |
| 90 or more Minutes | 5 | 1.6% |
Commute Time by Sex in Beckville
The most common commute times in Beckville are 20 to 24 minutes (81 commuters, 39.5%) for males and 15 to 19 minutes (25 commuters, 21.7%) for females.
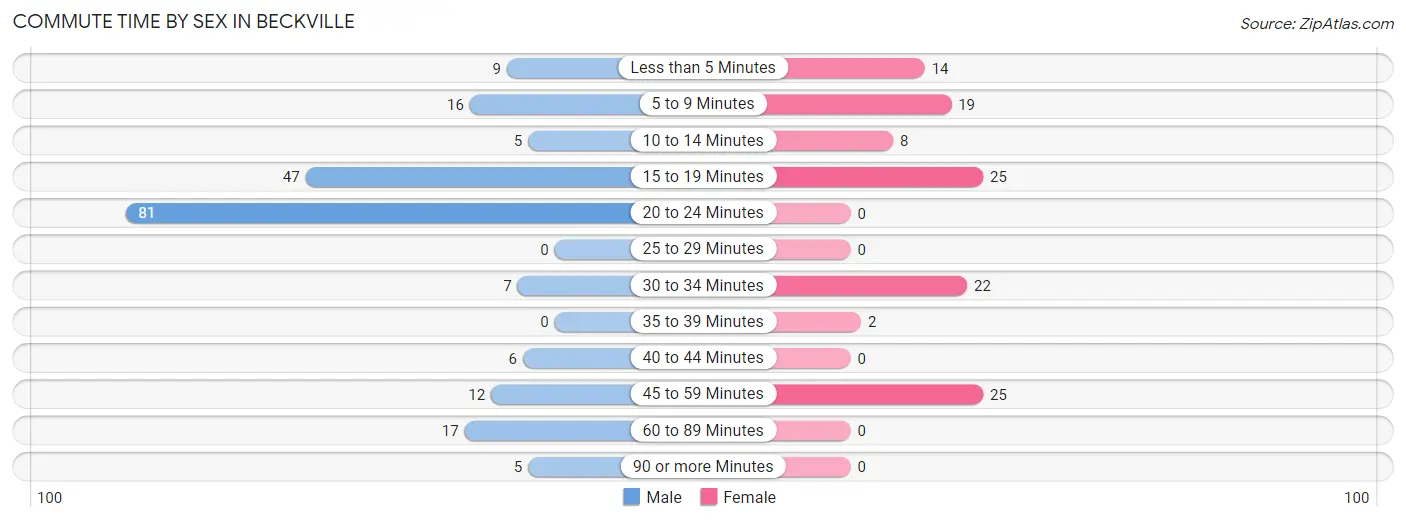
| Commute Time | Male | Female |
| Less than 5 Minutes | 9 (4.4%) | 14 (12.2%) |
| 5 to 9 Minutes | 16 (7.8%) | 19 (16.5%) |
| 10 to 14 Minutes | 5 (2.4%) | 8 (7.0%) |
| 15 to 19 Minutes | 47 (22.9%) | 25 (21.7%) |
| 20 to 24 Minutes | 81 (39.5%) | 0 (0.0%) |
| 25 to 29 Minutes | 0 (0.0%) | 0 (0.0%) |
| 30 to 34 Minutes | 7 (3.4%) | 22 (19.1%) |
| 35 to 39 Minutes | 0 (0.0%) | 2 (1.7%) |
| 40 to 44 Minutes | 6 (2.9%) | 0 (0.0%) |
| 45 to 59 Minutes | 12 (5.9%) | 25 (21.7%) |
| 60 to 89 Minutes | 17 (8.3%) | 0 (0.0%) |
| 90 or more Minutes | 5 (2.4%) | 0 (0.0%) |
Time of Departure to Work by Sex in Beckville
The most frequent times of departure to work in Beckville are 5:00 AM to 5:29 AM (59, 28.8%) for males and 7:30 AM to 7:59 AM (24, 20.9%) for females.
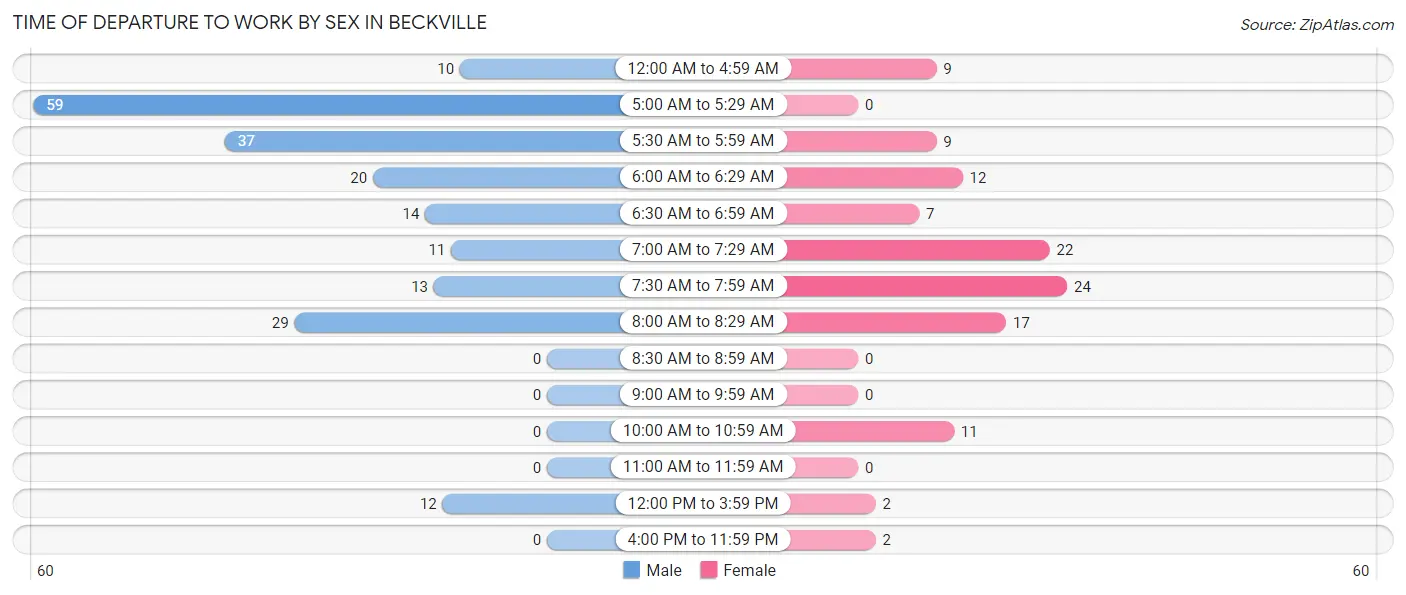
| Time of Departure | Male | Female |
| 12:00 AM to 4:59 AM | 10 (4.9%) | 9 (7.8%) |
| 5:00 AM to 5:29 AM | 59 (28.8%) | 0 (0.0%) |
| 5:30 AM to 5:59 AM | 37 (18.0%) | 9 (7.8%) |
| 6:00 AM to 6:29 AM | 20 (9.8%) | 12 (10.4%) |
| 6:30 AM to 6:59 AM | 14 (6.8%) | 7 (6.1%) |
| 7:00 AM to 7:29 AM | 11 (5.4%) | 22 (19.1%) |
| 7:30 AM to 7:59 AM | 13 (6.3%) | 24 (20.9%) |
| 8:00 AM to 8:29 AM | 29 (14.1%) | 17 (14.8%) |
| 8:30 AM to 8:59 AM | 0 (0.0%) | 0 (0.0%) |
| 9:00 AM to 9:59 AM | 0 (0.0%) | 0 (0.0%) |
| 10:00 AM to 10:59 AM | 0 (0.0%) | 11 (9.6%) |
| 11:00 AM to 11:59 AM | 0 (0.0%) | 0 (0.0%) |
| 12:00 PM to 3:59 PM | 12 (5.9%) | 2 (1.7%) |
| 4:00 PM to 11:59 PM | 0 (0.0%) | 2 (1.7%) |
| Total | 205 (100.0%) | 115 (100.0%) |
Housing Occupancy in Beckville
Occupancy by Ownership in Beckville
Of the total 264 dwellings in Beckville, owner-occupied units account for 164 (62.1%), while renter-occupied units make up 100 (37.9%).
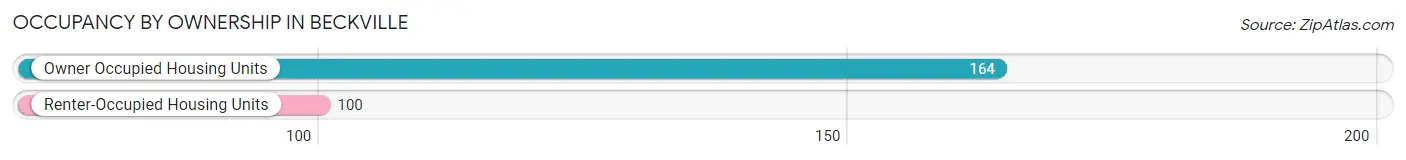
| Occupancy | # Housing Units | % Housing Units |
| Owner Occupied Housing Units | 164 | 62.1% |
| Renter-Occupied Housing Units | 100 | 37.9% |
| Total Occupied Housing Units | 264 | 100.0% |
Occupancy by Household Size in Beckville
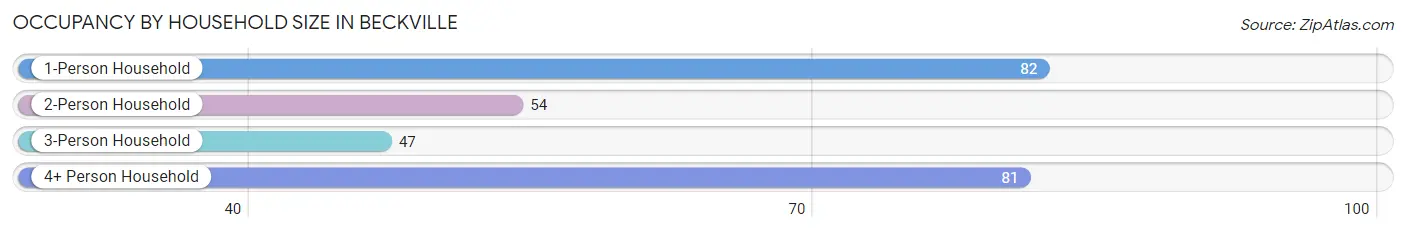
| Household Size | # Housing Units | % Housing Units |
| 1-Person Household | 82 | 31.1% |
| 2-Person Household | 54 | 20.4% |
| 3-Person Household | 47 | 17.8% |
| 4+ Person Household | 81 | 30.7% |
| Total Housing Units | 264 | 100.0% |
Occupancy by Ownership by Household Size in Beckville
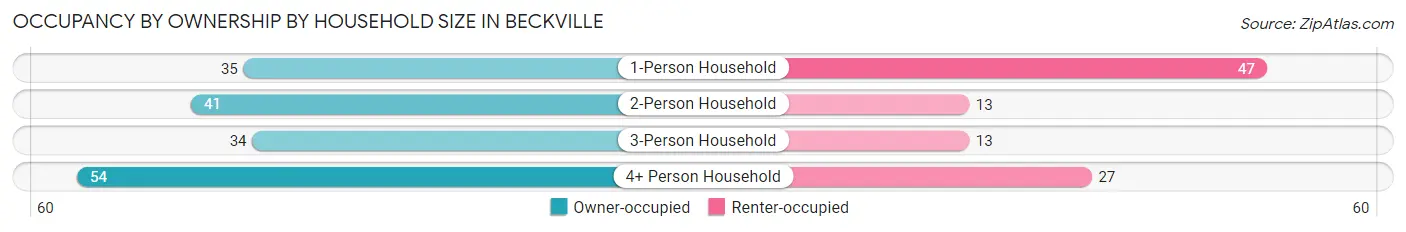
| Household Size | Owner-occupied | Renter-occupied |
| 1-Person Household | 35 (42.7%) | 47 (57.3%) |
| 2-Person Household | 41 (75.9%) | 13 (24.1%) |
| 3-Person Household | 34 (72.3%) | 13 (27.7%) |
| 4+ Person Household | 54 (66.7%) | 27 (33.3%) |
| Total Housing Units | 164 (62.1%) | 100 (37.9%) |
Occupancy by Educational Attainment in Beckville
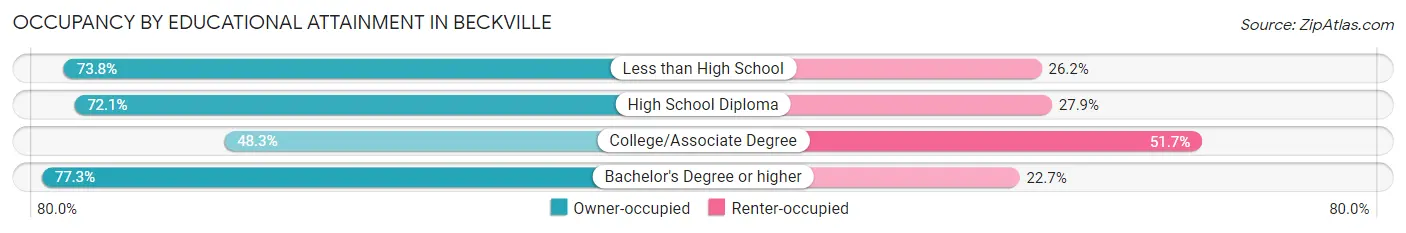
| Household Size | Owner-occupied | Renter-occupied |
| Less than High School | 45 (73.8%) | 16 (26.2%) |
| High School Diploma | 44 (72.1%) | 17 (27.9%) |
| College/Associate Degree | 58 (48.3%) | 62 (51.7%) |
| Bachelor's Degree or higher | 17 (77.3%) | 5 (22.7%) |
Occupancy by Age of Householder in Beckville
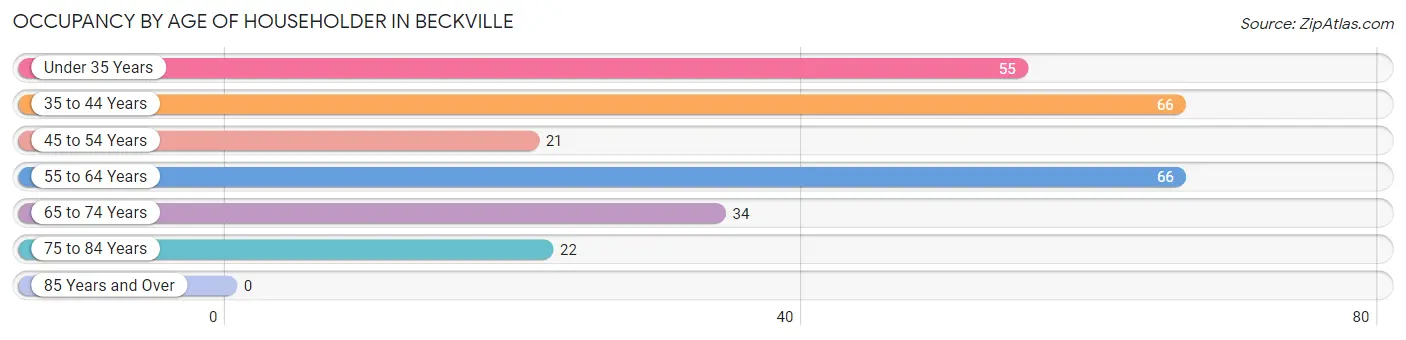
| Age Bracket | # Households | % Households |
| Under 35 Years | 55 | 20.8% |
| 35 to 44 Years | 66 | 25.0% |
| 45 to 54 Years | 21 | 8.0% |
| 55 to 64 Years | 66 | 25.0% |
| 65 to 74 Years | 34 | 12.9% |
| 75 to 84 Years | 22 | 8.3% |
| 85 Years and Over | 0 | 0.0% |
| Total | 264 | 100.0% |
Housing Finances in Beckville
Median Income by Occupancy in Beckville
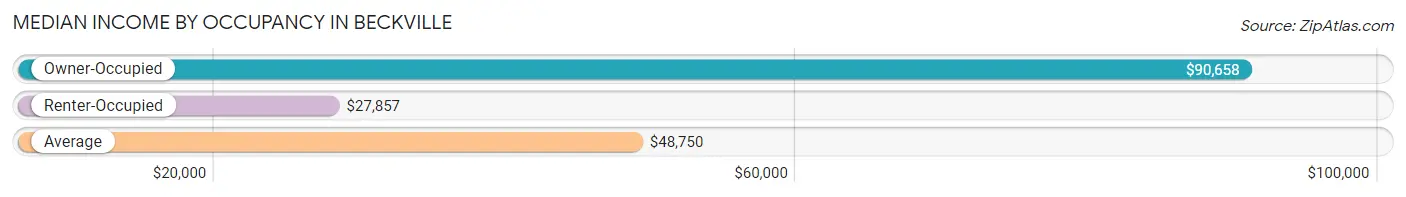
| Occupancy Type | # Households | Median Income |
| Owner-Occupied | 164 (62.1%) | $90,658 |
| Renter-Occupied | 100 (37.9%) | $27,857 |
| Average | 264 (100.0%) | $48,750 |
Occupancy by Householder Income Bracket in Beckville
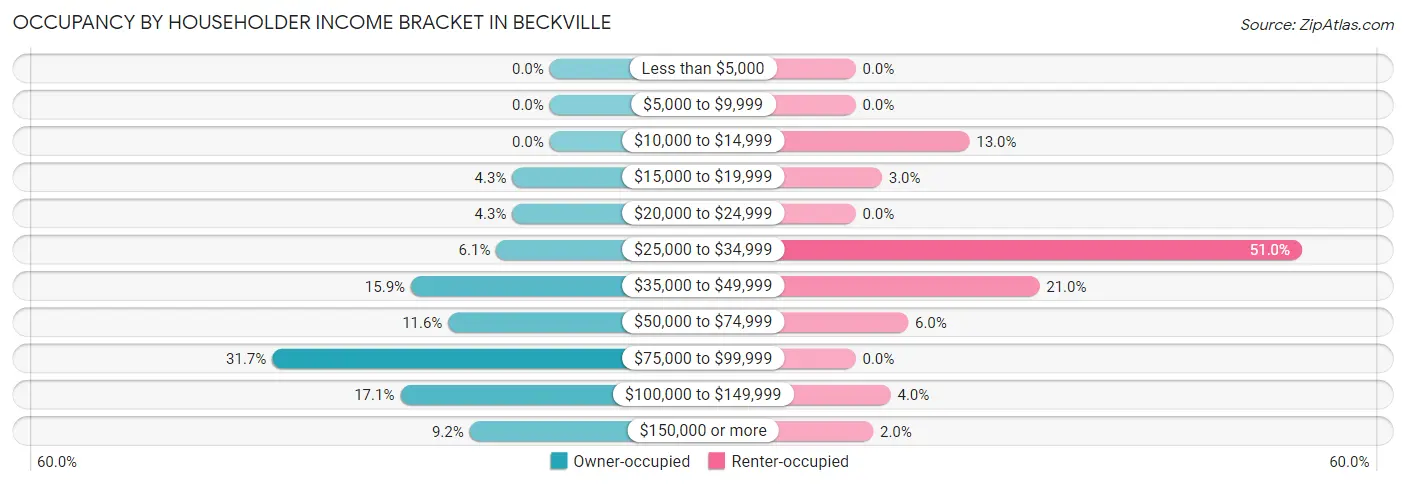
| Income Bracket | Owner-occupied | Renter-occupied |
| Less than $5,000 | 0 (0.0%) | 0 (0.0%) |
| $5,000 to $9,999 | 0 (0.0%) | 0 (0.0%) |
| $10,000 to $14,999 | 0 (0.0%) | 13 (13.0%) |
| $15,000 to $19,999 | 7 (4.3%) | 3 (3.0%) |
| $20,000 to $24,999 | 7 (4.3%) | 0 (0.0%) |
| $25,000 to $34,999 | 10 (6.1%) | 51 (51.0%) |
| $35,000 to $49,999 | 26 (15.9%) | 21 (21.0%) |
| $50,000 to $74,999 | 19 (11.6%) | 6 (6.0%) |
| $75,000 to $99,999 | 52 (31.7%) | 0 (0.0%) |
| $100,000 to $149,999 | 28 (17.1%) | 4 (4.0%) |
| $150,000 or more | 15 (9.1%) | 2 (2.0%) |
| Total | 164 (100.0%) | 100 (100.0%) |
Monthly Housing Cost Tiers in Beckville
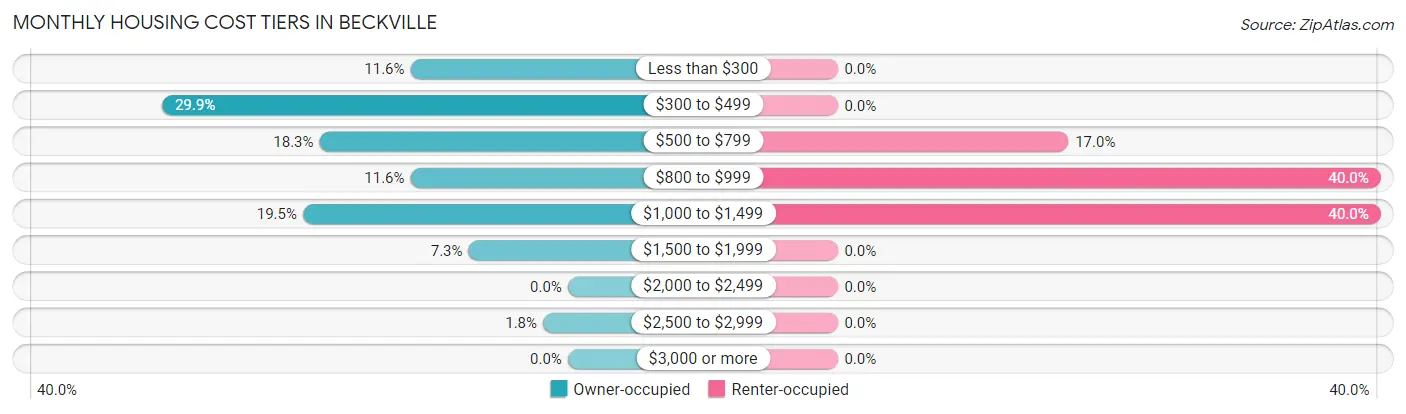
| Monthly Cost | Owner-occupied | Renter-occupied |
| Less than $300 | 19 (11.6%) | 0 (0.0%) |
| $300 to $499 | 49 (29.9%) | 0 (0.0%) |
| $500 to $799 | 30 (18.3%) | 17 (17.0%) |
| $800 to $999 | 19 (11.6%) | 40 (40.0%) |
| $1,000 to $1,499 | 32 (19.5%) | 40 (40.0%) |
| $1,500 to $1,999 | 12 (7.3%) | 0 (0.0%) |
| $2,000 to $2,499 | 0 (0.0%) | 0 (0.0%) |
| $2,500 to $2,999 | 3 (1.8%) | 0 (0.0%) |
| $3,000 or more | 0 (0.0%) | 0 (0.0%) |
| Total | 164 (100.0%) | 100 (100.0%) |
Physical Housing Characteristics in Beckville
Housing Structures in Beckville
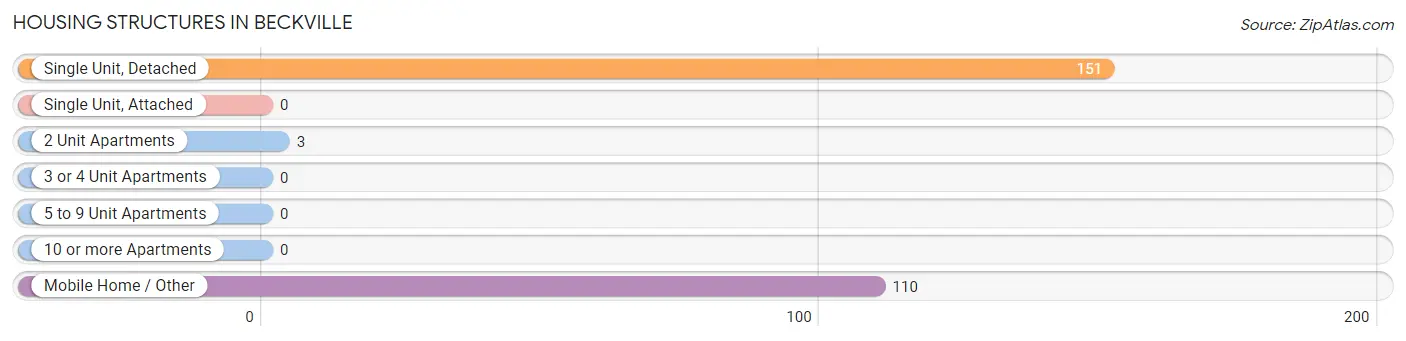
| Structure Type | # Housing Units | % Housing Units |
| Single Unit, Detached | 151 | 57.2% |
| Single Unit, Attached | 0 | 0.0% |
| 2 Unit Apartments | 3 | 1.1% |
| 3 or 4 Unit Apartments | 0 | 0.0% |
| 5 to 9 Unit Apartments | 0 | 0.0% |
| 10 or more Apartments | 0 | 0.0% |
| Mobile Home / Other | 110 | 41.7% |
| Total | 264 | 100.0% |
Housing Structures by Occupancy in Beckville
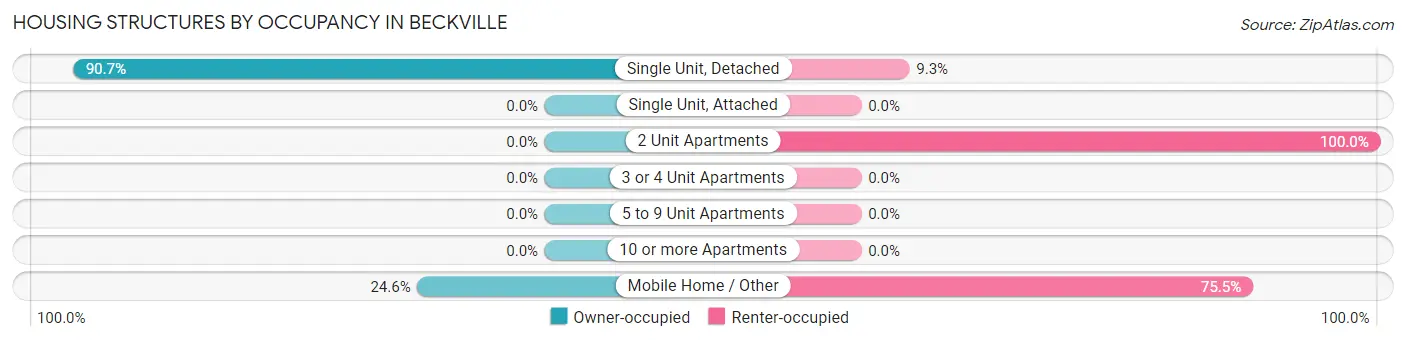
| Structure Type | Owner-occupied | Renter-occupied |
| Single Unit, Detached | 137 (90.7%) | 14 (9.3%) |
| Single Unit, Attached | 0 (0.0%) | 0 (0.0%) |
| 2 Unit Apartments | 0 (0.0%) | 3 (100.0%) |
| 3 or 4 Unit Apartments | 0 (0.0%) | 0 (0.0%) |
| 5 to 9 Unit Apartments | 0 (0.0%) | 0 (0.0%) |
| 10 or more Apartments | 0 (0.0%) | 0 (0.0%) |
| Mobile Home / Other | 27 (24.5%) | 83 (75.4%) |
| Total | 164 (62.1%) | 100 (37.9%) |
Housing Structures by Number of Rooms in Beckville
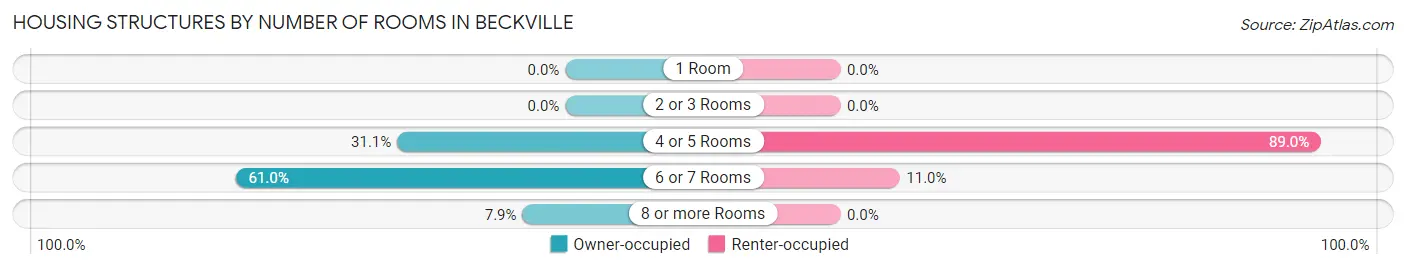
| Number of Rooms | Owner-occupied | Renter-occupied |
| 1 Room | 0 (0.0%) | 0 (0.0%) |
| 2 or 3 Rooms | 0 (0.0%) | 0 (0.0%) |
| 4 or 5 Rooms | 51 (31.1%) | 89 (89.0%) |
| 6 or 7 Rooms | 100 (61.0%) | 11 (11.0%) |
| 8 or more Rooms | 13 (7.9%) | 0 (0.0%) |
| Total | 164 (100.0%) | 100 (100.0%) |
Housing Structure by Heating Type in Beckville
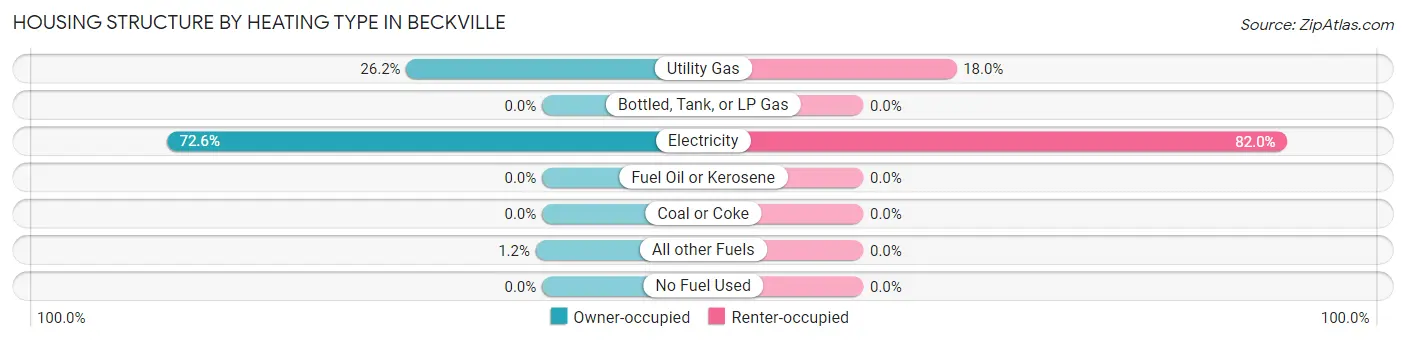
| Heating Type | Owner-occupied | Renter-occupied |
| Utility Gas | 43 (26.2%) | 18 (18.0%) |
| Bottled, Tank, or LP Gas | 0 (0.0%) | 0 (0.0%) |
| Electricity | 119 (72.6%) | 82 (82.0%) |
| Fuel Oil or Kerosene | 0 (0.0%) | 0 (0.0%) |
| Coal or Coke | 0 (0.0%) | 0 (0.0%) |
| All other Fuels | 2 (1.2%) | 0 (0.0%) |
| No Fuel Used | 0 (0.0%) | 0 (0.0%) |
| Total | 164 (100.0%) | 100 (100.0%) |
Household Vehicle Usage in Beckville
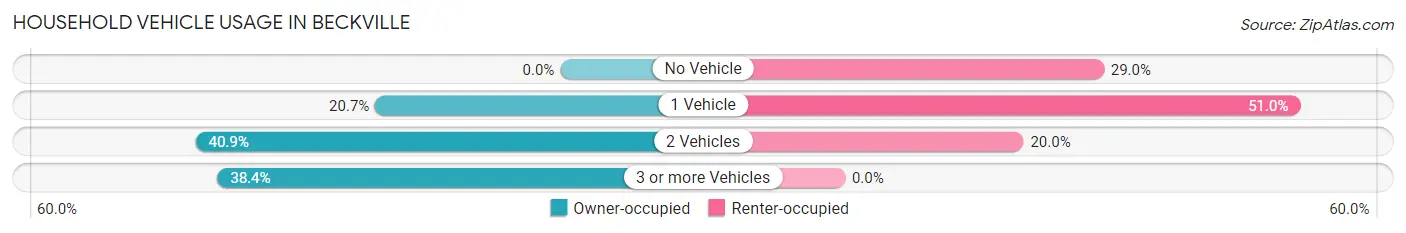
| Vehicles per Household | Owner-occupied | Renter-occupied |
| No Vehicle | 0 (0.0%) | 29 (29.0%) |
| 1 Vehicle | 34 (20.7%) | 51 (51.0%) |
| 2 Vehicles | 67 (40.8%) | 20 (20.0%) |
| 3 or more Vehicles | 63 (38.4%) | 0 (0.0%) |
| Total | 164 (100.0%) | 100 (100.0%) |
Real Estate & Mortgages in Beckville
Real Estate and Mortgage Overview in Beckville
| Characteristic | Without Mortgage | With Mortgage |
| Housing Units | 98 | 66 |
| Median Property Value | $93,000 | $115,000 |
| Median Household Income | $51,667 | $12 |
| Monthly Housing Costs | $417 | $0 |
| Real Estate Taxes | $1,150 | $3 |
Property Value by Mortgage Status in Beckville
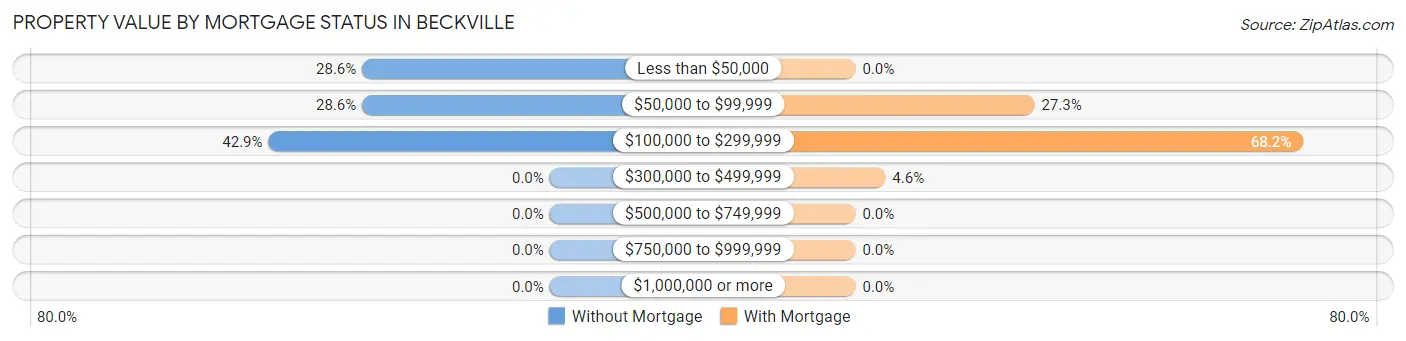
| Property Value | Without Mortgage | With Mortgage |
| Less than $50,000 | 28 (28.6%) | 0 (0.0%) |
| $50,000 to $99,999 | 28 (28.6%) | 18 (27.3%) |
| $100,000 to $299,999 | 42 (42.9%) | 45 (68.2%) |
| $300,000 to $499,999 | 0 (0.0%) | 3 (4.5%) |
| $500,000 to $749,999 | 0 (0.0%) | 0 (0.0%) |
| $750,000 to $999,999 | 0 (0.0%) | 0 (0.0%) |
| $1,000,000 or more | 0 (0.0%) | 0 (0.0%) |
| Total | 98 (100.0%) | 66 (100.0%) |
Household Income by Mortgage Status in Beckville
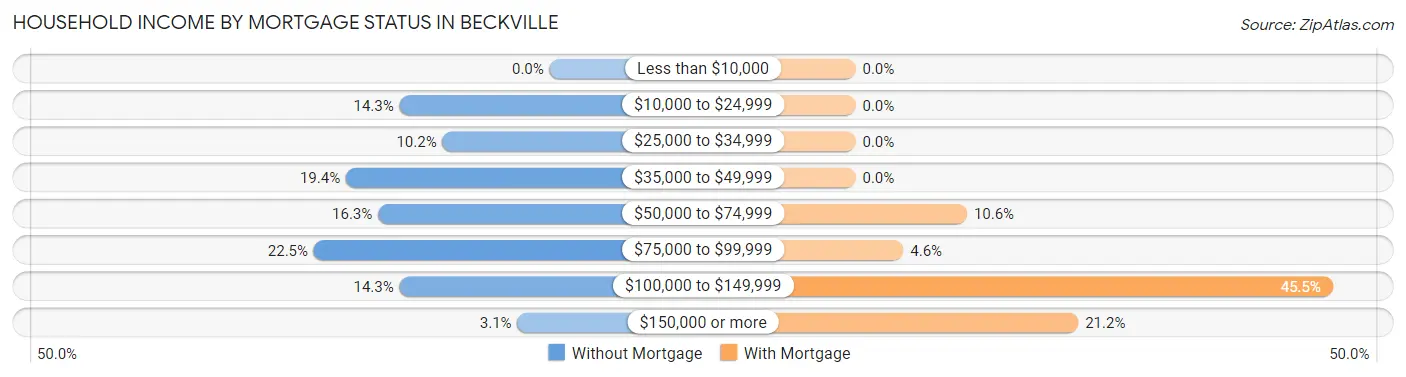
| Household Income | Without Mortgage | With Mortgage |
| Less than $10,000 | 0 (0.0%) | 0 (0.0%) |
| $10,000 to $24,999 | 14 (14.3%) | 0 (0.0%) |
| $25,000 to $34,999 | 10 (10.2%) | 0 (0.0%) |
| $35,000 to $49,999 | 19 (19.4%) | 0 (0.0%) |
| $50,000 to $74,999 | 16 (16.3%) | 7 (10.6%) |
| $75,000 to $99,999 | 22 (22.5%) | 3 (4.5%) |
| $100,000 to $149,999 | 14 (14.3%) | 30 (45.5%) |
| $150,000 or more | 3 (3.1%) | 14 (21.2%) |
| Total | 98 (100.0%) | 66 (100.0%) |
Property Value to Household Income Ratio in Beckville
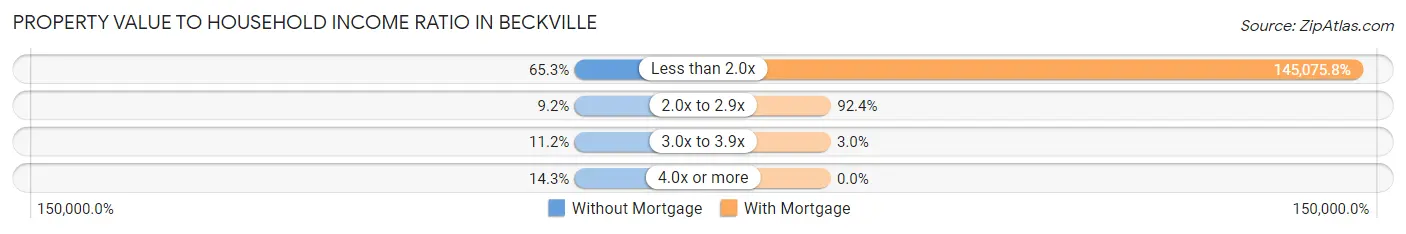
| Value-to-Income Ratio | Without Mortgage | With Mortgage |
| Less than 2.0x | 64 (65.3%) | 95,750 (145,075.8%) |
| 2.0x to 2.9x | 9 (9.2%) | 61 (92.4%) |
| 3.0x to 3.9x | 11 (11.2%) | 2 (3.0%) |
| 4.0x or more | 14 (14.3%) | 0 (0.0%) |
| Total | 98 (100.0%) | 66 (100.0%) |
Real Estate Taxes by Mortgage Status in Beckville
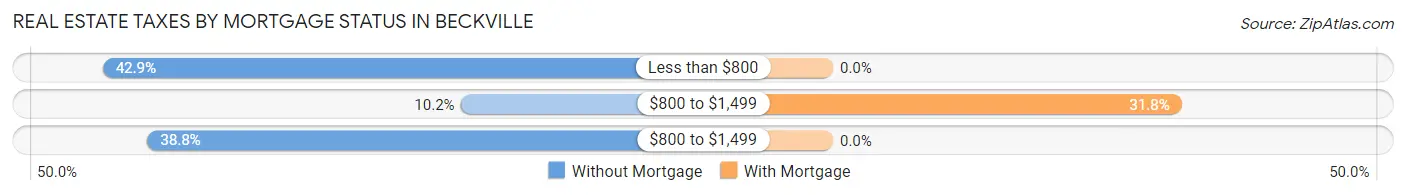
| Property Taxes | Without Mortgage | With Mortgage |
| Less than $800 | 42 (42.9%) | 0 (0.0%) |
| $800 to $1,499 | 10 (10.2%) | 21 (31.8%) |
| $800 to $1,499 | 38 (38.8%) | 0 (0.0%) |
| Total | 98 (100.0%) | 66 (100.0%) |
Health & Disability in Beckville
Health Insurance Coverage by Age in Beckville

| Age Bracket | With Coverage | Without Coverage |
| Under 6 Years | 66 (100.0%) | 0 (0.0%) |
| 6 to 18 Years | 200 (87.0%) | 30 (13.0%) |
| 19 to 25 Years | 17 (25.4%) | 50 (74.6%) |
| 26 to 34 Years | 47 (58.0%) | 34 (42.0%) |
| 35 to 44 Years | 42 (35.9%) | 75 (64.1%) |
| 45 to 54 Years | 70 (80.5%) | 17 (19.5%) |
| 55 to 64 Years | 69 (84.2%) | 13 (15.9%) |
| 65 to 74 Years | 56 (100.0%) | 0 (0.0%) |
| 75 Years and older | 25 (100.0%) | 0 (0.0%) |
| Total | 592 (73.0%) | 219 (27.0%) |
Health Insurance Coverage by Citizenship Status in Beckville
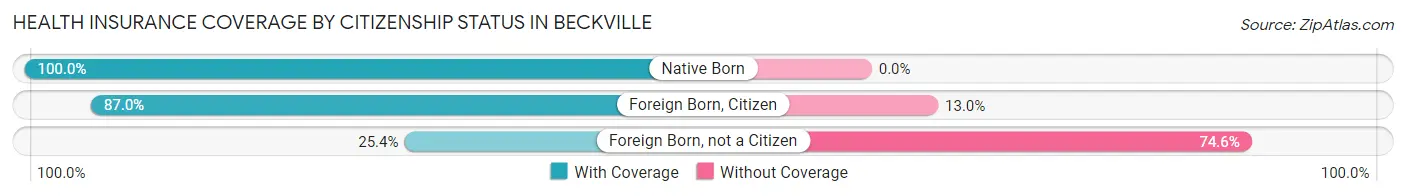
| Citizenship Status | With Coverage | Without Coverage |
| Native Born | 66 (100.0%) | 0 (0.0%) |
| Foreign Born, Citizen | 200 (87.0%) | 30 (13.0%) |
| Foreign Born, not a Citizen | 17 (25.4%) | 50 (74.6%) |
Health Insurance Coverage by Household Income in Beckville
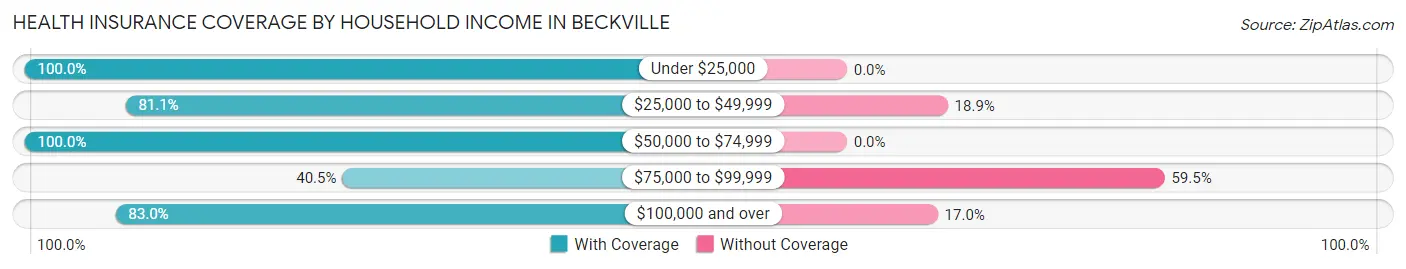
| Household Income | With Coverage | Without Coverage |
| Under $25,000 | 43 (100.0%) | 0 (0.0%) |
| $25,000 to $49,999 | 266 (81.1%) | 62 (18.9%) |
| $50,000 to $74,999 | 42 (100.0%) | 0 (0.0%) |
| $75,000 to $99,999 | 85 (40.5%) | 125 (59.5%) |
| $100,000 and over | 156 (83.0%) | 32 (17.0%) |
Public vs Private Health Insurance Coverage by Age in Beckville
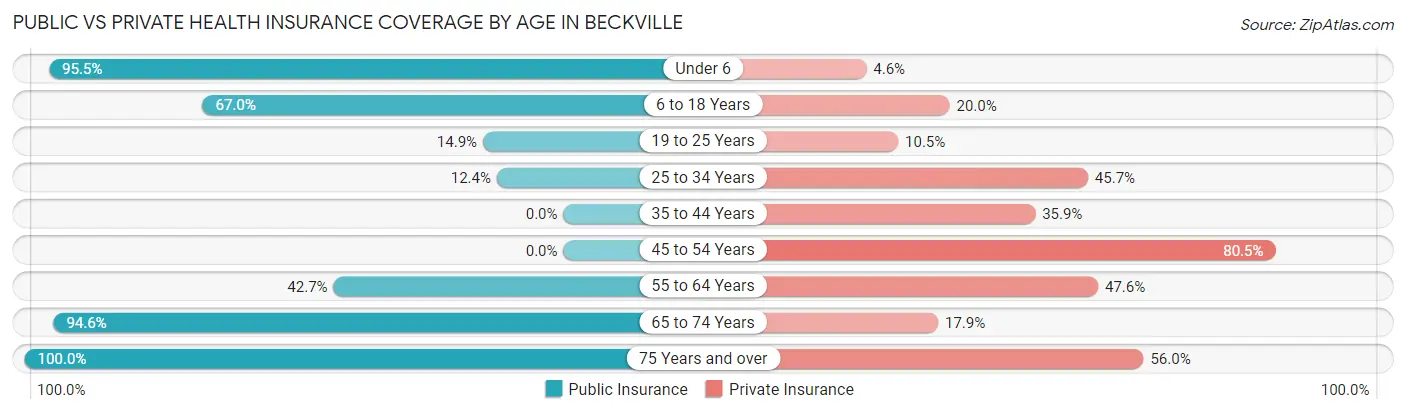
| Age Bracket | Public Insurance | Private Insurance |
| Under 6 | 63 (95.5%) | 3 (4.5%) |
| 6 to 18 Years | 154 (67.0%) | 46 (20.0%) |
| 19 to 25 Years | 10 (14.9%) | 7 (10.4%) |
| 25 to 34 Years | 10 (12.3%) | 37 (45.7%) |
| 35 to 44 Years | 0 (0.0%) | 42 (35.9%) |
| 45 to 54 Years | 0 (0.0%) | 70 (80.5%) |
| 55 to 64 Years | 35 (42.7%) | 39 (47.6%) |
| 65 to 74 Years | 53 (94.6%) | 10 (17.9%) |
| 75 Years and over | 25 (100.0%) | 14 (56.0%) |
| Total | 350 (43.2%) | 268 (33.1%) |
Disability Status by Sex by Age in Beckville
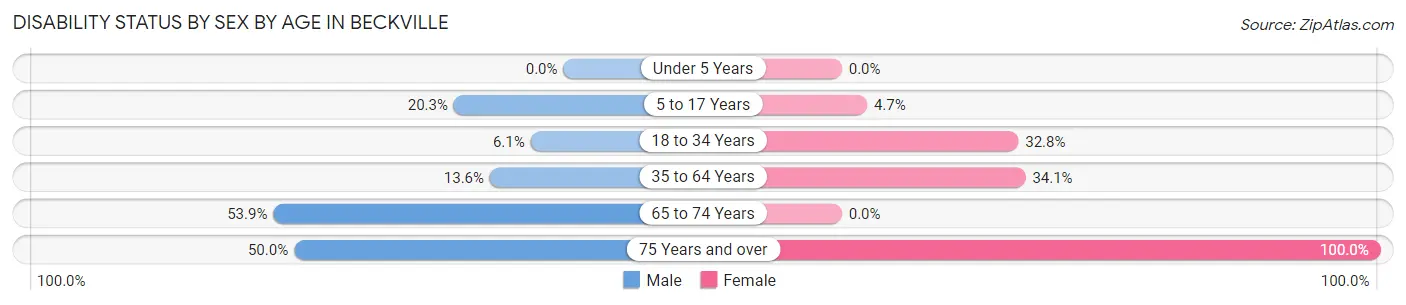
| Age Bracket | Male | Female |
| Under 5 Years | 0 (0.0%) | 0 (0.0%) |
| 5 to 17 Years | 24 (20.3%) | 5 (4.7%) |
| 18 to 34 Years | 7 (6.1%) | 19 (32.8%) |
| 35 to 64 Years | 15 (13.6%) | 60 (34.1%) |
| 65 to 74 Years | 14 (53.8%) | 0 (0.0%) |
| 75 Years and over | 5 (50.0%) | 15 (100.0%) |
Disability Class by Sex by Age in Beckville
Disability Class: Hearing Difficulty
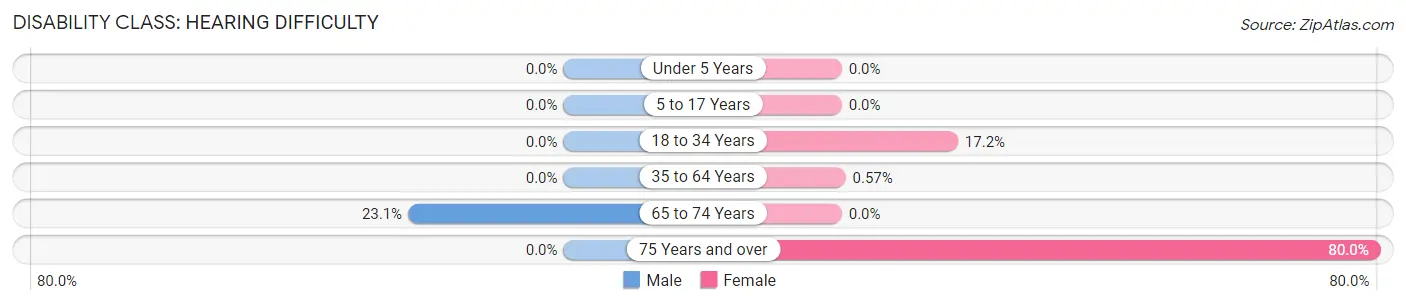
| Age Bracket | Male | Female |
| Under 5 Years | 0 (0.0%) | 0 (0.0%) |
| 5 to 17 Years | 0 (0.0%) | 0 (0.0%) |
| 18 to 34 Years | 0 (0.0%) | 10 (17.2%) |
| 35 to 64 Years | 0 (0.0%) | 1 (0.6%) |
| 65 to 74 Years | 6 (23.1%) | 0 (0.0%) |
| 75 Years and over | 0 (0.0%) | 12 (80.0%) |
Disability Class: Vision Difficulty
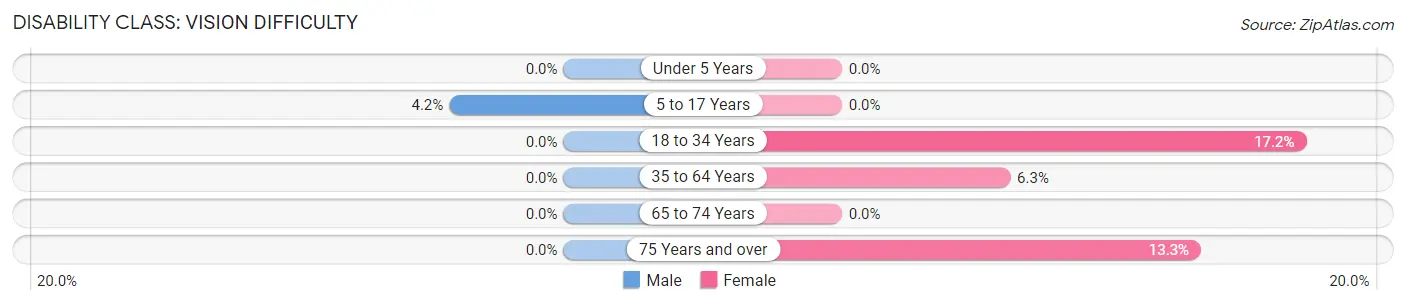
| Age Bracket | Male | Female |
| Under 5 Years | 0 (0.0%) | 0 (0.0%) |
| 5 to 17 Years | 5 (4.2%) | 0 (0.0%) |
| 18 to 34 Years | 0 (0.0%) | 10 (17.2%) |
| 35 to 64 Years | 0 (0.0%) | 11 (6.2%) |
| 65 to 74 Years | 0 (0.0%) | 0 (0.0%) |
| 75 Years and over | 0 (0.0%) | 2 (13.3%) |
Disability Class: Cognitive Difficulty
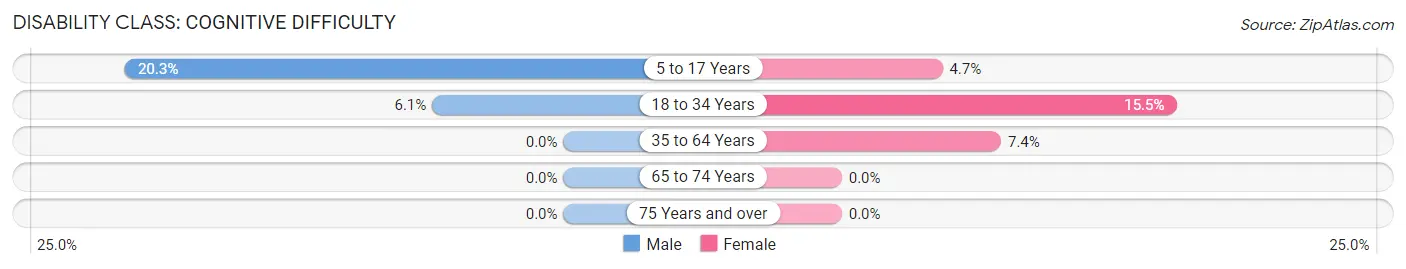
| Age Bracket | Male | Female |
| 5 to 17 Years | 24 (20.3%) | 5 (4.7%) |
| 18 to 34 Years | 7 (6.1%) | 9 (15.5%) |
| 35 to 64 Years | 0 (0.0%) | 13 (7.4%) |
| 65 to 74 Years | 0 (0.0%) | 0 (0.0%) |
| 75 Years and over | 0 (0.0%) | 0 (0.0%) |
Disability Class: Ambulatory Difficulty
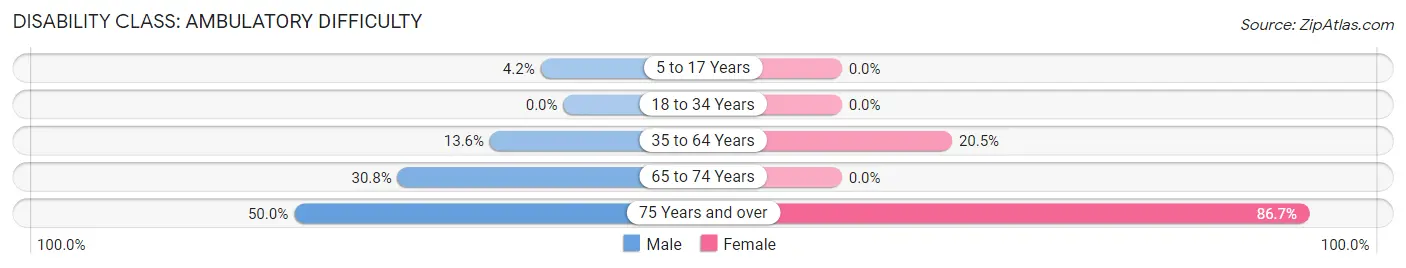
| Age Bracket | Male | Female |
| 5 to 17 Years | 5 (4.2%) | 0 (0.0%) |
| 18 to 34 Years | 0 (0.0%) | 0 (0.0%) |
| 35 to 64 Years | 15 (13.6%) | 36 (20.4%) |
| 65 to 74 Years | 8 (30.8%) | 0 (0.0%) |
| 75 Years and over | 5 (50.0%) | 13 (86.7%) |
Disability Class: Self-Care Difficulty
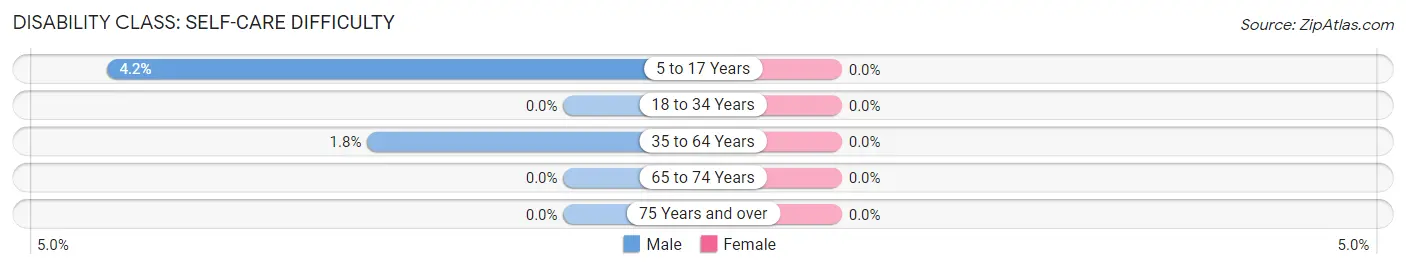
| Age Bracket | Male | Female |
| 5 to 17 Years | 5 (4.2%) | 0 (0.0%) |
| 18 to 34 Years | 0 (0.0%) | 0 (0.0%) |
| 35 to 64 Years | 2 (1.8%) | 0 (0.0%) |
| 65 to 74 Years | 0 (0.0%) | 0 (0.0%) |
| 75 Years and over | 0 (0.0%) | 0 (0.0%) |
Technology Access in Beckville
Computing Device Access in Beckville
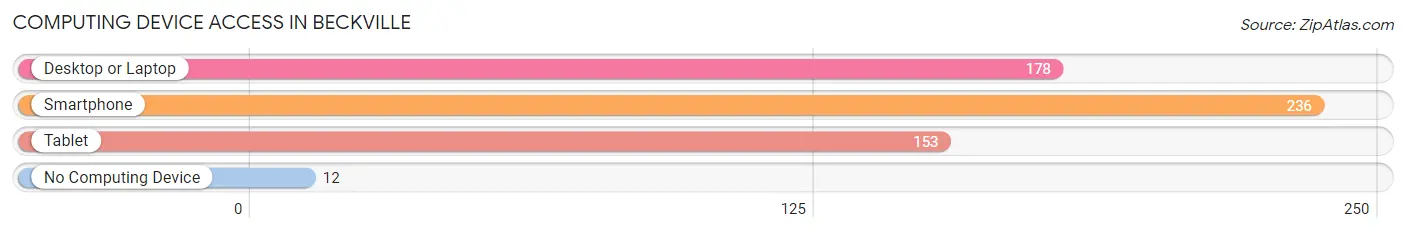
| Device Type | # Households | % Households |
| Desktop or Laptop | 178 | 67.4% |
| Smartphone | 236 | 89.4% |
| Tablet | 153 | 58.0% |
| No Computing Device | 12 | 4.5% |
| Total | 264 | 100.0% |
Internet Access in Beckville
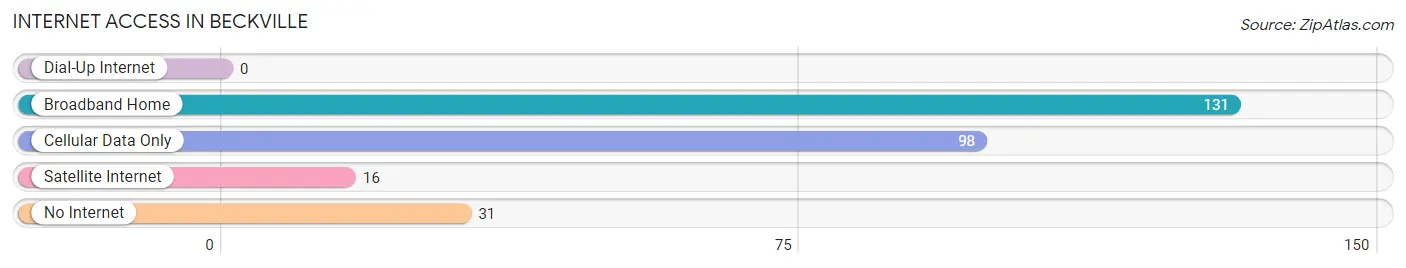
| Internet Type | # Households | % Households |
| Dial-Up Internet | 0 | 0.0% |
| Broadband Home | 131 | 49.6% |
| Cellular Data Only | 98 | 37.1% |
| Satellite Internet | 16 | 6.1% |
| No Internet | 31 | 11.7% |
| Total | 264 | 100.0% |
Beckville Summary
Beckville, Texas is a small town located in Panola County, Texas. It is situated about 90 miles east of Dallas and about 30 miles west of Shreveport, Louisiana. The population of Beckville was 1,072 in the 2010 census.
History
Beckville was founded in 1845 by William Beck, a settler from Tennessee. The town was originally called Beck’s Mill, but the name was changed to Beckville in 1854. The town was incorporated in 1876.
Beckville was a thriving agricultural community in the late 19th and early 20th centuries. Cotton was the main crop, and the town had several cotton gins and a cottonseed oil mill. The town also had a sawmill, a gristmill, and a blacksmith shop.
Geography
Beckville is located in the East Texas Piney Woods region. The town is situated on the banks of the Sabine River, which forms the border between Texas and Louisiana. The terrain is mostly flat, with some rolling hills. The climate is humid subtropical, with hot summers and mild winters.
Economy
Beckville’s economy is largely based on agriculture. Cotton is still the main crop, but other crops such as corn, soybeans, and wheat are also grown. The town also has several small businesses, including a grocery store, a hardware store, and a restaurant.
Demographics
According to the 2010 census, the population of Beckville was 1,072. The racial makeup of the town was 94.2% White, 3.2% African American, 0.7% Native American, 0.3% Asian, and 1.6% from other races. The median household income was $31,250, and the median family income was $37,500.
Conclusion
Beckville, Texas is a small town with a rich history and a vibrant economy. The town is situated in the East Texas Piney Woods region and is home to a diverse population. Agriculture is the main industry, but the town also has several small businesses. Beckville is a great place to live and work, and it is a great example of a small town in Texas.
Common Questions
What is Per Capita Income in Beckville?
Per Capita income in Beckville is $24,531.
What is the Median Family Income in Beckville?
Median Family Income in Beckville is $78,214.
What is the Median Household income in Beckville?
Median Household Income in Beckville is $48,750.
What is Income or Wage Gap in Beckville?
Income or Wage Gap in Beckville is 35.8%.
Women in Beckville earn 64.2 cents for every dollar earned by a man.
What is Inequality or Gini Index in Beckville?
Inequality or Gini Index in Beckville is 0.38.
What is the Total Population of Beckville?
Total Population of Beckville is 811.
What is the Total Male Population of Beckville?
Total Male Population of Beckville is 393.
What is the Total Female Population of Beckville?
Total Female Population of Beckville is 418.
What is the Ratio of Males per 100 Females in Beckville?
There are 94.02 Males per 100 Females in Beckville.
What is the Ratio of Females per 100 Males in Beckville?
There are 106.36 Females per 100 Males in Beckville.
What is the Median Population Age in Beckville?
Median Population Age in Beckville is 30.6 Years.
What is the Average Family Size in Beckville
Average Family Size in Beckville is 3.9 People.
What is the Average Household Size in Beckville
Average Household Size in Beckville is 3.1 People.
How Large is the Labor Force in Beckville?
There are 359 People in the Labor Forcein in Beckville.
What is the Percentage of People in the Labor Force in Beckville?
59.9% of People are in the Labor Force in Beckville.
What is the Unemployment Rate in Beckville?
Unemployment Rate in Beckville is 4.5%.