Beasley, TX Map & Demographics
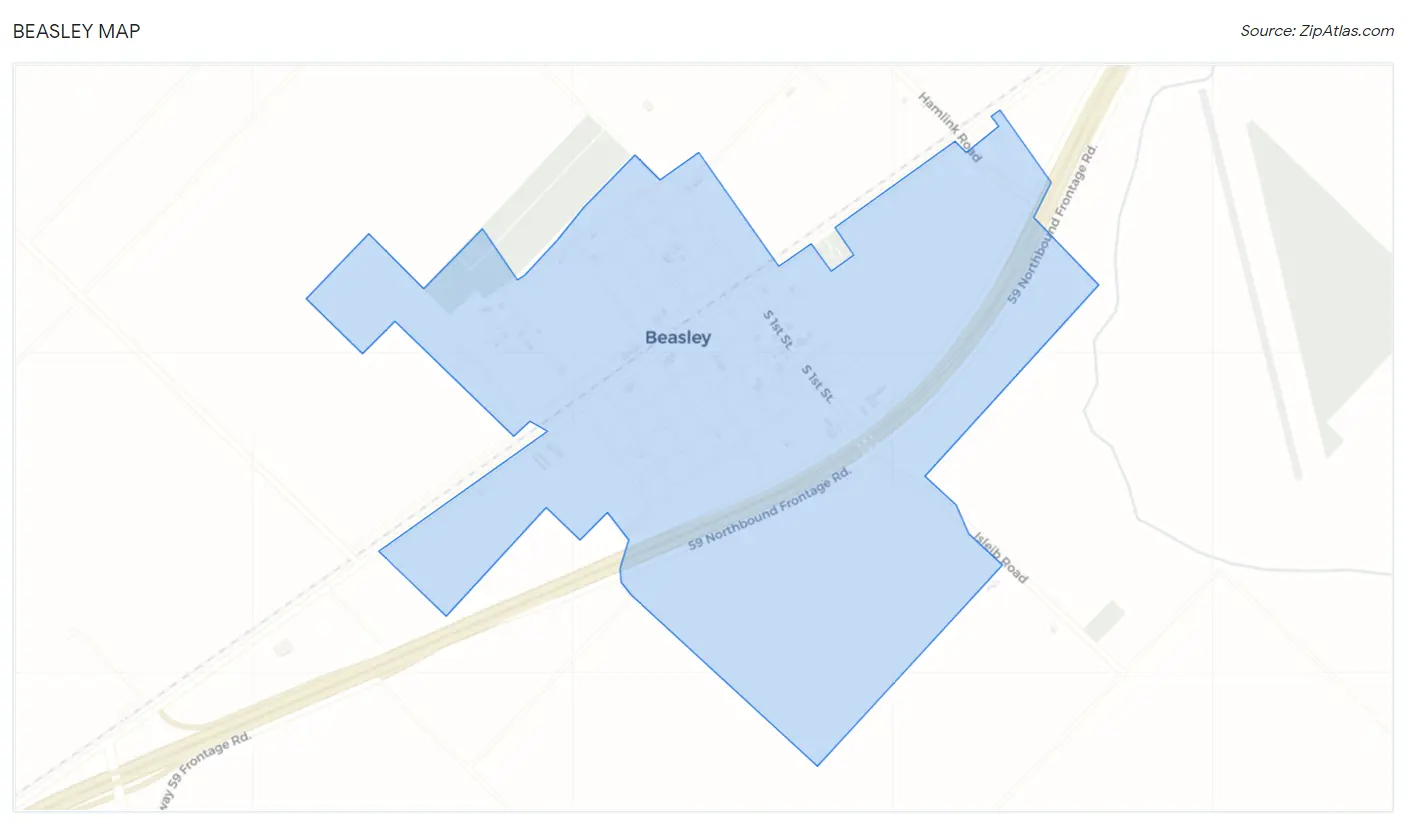
Beasley Map
Beasley Overview
$20,758
PER CAPITA INCOME
$71,090
AVG FAMILY INCOME
$70,519
AVG HOUSEHOLD INCOME
32.2%
WAGE / INCOME GAP [ % ]
67.8¢/ $1
WAGE / INCOME GAP [ $ ]
0.34
INEQUALITY / GINI INDEX
984
TOTAL POPULATION
550
MALE POPULATION
434
FEMALE POPULATION
126.73
MALES / 100 FEMALES
78.91
FEMALES / 100 MALES
34.0
MEDIAN AGE
4.2
AVG FAMILY SIZE
3.6
AVG HOUSEHOLD SIZE
418
LABOR FORCE [ PEOPLE ]
75.6%
PERCENT IN LABOR FORCE
20.1%
UNEMPLOYMENT RATE
Beasley Zip Codes
Income in Beasley
Income Overview in Beasley
Per Capita Income in Beasley is $20,758, while median incomes of families and households are $71,090 and $70,519 respectively.
| Characteristic | Number | Measure |
| Per Capita Income | 984 | $20,758 |
| Median Family Income | 220 | $71,090 |
| Mean Family Income | 220 | $80,035 |
| Median Household Income | 271 | $70,519 |
| Mean Household Income | 271 | $72,304 |
| Income Deficit | 220 | $0 |
| Wage / Income Gap (%) | 984 | 32.22% |
| Wage / Income Gap ($) | 984 | 67.78¢ per $1 |
| Gini / Inequality Index | 984 | 0.34 |
Earnings by Sex in Beasley
Average Earnings in Beasley are $34,500, $41,899 for men and $28,400 for women, a difference of 32.2%.
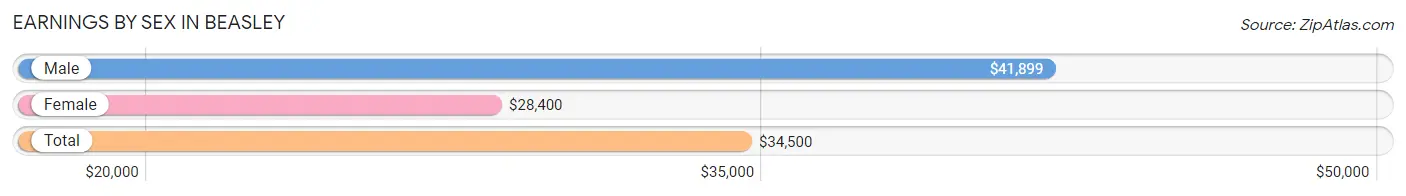
| Sex | Number | Average Earnings |
| Male | 204 (48.3%) | $41,899 |
| Female | 218 (51.7%) | $28,400 |
| Total | 422 (100.0%) | $34,500 |
Earnings by Sex by Income Bracket in Beasley
The most common earnings brackets in Beasley are $40,000 to $44,999 for men (79 | 38.7%) and $25,000 to $29,999 for women (100 | 45.9%).
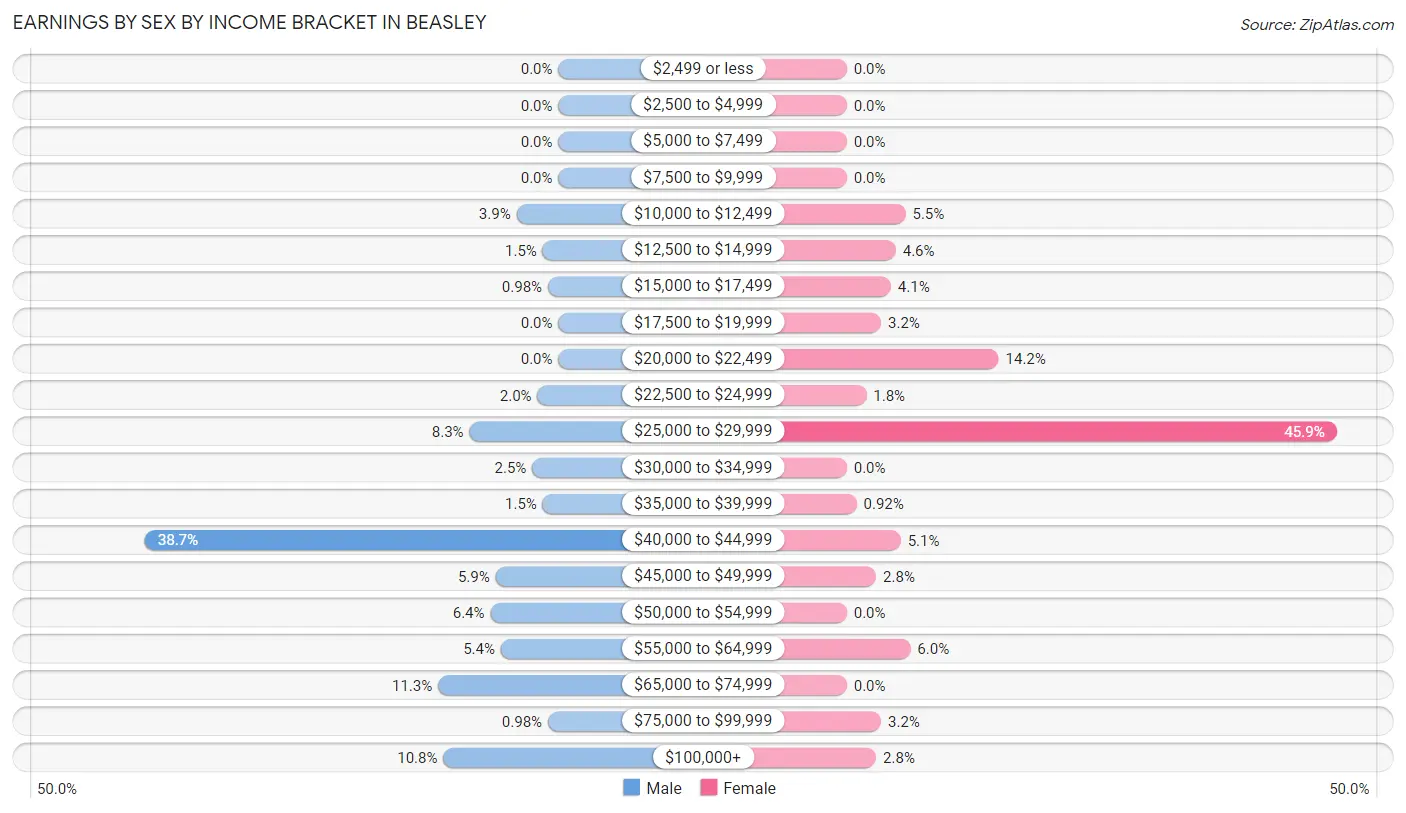
| Income | Male | Female |
| $2,499 or less | 0 (0.0%) | 0 (0.0%) |
| $2,500 to $4,999 | 0 (0.0%) | 0 (0.0%) |
| $5,000 to $7,499 | 0 (0.0%) | 0 (0.0%) |
| $7,500 to $9,999 | 0 (0.0%) | 0 (0.0%) |
| $10,000 to $12,499 | 8 (3.9%) | 12 (5.5%) |
| $12,500 to $14,999 | 3 (1.5%) | 10 (4.6%) |
| $15,000 to $17,499 | 2 (1.0%) | 9 (4.1%) |
| $17,500 to $19,999 | 0 (0.0%) | 7 (3.2%) |
| $20,000 to $22,499 | 0 (0.0%) | 31 (14.2%) |
| $22,500 to $24,999 | 4 (2.0%) | 4 (1.8%) |
| $25,000 to $29,999 | 17 (8.3%) | 100 (45.9%) |
| $30,000 to $34,999 | 5 (2.5%) | 0 (0.0%) |
| $35,000 to $39,999 | 3 (1.5%) | 2 (0.9%) |
| $40,000 to $44,999 | 79 (38.7%) | 11 (5.1%) |
| $45,000 to $49,999 | 12 (5.9%) | 6 (2.8%) |
| $50,000 to $54,999 | 13 (6.4%) | 0 (0.0%) |
| $55,000 to $64,999 | 11 (5.4%) | 13 (6.0%) |
| $65,000 to $74,999 | 23 (11.3%) | 0 (0.0%) |
| $75,000 to $99,999 | 2 (1.0%) | 7 (3.2%) |
| $100,000+ | 22 (10.8%) | 6 (2.8%) |
| Total | 204 (100.0%) | 218 (100.0%) |
Earnings by Sex by Educational Attainment in Beasley
Average earnings in Beasley are $42,089 for men and $28,713 for women, a difference of 31.8%. Men with an educational attainment of college or associate's degree enjoy the highest average annual earnings of $83,750, while those with high school diploma education earn the least with $35,833. Women with an educational attainment of bachelor's degree earn the most with the average annual earnings of $57,031, while those with high school diploma education have the smallest earnings of $28,425.
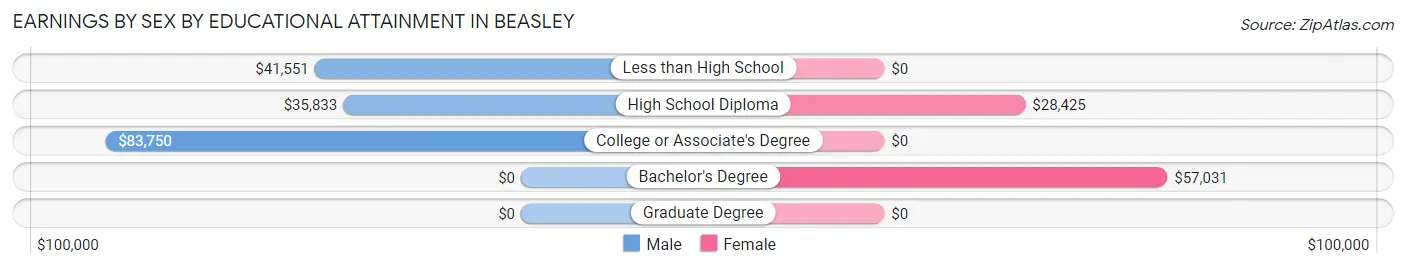
| Educational Attainment | Male Income | Female Income |
| Less than High School | $41,551 | $0 |
| High School Diploma | $35,833 | $28,425 |
| College or Associate's Degree | $83,750 | $0 |
| Bachelor's Degree | - | - |
| Graduate Degree | - | - |
| Total | $42,089 | $28,713 |
Family Income in Beasley
Family Income Brackets in Beasley
According to the Beasley family income data, there are 117 families falling into the $50,000 to $74,999 income range, which is the most common income bracket and makes up 53.2% of all families.
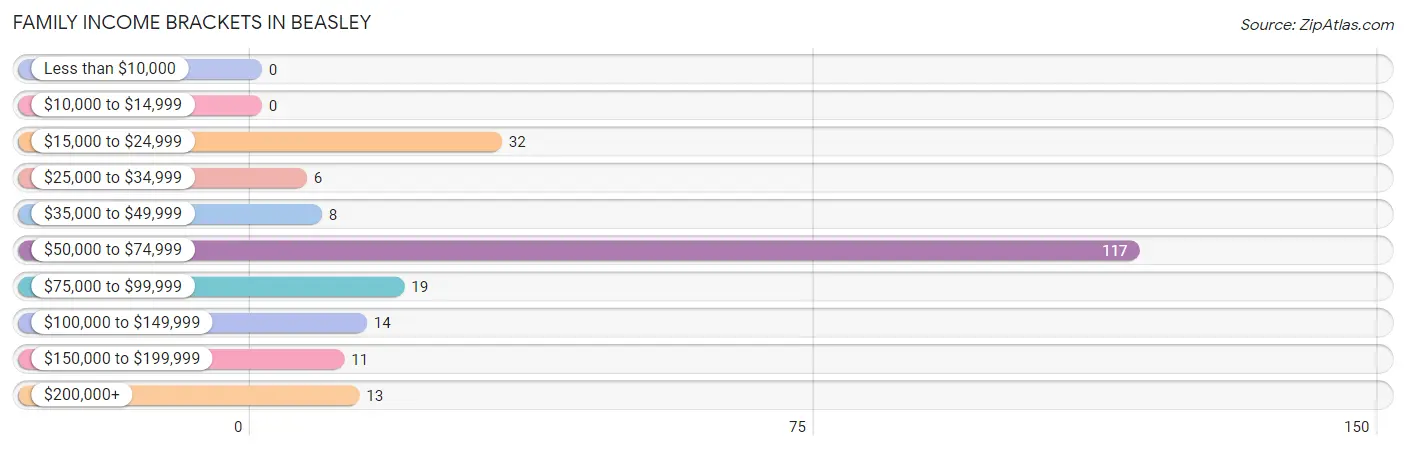
| Income Bracket | # Families | % Families |
| Less than $10,000 | 0 | 0.0% |
| $10,000 to $14,999 | 0 | 0.0% |
| $15,000 to $24,999 | 32 | 14.5% |
| $25,000 to $34,999 | 6 | 2.7% |
| $35,000 to $49,999 | 8 | 3.6% |
| $50,000 to $74,999 | 117 | 53.2% |
| $75,000 to $99,999 | 19 | 8.6% |
| $100,000 to $149,999 | 14 | 6.4% |
| $150,000 to $199,999 | 11 | 5.0% |
| $200,000+ | 13 | 5.9% |
Family Income by Famaliy Size in Beasley
4-person families (13 | 5.9%) account for the highest median family income in Beasley with $156,250 per family, while 4-person families (13 | 5.9%) have the highest median income of $39,062 per family member.
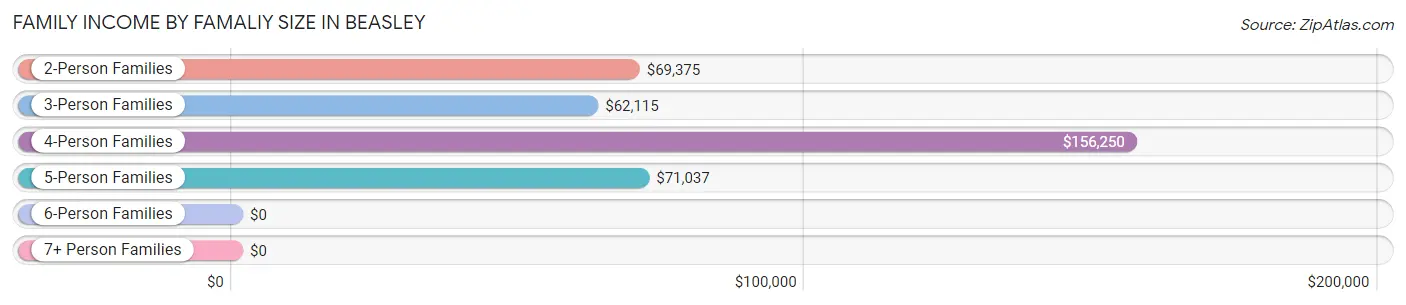
| Income Bracket | # Families | Median Income |
| 2-Person Families | 27 (12.3%) | $69,375 |
| 3-Person Families | 38 (17.3%) | $62,115 |
| 4-Person Families | 13 (5.9%) | $156,250 |
| 5-Person Families | 136 (61.8%) | $71,037 |
| 6-Person Families | 6 (2.7%) | $0 |
| 7+ Person Families | 0 (0.0%) | $0 |
| Total | 220 (100.0%) | $71,090 |
Family Income by Number of Earners in Beasley
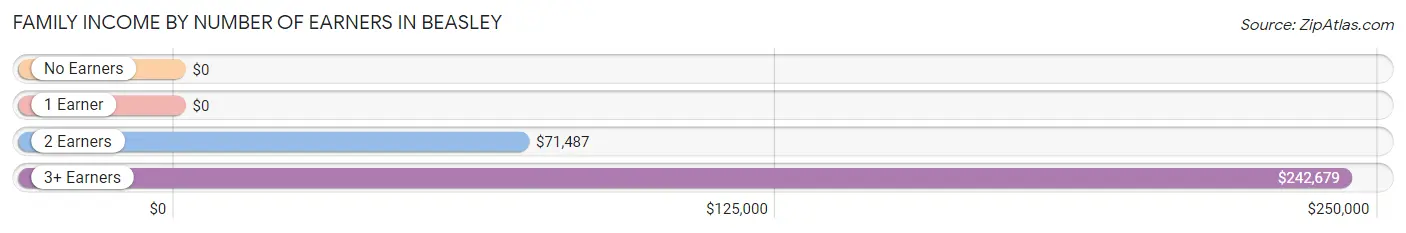
| Number of Earners | # Families | Median Income |
| No Earners | 3 (1.4%) | $0 |
| 1 Earner | 84 (38.2%) | $0 |
| 2 Earners | 120 (54.5%) | $71,487 |
| 3+ Earners | 13 (5.9%) | $242,679 |
| Total | 220 (100.0%) | $71,090 |
Household Income in Beasley
Household Income Brackets in Beasley
With 126 households falling in the category, the $50,000 to $74,999 income range is the most frequent in Beasley, accounting for 46.5% of all households.
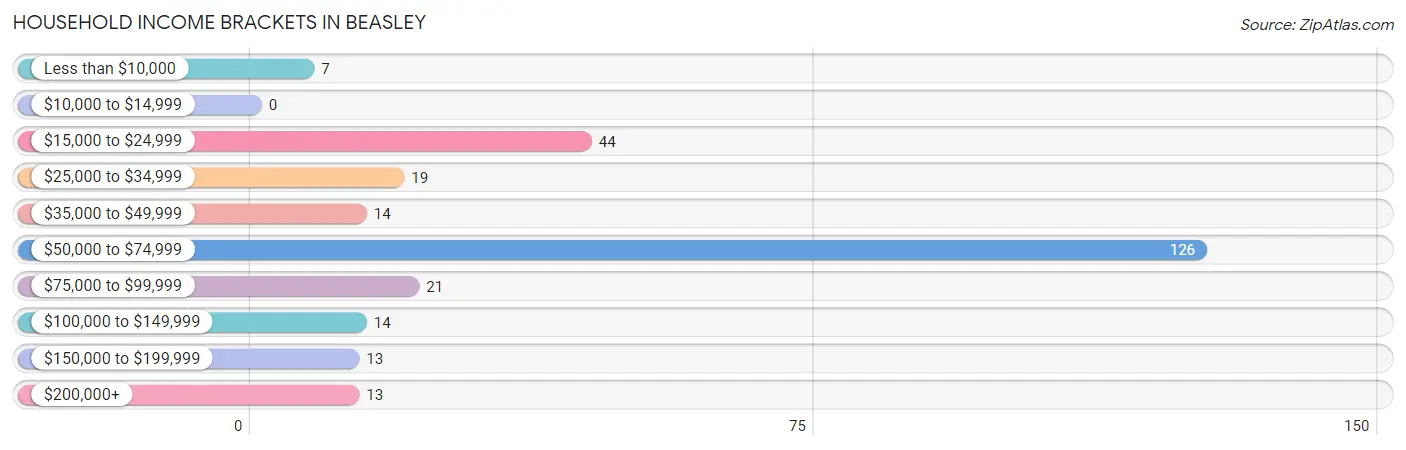
| Income Bracket | # Households | % Households |
| Less than $10,000 | 7 | 2.6% |
| $10,000 to $14,999 | 0 | 0.0% |
| $15,000 to $24,999 | 44 | 16.2% |
| $25,000 to $34,999 | 19 | 7.0% |
| $35,000 to $49,999 | 14 | 5.2% |
| $50,000 to $74,999 | 126 | 46.5% |
| $75,000 to $99,999 | 21 | 7.7% |
| $100,000 to $149,999 | 14 | 5.2% |
| $150,000 to $199,999 | 13 | 4.8% |
| $200,000+ | 13 | 4.8% |
Household Income by Householder Age in Beasley
The median household income in Beasley is $70,519, with the highest median household income of $70,851 found in the 25 to 44 years age bracket for the primary householder. A total of 176 households (64.9%) fall into this category.
| Income Bracket | # Households | Median Income |
| 15 to 24 Years | 0 (0.0%) | $0 |
| 25 to 44 Years | 176 (64.9%) | $70,851 |
| 45 to 64 Years | 52 (19.2%) | $67,813 |
| 65+ Years | 43 (15.9%) | $44,375 |
| Total | 271 (100.0%) | $70,519 |
Poverty in Beasley
Income Below Poverty by Sex and Age in Beasley
With 11.5% poverty level for males and 23.0% for females among the residents of Beasley, 12 to 14 year old males and under 5 year old females are the most vulnerable to poverty, with 58 males (40.3%) and 36 females (100.0%) in their respective age groups living below the poverty level.
| Age Bracket | Male | Female |
| Under 5 Years | 0 (0.0%) | 36 (100.0%) |
| 5 Years | 0 (0.0%) | 0 (0.0%) |
| 6 to 11 Years | 0 (0.0%) | 28 (62.2%) |
| 12 to 14 Years | 58 (40.3%) | 0 (0.0%) |
| 15 Years | 0 (0.0%) | 0 (0.0%) |
| 16 and 17 Years | 0 (0.0%) | 0 (0.0%) |
| 18 to 24 Years | 0 (0.0%) | 0 (0.0%) |
| 25 to 34 Years | 0 (0.0%) | 0 (0.0%) |
| 35 to 44 Years | 0 (0.0%) | 29 (15.7%) |
| 45 to 54 Years | 0 (0.0%) | 5 (29.4%) |
| 55 to 64 Years | 5 (15.6%) | 0 (0.0%) |
| 65 to 74 Years | 0 (0.0%) | 0 (0.0%) |
| 75 Years and over | 0 (0.0%) | 2 (14.3%) |
| Total | 63 (11.5%) | 100 (23.0%) |
Income Above Poverty by Sex and Age in Beasley
According to the poverty statistics in Beasley, males aged under 5 years and females aged 15 years are the age groups that are most secure financially, with 100.0% of males and 100.0% of females in these age groups living above the poverty line.
| Age Bracket | Male | Female |
| Under 5 Years | 24 (100.0%) | 0 (0.0%) |
| 5 Years | 0 (0.0%) | 0 (0.0%) |
| 6 to 11 Years | 122 (100.0%) | 17 (37.8%) |
| 12 to 14 Years | 86 (59.7%) | 0 (0.0%) |
| 15 Years | 5 (100.0%) | 55 (100.0%) |
| 16 and 17 Years | 4 (100.0%) | 8 (100.0%) |
| 18 to 24 Years | 10 (100.0%) | 22 (100.0%) |
| 25 to 34 Years | 21 (100.0%) | 7 (100.0%) |
| 35 to 44 Years | 137 (100.0%) | 156 (84.3%) |
| 45 to 54 Years | 36 (100.0%) | 12 (70.6%) |
| 55 to 64 Years | 27 (84.4%) | 13 (100.0%) |
| 65 to 74 Years | 13 (100.0%) | 32 (100.0%) |
| 75 Years and over | 2 (100.0%) | 12 (85.7%) |
| Total | 487 (88.5%) | 334 (77.0%) |
Income Below Poverty Among Married-Couple Families in Beasley
| Children | Above Poverty | Below Poverty |
| No Children | 31 (100.0%) | 0 (0.0%) |
| 1 or 2 Children | 38 (100.0%) | 0 (0.0%) |
| 3 or 4 Children | 98 (100.0%) | 0 (0.0%) |
| 5 or more Children | 0 (0.0%) | 0 (0.0%) |
| Total | 167 (100.0%) | 0 (0.0%) |
Income Below Poverty Among Single-Parent Households in Beasley
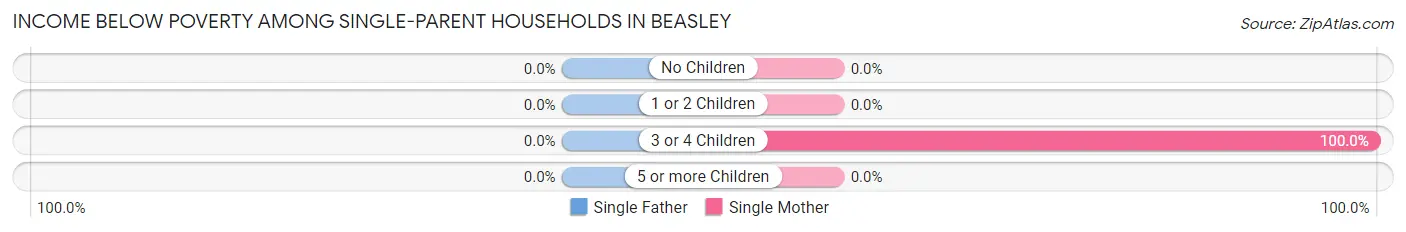
| Children | Single Father | Single Mother |
| No Children | 0 (0.0%) | 0 (0.0%) |
| 1 or 2 Children | 0 (0.0%) | 0 (0.0%) |
| 3 or 4 Children | 0 (0.0%) | 29 (100.0%) |
| 5 or more Children | 0 (0.0%) | 0 (0.0%) |
| Total | 0 (0.0%) | 29 (61.7%) |
Income Below Poverty Among Married-Couple vs Single-Parent Households in Beasley
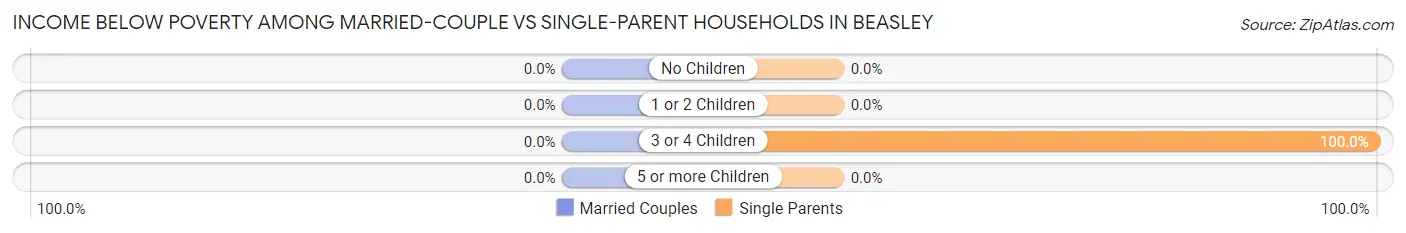
| Children | Married-Couple Families | Single-Parent Households |
| No Children | 0 (0.0%) | 0 (0.0%) |
| 1 or 2 Children | 0 (0.0%) | 0 (0.0%) |
| 3 or 4 Children | 0 (0.0%) | 29 (100.0%) |
| 5 or more Children | 0 (0.0%) | 0 (0.0%) |
| Total | 0 (0.0%) | 29 (54.7%) |
Race in Beasley
The most populous races in Beasley are Hispanic or Latino (700 | 71.1%), White / Caucasian (451 | 45.8%), and Two or more Races (427 | 43.4%).
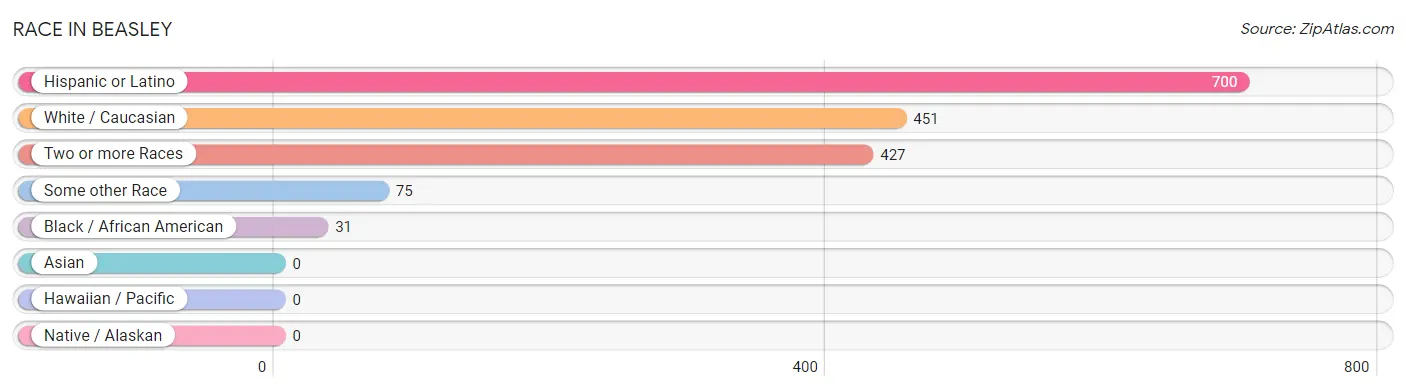
| Race | # Population | % Population |
| Asian | 0 | 0.0% |
| Black / African American | 31 | 3.2% |
| Hawaiian / Pacific | 0 | 0.0% |
| Hispanic or Latino | 700 | 71.1% |
| Native / Alaskan | 0 | 0.0% |
| White / Caucasian | 451 | 45.8% |
| Two or more Races | 427 | 43.4% |
| Some other Race | 75 | 7.6% |
| Total | 984 | 100.0% |
Ancestry in Beasley
The most populous ancestries reported in Beasley are Mexican (660 | 67.1%), German (66 | 6.7%), Czech (41 | 4.2%), Central American (40 | 4.1%), and Salvadoran (40 | 4.1%), together accounting for 86.1% of all Beasley residents.
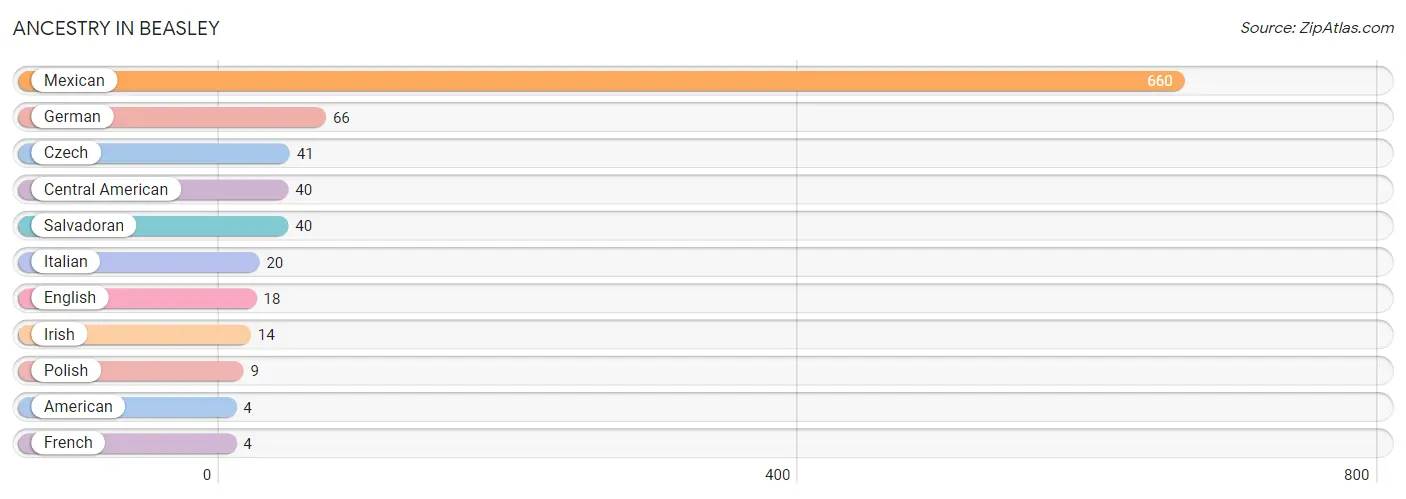
| Ancestry | # Population | % Population |
| American | 4 | 0.4% |
| Central American | 40 | 4.1% |
| Czech | 41 | 4.2% |
| English | 18 | 1.8% |
| French | 4 | 0.4% |
| German | 66 | 6.7% |
| Irish | 14 | 1.4% |
| Italian | 20 | 2.0% |
| Mexican | 660 | 67.1% |
| Polish | 9 | 0.9% |
| Salvadoran | 40 | 4.1% | View All 11 Rows |
Immigrants in Beasley
The most numerous immigrant groups reported in Beasley came from Central America (24 | 2.4%), Latin America (24 | 2.4%), Mexico (23 | 2.3%), and El Salvador (1 | 0.1%), together accounting for 7.3% of all Beasley residents.
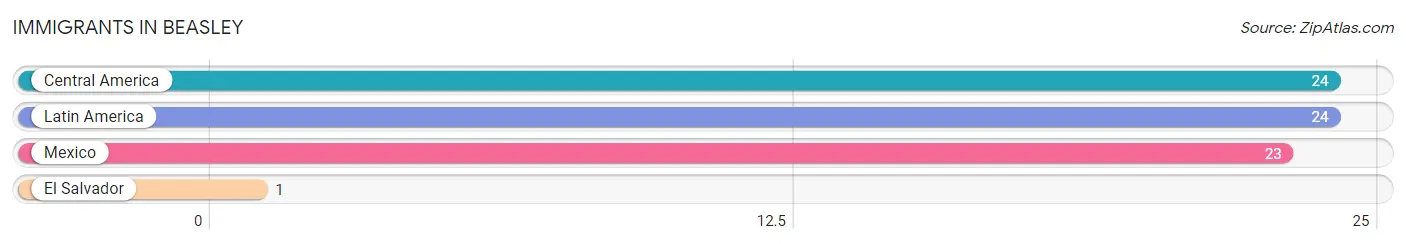
| Immigration Origin | # Population | % Population |
| Central America | 24 | 2.4% |
| El Salvador | 1 | 0.1% |
| Latin America | 24 | 2.4% |
| Mexico | 23 | 2.3% | View All 4 Rows |
Sex and Age in Beasley
Sex and Age in Beasley
The most populous age groups in Beasley are 10 to 14 Years (244 | 44.4%) for men and 35 to 39 Years (159 | 36.6%) for women.
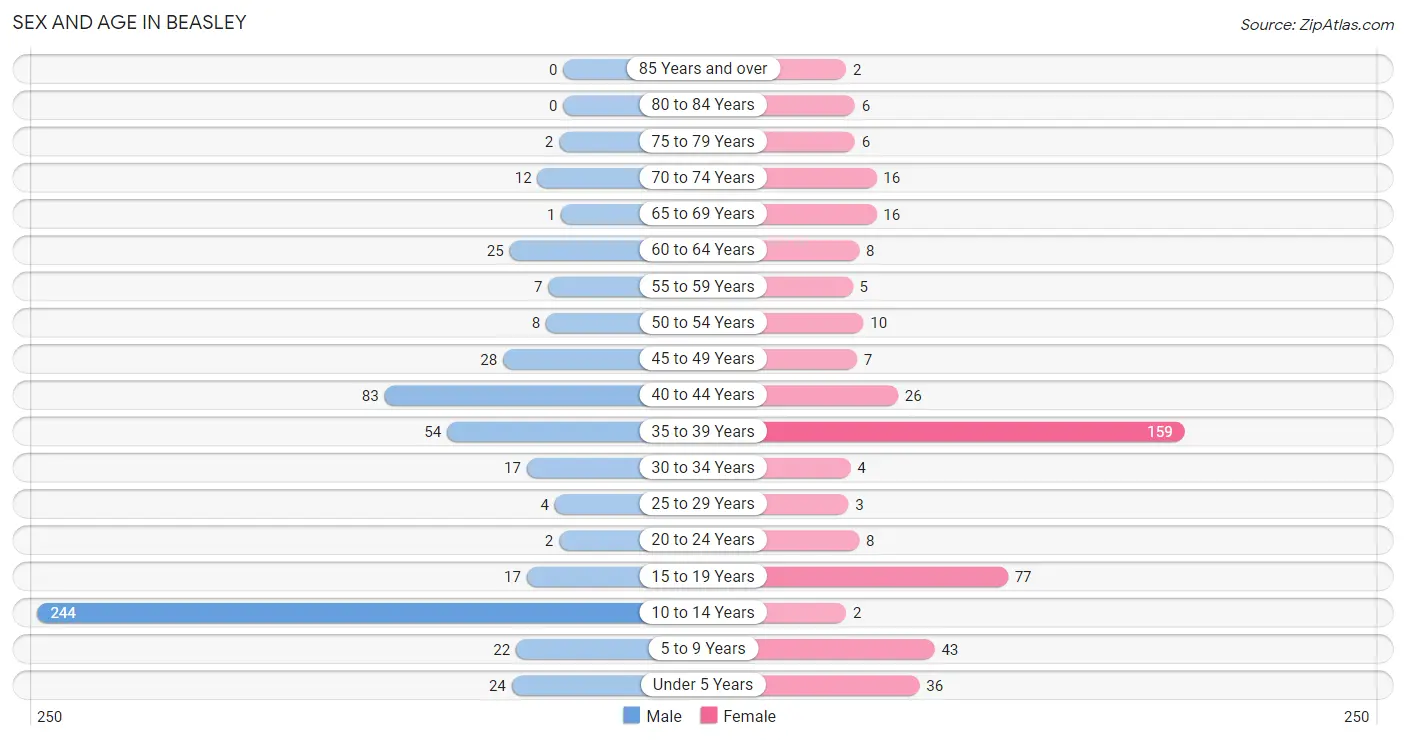
| Age Bracket | Male | Female |
| Under 5 Years | 24 (4.4%) | 36 (8.3%) |
| 5 to 9 Years | 22 (4.0%) | 43 (9.9%) |
| 10 to 14 Years | 244 (44.4%) | 2 (0.5%) |
| 15 to 19 Years | 17 (3.1%) | 77 (17.7%) |
| 20 to 24 Years | 2 (0.4%) | 8 (1.8%) |
| 25 to 29 Years | 4 (0.7%) | 3 (0.7%) |
| 30 to 34 Years | 17 (3.1%) | 4 (0.9%) |
| 35 to 39 Years | 54 (9.8%) | 159 (36.6%) |
| 40 to 44 Years | 83 (15.1%) | 26 (6.0%) |
| 45 to 49 Years | 28 (5.1%) | 7 (1.6%) |
| 50 to 54 Years | 8 (1.5%) | 10 (2.3%) |
| 55 to 59 Years | 7 (1.3%) | 5 (1.1%) |
| 60 to 64 Years | 25 (4.5%) | 8 (1.8%) |
| 65 to 69 Years | 1 (0.2%) | 16 (3.7%) |
| 70 to 74 Years | 12 (2.2%) | 16 (3.7%) |
| 75 to 79 Years | 2 (0.4%) | 6 (1.4%) |
| 80 to 84 Years | 0 (0.0%) | 6 (1.4%) |
| 85 Years and over | 0 (0.0%) | 2 (0.5%) |
| Total | 550 (100.0%) | 434 (100.0%) |
Families and Households in Beasley
Median Family Size in Beasley
The median family size in Beasley is 4.21 persons per family, with single female/mother families (47 | 21.4%) accounting for the largest median family size of 4.26 persons per family. On the other hand, single male/father families (6 | 2.7%) represent the smallest median family size with 2.83 persons per family.
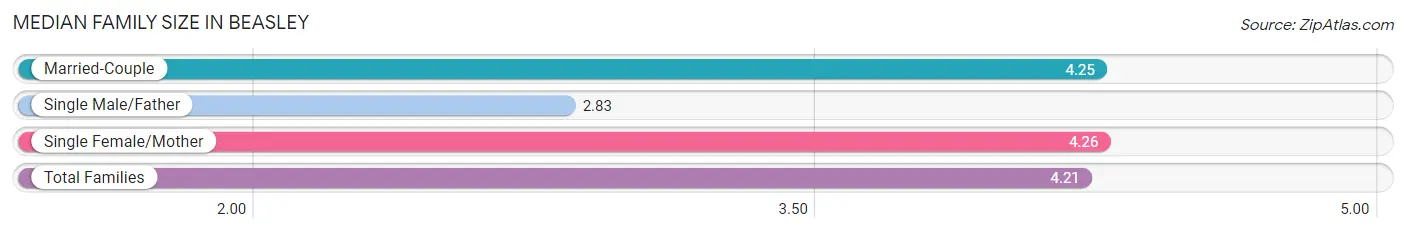
| Family Type | # Families | Family Size |
| Married-Couple | 167 (75.9%) | 4.25 |
| Single Male/Father | 6 (2.7%) | 2.83 |
| Single Female/Mother | 47 (21.4%) | 4.26 |
| Total Families | 220 (100.0%) | 4.21 |
Median Household Size in Beasley
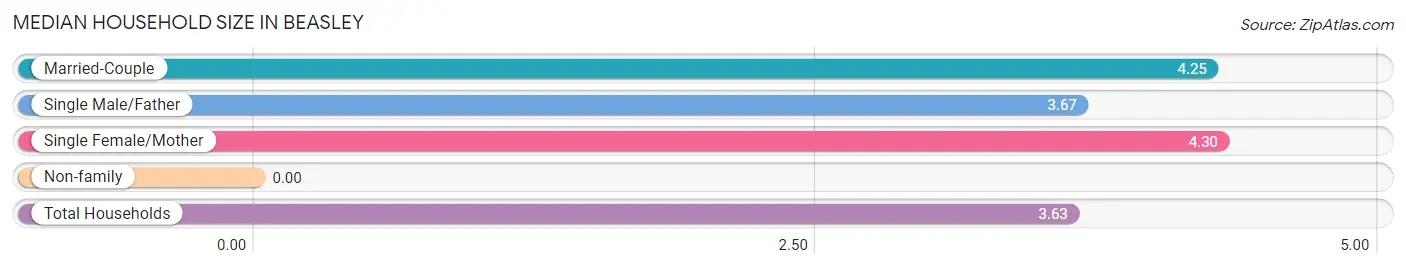
| Household Type | # Households | Household Size |
| Married-Couple | 167 (61.6%) | 4.25 |
| Single Male/Father | 6 (2.2%) | 3.67 |
| Single Female/Mother | 47 (17.3%) | 4.30 |
| Non-family | 51 (18.8%) | - |
| Total Households | 271 (100.0%) | 3.63 |
Household Size by Marriage Status in Beasley
Out of a total of 271 households in Beasley, 220 (81.2%) are family households, while 51 (18.8%) are nonfamily households. The most numerous type of family households are 5-person households, comprising 136, and the most common type of nonfamily households are 1-person households, comprising 51.
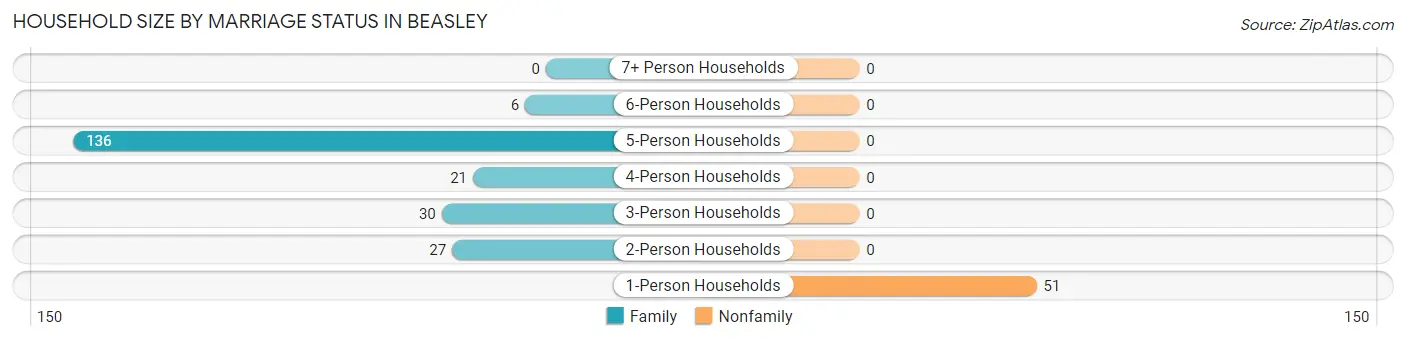
| Household Size | Family Households | Nonfamily Households |
| 1-Person Households | - | 51 (18.8%) |
| 2-Person Households | 27 (10.0%) | 0 (0.0%) |
| 3-Person Households | 30 (11.1%) | 0 (0.0%) |
| 4-Person Households | 21 (7.7%) | 0 (0.0%) |
| 5-Person Households | 136 (50.2%) | 0 (0.0%) |
| 6-Person Households | 6 (2.2%) | 0 (0.0%) |
| 7+ Person Households | 0 (0.0%) | 0 (0.0%) |
| Total | 220 (81.2%) | 51 (18.8%) |
Female Fertility in Beasley
Fertility by Age in Beasley
Average fertility rate in Beasley is 14.0 births per 1,000 women. Women in the age bracket of 20 to 34 years have the highest fertility rate with 267.0 births per 1,000 women. Women in the age bracket of 20 to 34 years acount for 100.0% of all women with births.
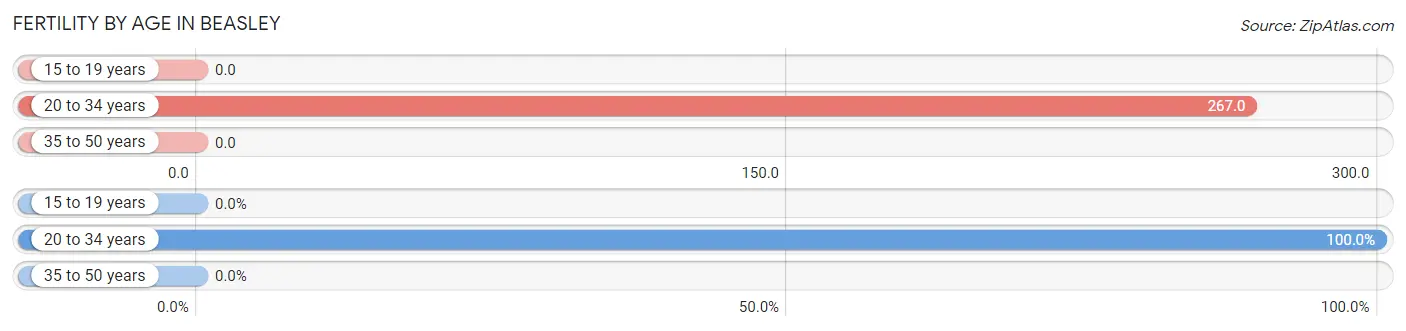
| Age Bracket | Women with Births | Births / 1,000 Women |
| 15 to 19 years | 0 (0.0%) | 0.0 |
| 20 to 34 years | 4 (100.0%) | 267.0 |
| 35 to 50 years | 0 (0.0%) | 0.0 |
| Total | 4 (100.0%) | 14.0 |
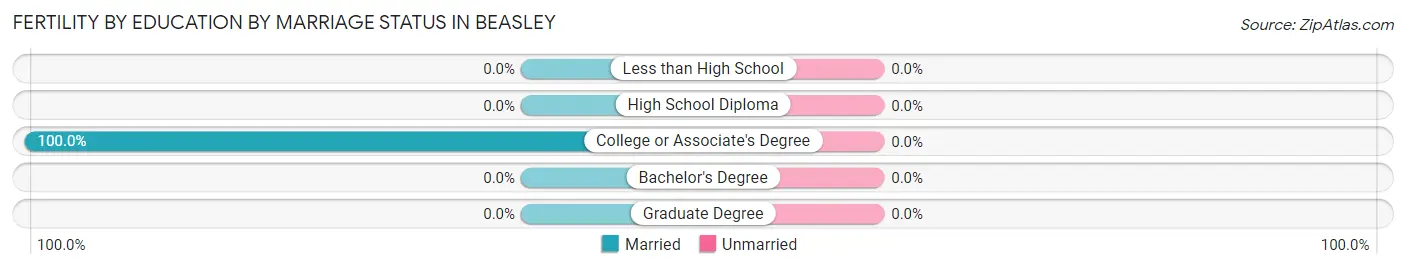
Fertility by Age by Marriage Status in Beasley
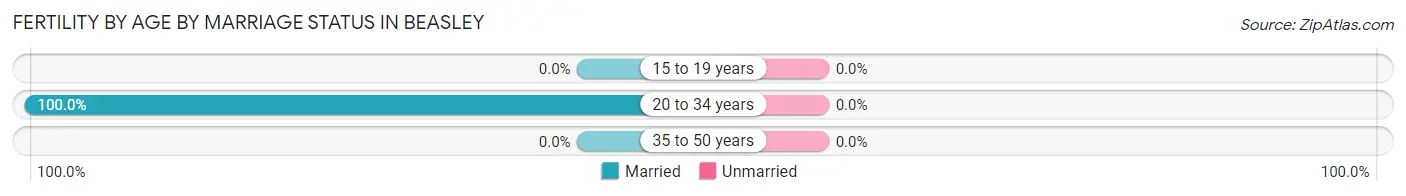
| Age Bracket | Married | Unmarried |
| 15 to 19 years | 0 (0.0%) | 0 (0.0%) |
| 20 to 34 years | 4 (100.0%) | 0 (0.0%) |
| 35 to 50 years | 0 (0.0%) | 0 (0.0%) |
| Total | 4 (100.0%) | 0 (0.0%) |
Fertility by Education in Beasley
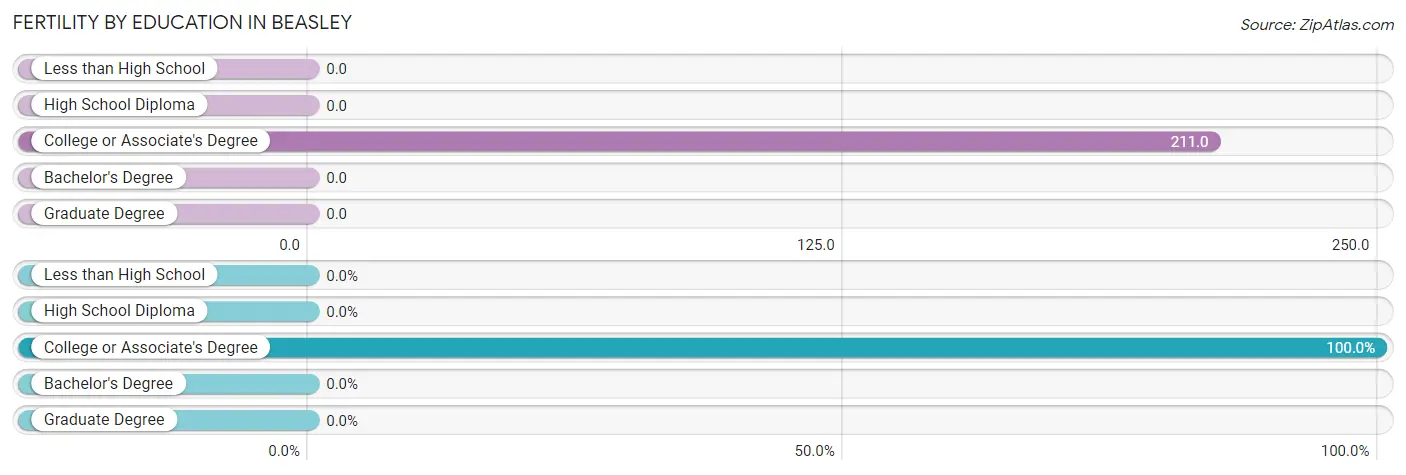
| Educational Attainment | Women with Births | Births / 1,000 Women |
| Less than High School | 0 (0.0%) | 0.0 |
| High School Diploma | 0 (0.0%) | 0.0 |
| College or Associate's Degree | 4 (100.0%) | 211.0 |
| Bachelor's Degree | 0 (0.0%) | 0.0 |
| Graduate Degree | 0 (0.0%) | 0.0 |
| Total | 4 (100.0%) | 14.0 |
Fertility by Education by Marriage Status in Beasley
| Educational Attainment | Married | Unmarried |
| Less than High School | 0 (0.0%) | 0 (0.0%) |
| High School Diploma | 0 (0.0%) | 0 (0.0%) |
| College or Associate's Degree | 4 (100.0%) | 0 (0.0%) |
| Bachelor's Degree | 0 (0.0%) | 0 (0.0%) |
| Graduate Degree | 0 (0.0%) | 0 (0.0%) |
| Total | 4 (100.0%) | 0 (0.0%) |
Employment Characteristics in Beasley
Employment by Class of Employer in Beasley
Among the 326 employed individuals in Beasley, private company employees (247 | 75.8%), local government employees (58 | 17.8%), and self-employed (not incorporated) (17 | 5.2%) make up the most common classes of employment.
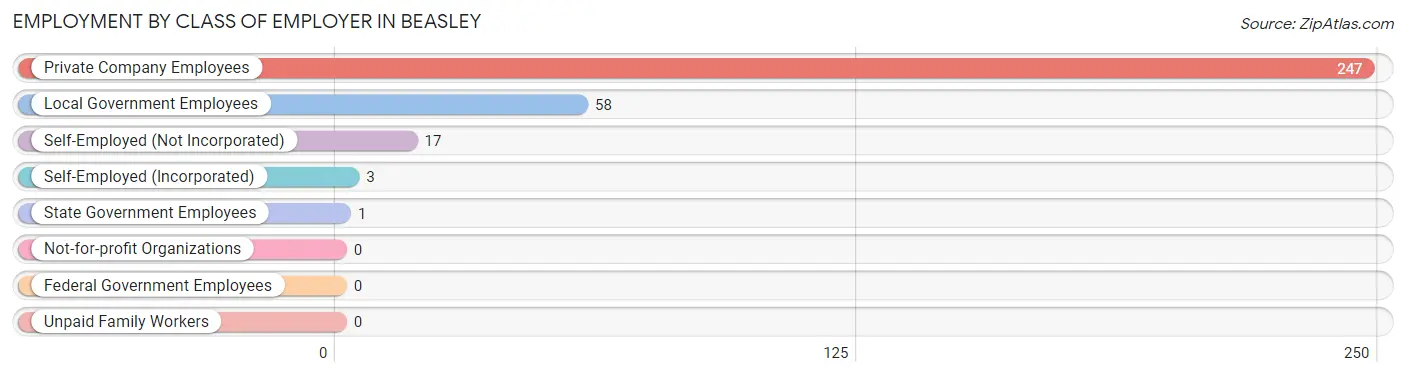
| Employer Class | # Employees | % Employees |
| Private Company Employees | 247 | 75.8% |
| Self-Employed (Incorporated) | 3 | 0.9% |
| Self-Employed (Not Incorporated) | 17 | 5.2% |
| Not-for-profit Organizations | 0 | 0.0% |
| Local Government Employees | 58 | 17.8% |
| State Government Employees | 1 | 0.3% |
| Federal Government Employees | 0 | 0.0% |
| Unpaid Family Workers | 0 | 0.0% |
| Total | 326 | 100.0% |
Employment Status by Age in Beasley
According to the labor force statistics for Beasley, out of the total population over 16 years of age (553), 75.6% or 418 individuals are in the labor force, with 20.1% or 84 of them unemployed. The age group with the highest labor force participation rate is 35 to 44 years, with 92.2% or 297 individuals in the labor force. Within the labor force, the 35 to 44 years age range has the highest percentage of unemployed individuals, with 26.6% or 79 of them being unemployed.
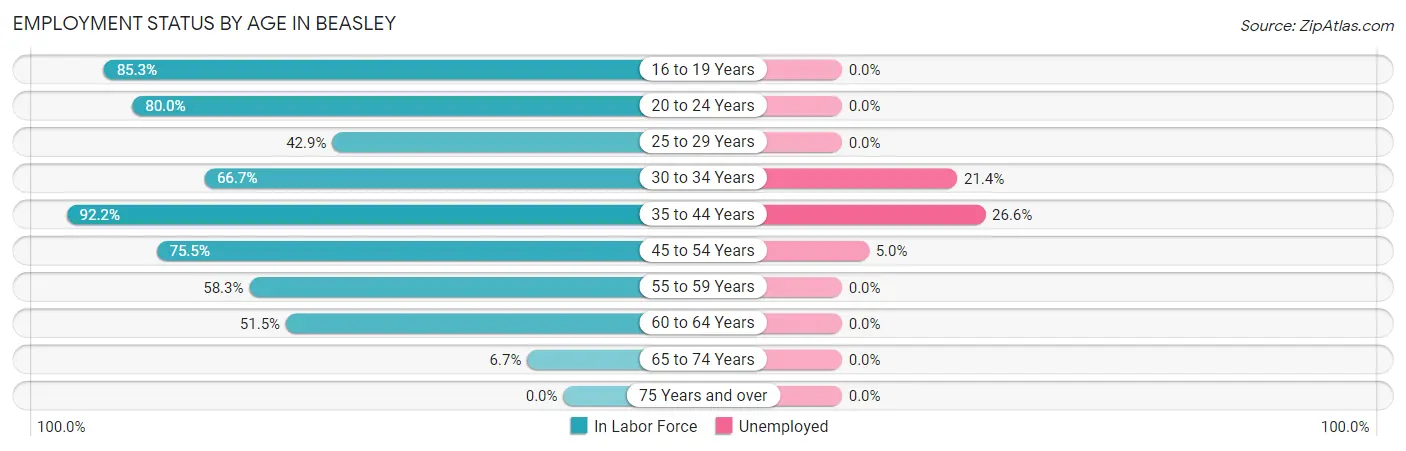
| Age Bracket | In Labor Force | Unemployed |
| 16 to 19 Years | 29 (85.3%) | 0 (0.0%) |
| 20 to 24 Years | 8 (80.0%) | 0 (0.0%) |
| 25 to 29 Years | 3 (42.9%) | 0 (0.0%) |
| 30 to 34 Years | 14 (66.7%) | 3 (21.4%) |
| 35 to 44 Years | 297 (92.2%) | 79 (26.6%) |
| 45 to 54 Years | 40 (75.5%) | 2 (5.0%) |
| 55 to 59 Years | 7 (58.3%) | 0 (0.0%) |
| 60 to 64 Years | 17 (51.5%) | 0 (0.0%) |
| 65 to 74 Years | 3 (6.7%) | 0 (0.0%) |
| 75 Years and over | 0 (0.0%) | 0 (0.0%) |
| Total | 418 (75.6%) | 84 (20.1%) |
Employment Status by Educational Attainment in Beasley
According to labor force statistics for Beasley, 84.4% of individuals (378) out of the total population between 25 and 64 years of age (448) are in the labor force, with 22.2% or 84 of them being unemployed. The group with the highest labor force participation rate are those with the educational attainment of bachelor's degree or higher, with 94.3% or 33 individuals in the labor force. Within the labor force, individuals with less than high school education have the highest percentage of unemployment, with 73.1% or 79 of them being unemployed.
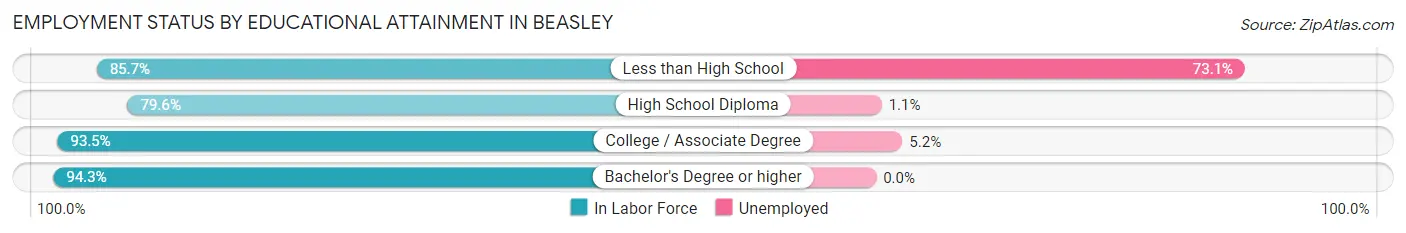
| Educational Attainment | In Labor Force | Unemployed |
| Less than High School | 108 (85.7%) | 92 (73.1%) |
| High School Diploma | 179 (79.6%) | 2 (1.1%) |
| College / Associate Degree | 58 (93.5%) | 3 (5.2%) |
| Bachelor's Degree or higher | 33 (94.3%) | 0 (0.0%) |
| Total | 378 (84.4%) | 99 (22.2%) |
Employment Occupations by Sex in Beasley
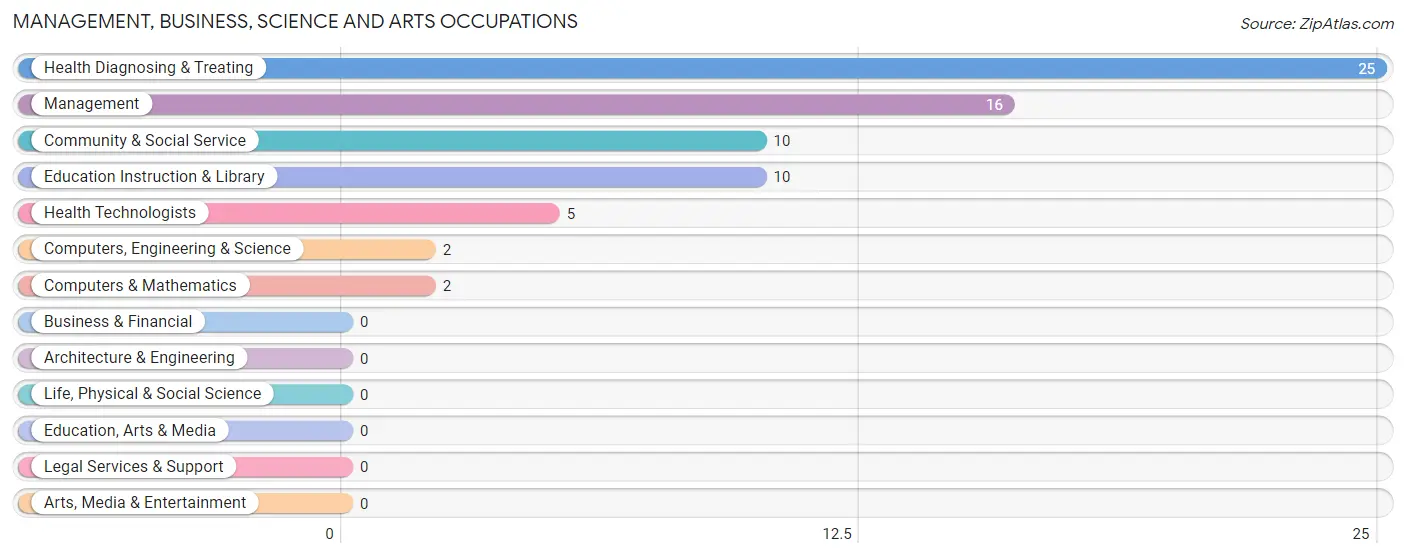
Management, Business, Science and Arts Occupations
The most common Management, Business, Science and Arts occupations in Beasley are Health Diagnosing & Treating (25 | 7.5%), Management (16 | 4.8%), Community & Social Service (10 | 3.0%), Education Instruction & Library (10 | 3.0%), and Health Technologists (5 | 1.5%).
Management, Business, Science and Arts Occupations by Sex
Within the Management, Business, Science and Arts occupations in Beasley, the most male-oriented occupations are Management (75.0%), Community & Social Service (40.0%), and Education Instruction & Library (40.0%), while the most female-oriented occupations are Computers, Engineering & Science (100.0%), Computers & Mathematics (100.0%), and Health Diagnosing & Treating (100.0%).
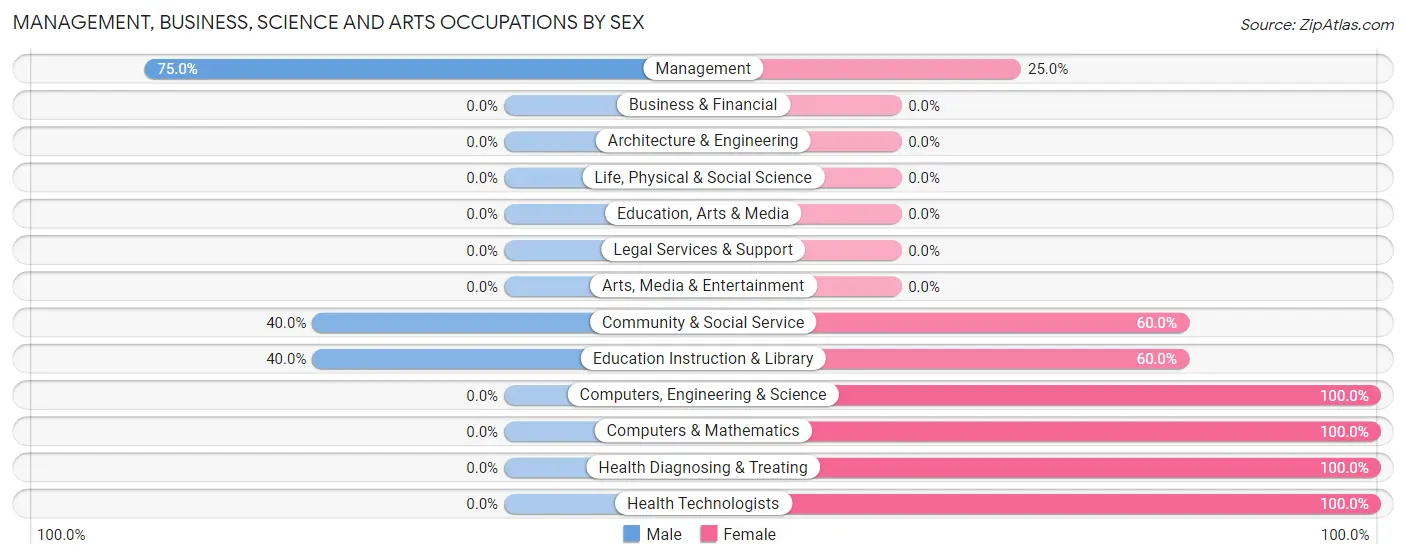
| Occupation | Male | Female |
| Management | 12 (75.0%) | 4 (25.0%) |
| Business & Financial | 0 (0.0%) | 0 (0.0%) |
| Computers, Engineering & Science | 0 (0.0%) | 2 (100.0%) |
| Computers & Mathematics | 0 (0.0%) | 2 (100.0%) |
| Architecture & Engineering | 0 (0.0%) | 0 (0.0%) |
| Life, Physical & Social Science | 0 (0.0%) | 0 (0.0%) |
| Community & Social Service | 4 (40.0%) | 6 (60.0%) |
| Education, Arts & Media | 0 (0.0%) | 0 (0.0%) |
| Legal Services & Support | 0 (0.0%) | 0 (0.0%) |
| Education Instruction & Library | 4 (40.0%) | 6 (60.0%) |
| Arts, Media & Entertainment | 0 (0.0%) | 0 (0.0%) |
| Health Diagnosing & Treating | 0 (0.0%) | 25 (100.0%) |
| Health Technologists | 0 (0.0%) | 5 (100.0%) |
| Total (Category) | 16 (30.2%) | 37 (69.8%) |
| Total (Overall) | 120 (35.9%) | 214 (64.1%) |
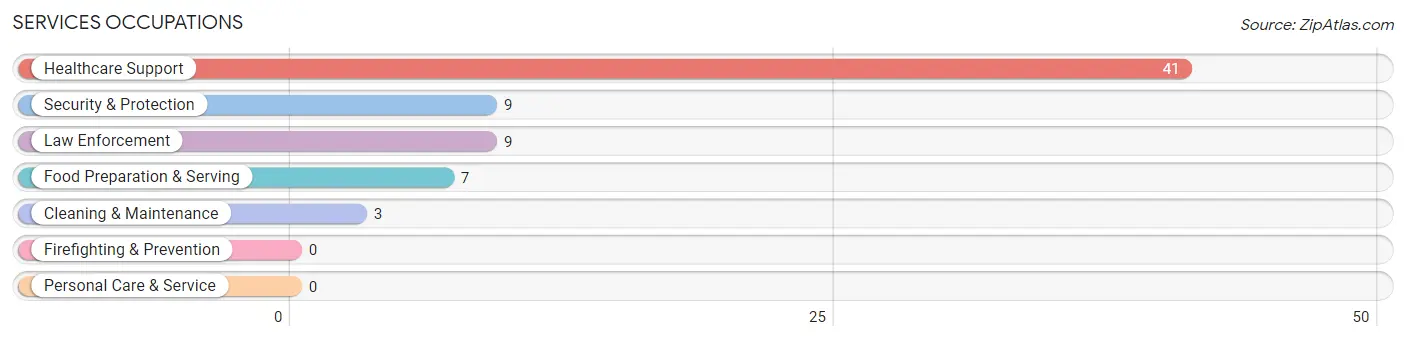
Services Occupations
The most common Services occupations in Beasley are Healthcare Support (41 | 12.3%), Security & Protection (9 | 2.7%), Law Enforcement (9 | 2.7%), Food Preparation & Serving (7 | 2.1%), and Cleaning & Maintenance (3 | 0.9%).
Services Occupations by Sex
Within the Services occupations in Beasley, the most male-oriented occupations are Security & Protection (100.0%), Law Enforcement (100.0%), and Cleaning & Maintenance (100.0%), while the most female-oriented occupations are Healthcare Support (100.0%), and Food Preparation & Serving (42.9%).
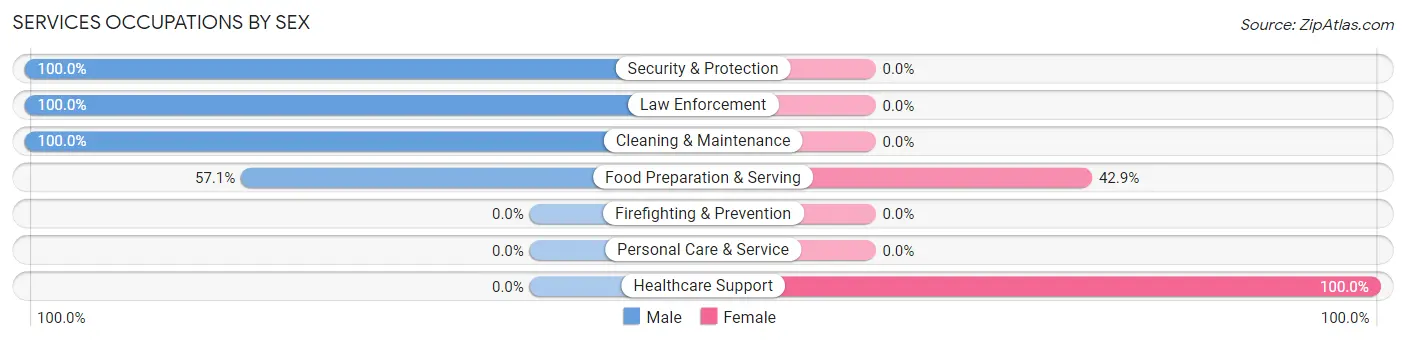
| Occupation | Male | Female |
| Healthcare Support | 0 (0.0%) | 41 (100.0%) |
| Security & Protection | 9 (100.0%) | 0 (0.0%) |
| Firefighting & Prevention | 0 (0.0%) | 0 (0.0%) |
| Law Enforcement | 9 (100.0%) | 0 (0.0%) |
| Food Preparation & Serving | 4 (57.1%) | 3 (42.9%) |
| Cleaning & Maintenance | 3 (100.0%) | 0 (0.0%) |
| Personal Care & Service | 0 (0.0%) | 0 (0.0%) |
| Total (Category) | 16 (26.7%) | 44 (73.3%) |
| Total (Overall) | 120 (35.9%) | 214 (64.1%) |
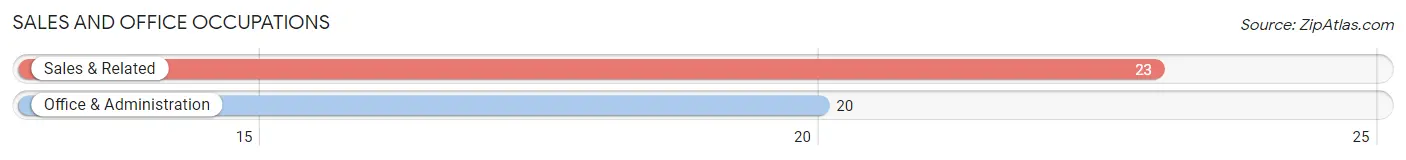
Sales and Office Occupations
The most common Sales and Office occupations in Beasley are Sales & Related (23 | 6.9%), and Office & Administration (20 | 6.0%).
Sales and Office Occupations by Sex
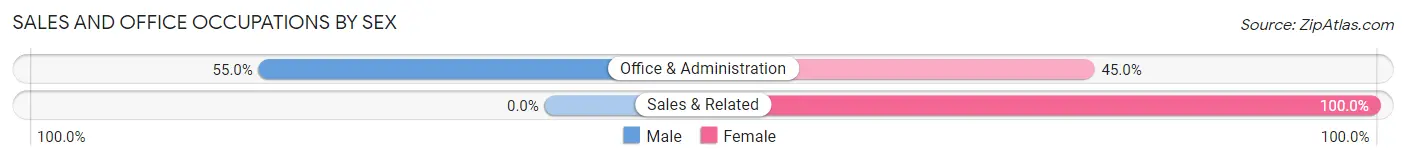
| Occupation | Male | Female |
| Sales & Related | 0 (0.0%) | 23 (100.0%) |
| Office & Administration | 11 (55.0%) | 9 (45.0%) |
| Total (Category) | 11 (25.6%) | 32 (74.4%) |
| Total (Overall) | 120 (35.9%) | 214 (64.1%) |
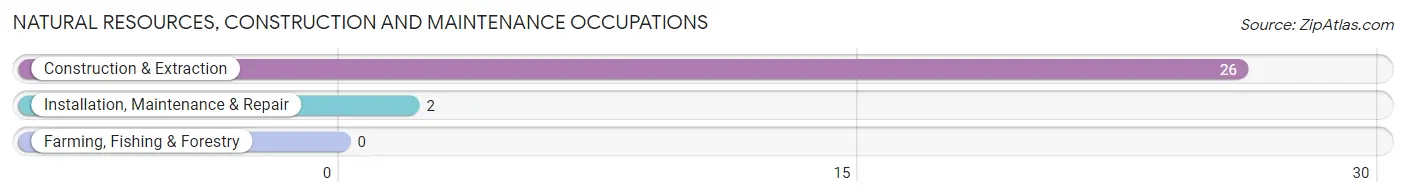
Natural Resources, Construction and Maintenance Occupations
The most common Natural Resources, Construction and Maintenance occupations in Beasley are Construction & Extraction (26 | 7.8%), and Installation, Maintenance & Repair (2 | 0.6%).
Natural Resources, Construction and Maintenance Occupations by Sex
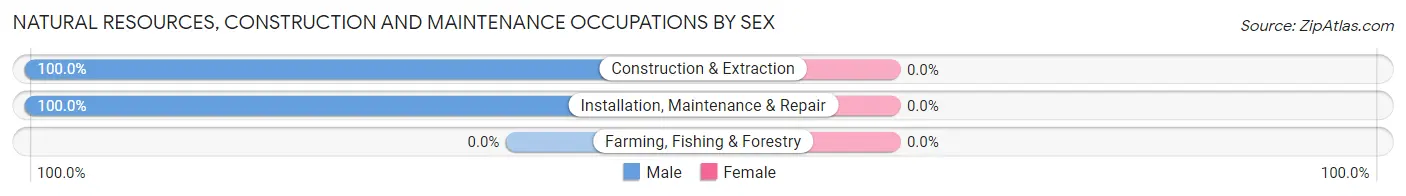
| Occupation | Male | Female |
| Farming, Fishing & Forestry | 0 (0.0%) | 0 (0.0%) |
| Construction & Extraction | 26 (100.0%) | 0 (0.0%) |
| Installation, Maintenance & Repair | 2 (100.0%) | 0 (0.0%) |
| Total (Category) | 28 (100.0%) | 0 (0.0%) |
| Total (Overall) | 120 (35.9%) | 214 (64.1%) |
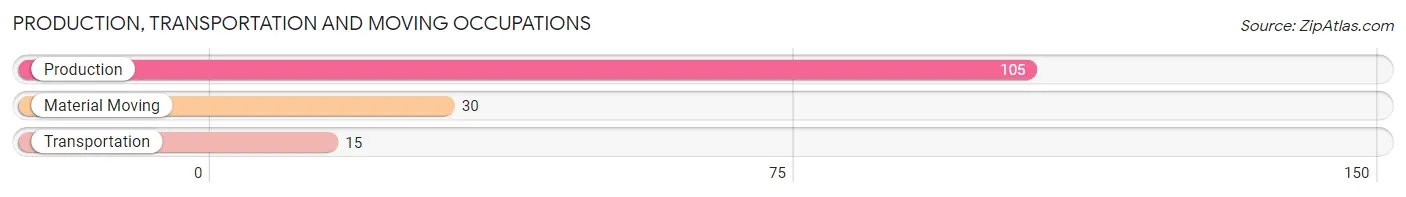
Production, Transportation and Moving Occupations
The most common Production, Transportation and Moving occupations in Beasley are Production (105 | 31.4%), Material Moving (30 | 9.0%), and Transportation (15 | 4.5%).
Production, Transportation and Moving Occupations by Sex
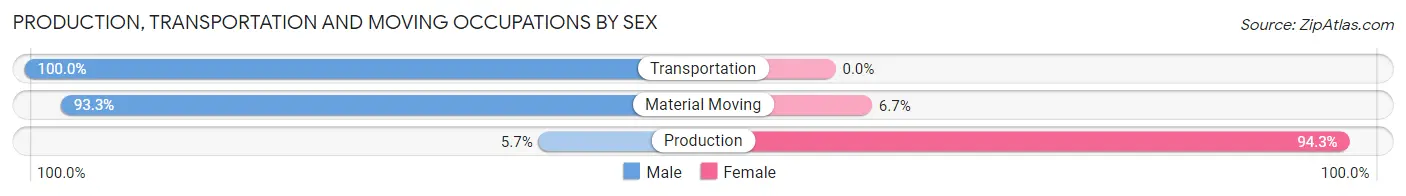
| Occupation | Male | Female |
| Production | 6 (5.7%) | 99 (94.3%) |
| Transportation | 15 (100.0%) | 0 (0.0%) |
| Material Moving | 28 (93.3%) | 2 (6.7%) |
| Total (Category) | 49 (32.7%) | 101 (67.3%) |
| Total (Overall) | 120 (35.9%) | 214 (64.1%) |
Employment Industries by Sex in Beasley
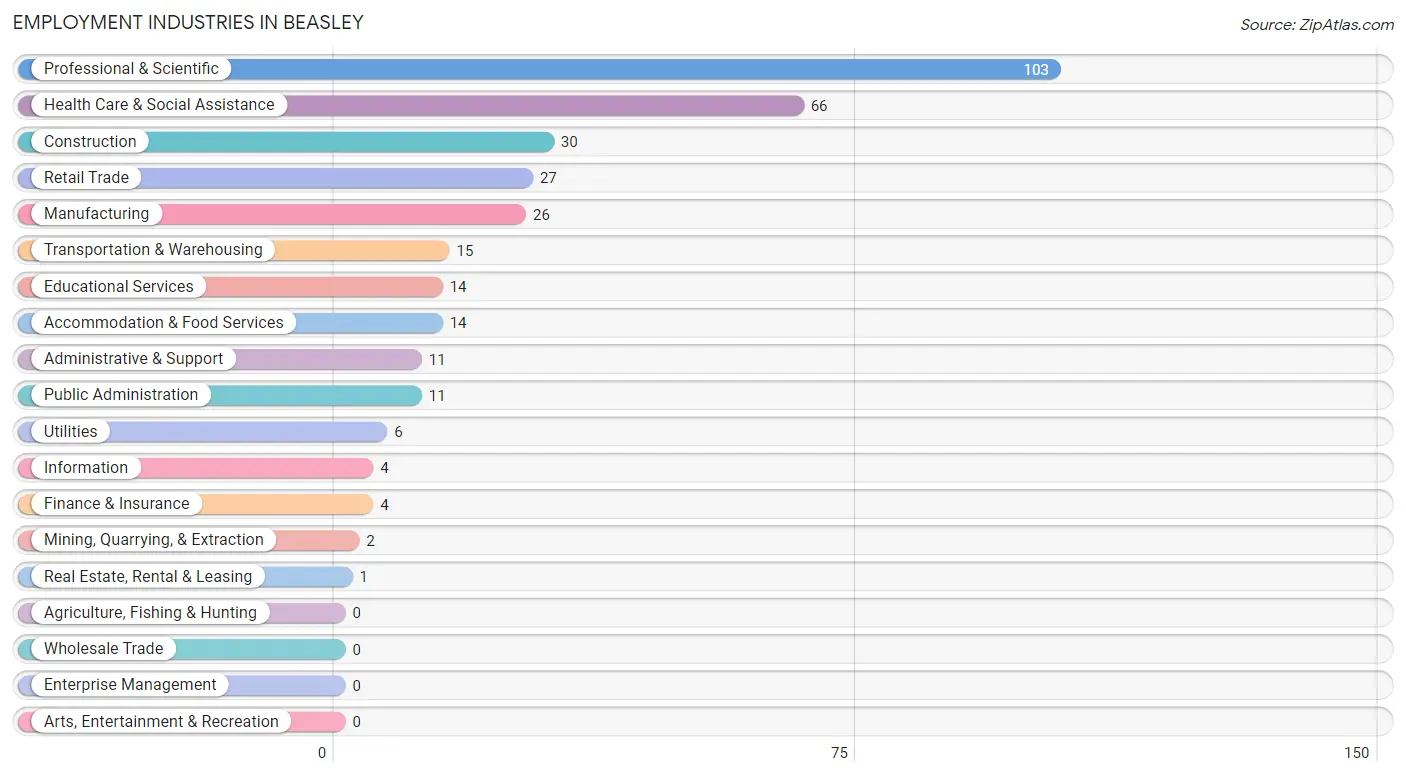
Employment Industries in Beasley
The major employment industries in Beasley include Professional & Scientific (103 | 30.8%), Health Care & Social Assistance (66 | 19.8%), Construction (30 | 9.0%), Retail Trade (27 | 8.1%), and Manufacturing (26 | 7.8%).
Employment Industries by Sex in Beasley
The Beasley industries that see more men than women are Construction (100.0%), Transportation & Warehousing (100.0%), and Utilities (100.0%), whereas the industries that tend to have a higher number of women are Mining, Quarrying, & Extraction (100.0%), Finance & Insurance (100.0%), and Real Estate, Rental & Leasing (100.0%).
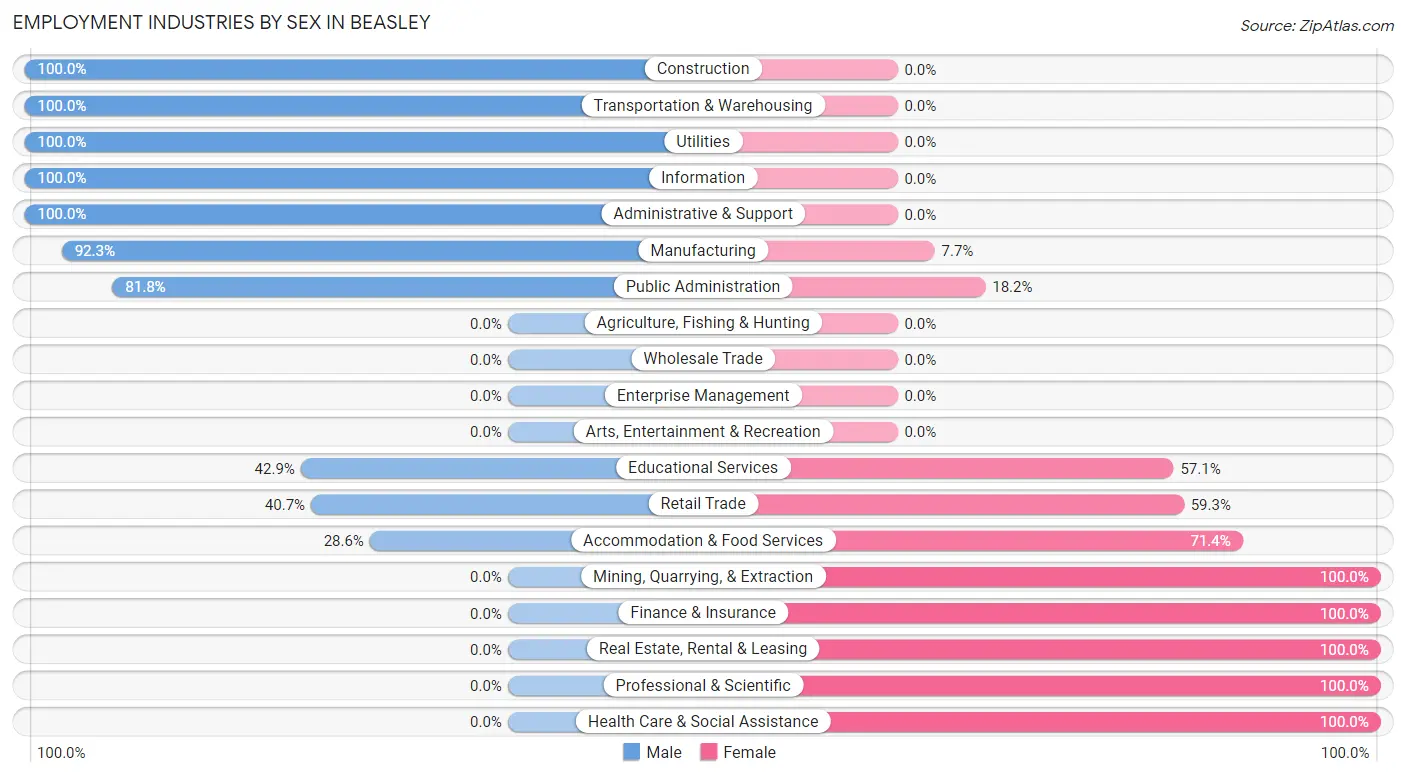
| Industry | Male | Female |
| Agriculture, Fishing & Hunting | 0 (0.0%) | 0 (0.0%) |
| Mining, Quarrying, & Extraction | 0 (0.0%) | 2 (100.0%) |
| Construction | 30 (100.0%) | 0 (0.0%) |
| Manufacturing | 24 (92.3%) | 2 (7.7%) |
| Wholesale Trade | 0 (0.0%) | 0 (0.0%) |
| Retail Trade | 11 (40.7%) | 16 (59.3%) |
| Transportation & Warehousing | 15 (100.0%) | 0 (0.0%) |
| Utilities | 6 (100.0%) | 0 (0.0%) |
| Information | 4 (100.0%) | 0 (0.0%) |
| Finance & Insurance | 0 (0.0%) | 4 (100.0%) |
| Real Estate, Rental & Leasing | 0 (0.0%) | 1 (100.0%) |
| Professional & Scientific | 0 (0.0%) | 103 (100.0%) |
| Enterprise Management | 0 (0.0%) | 0 (0.0%) |
| Administrative & Support | 11 (100.0%) | 0 (0.0%) |
| Educational Services | 6 (42.9%) | 8 (57.1%) |
| Health Care & Social Assistance | 0 (0.0%) | 66 (100.0%) |
| Arts, Entertainment & Recreation | 0 (0.0%) | 0 (0.0%) |
| Accommodation & Food Services | 4 (28.6%) | 10 (71.4%) |
| Public Administration | 9 (81.8%) | 2 (18.2%) |
| Total | 120 (35.9%) | 214 (64.1%) |
Education in Beasley
School Enrollment in Beasley
The most common levels of schooling among the 399 students in Beasley are middle school (210 | 52.6%), elementary school (89 | 22.3%), and high school (82 | 20.5%).
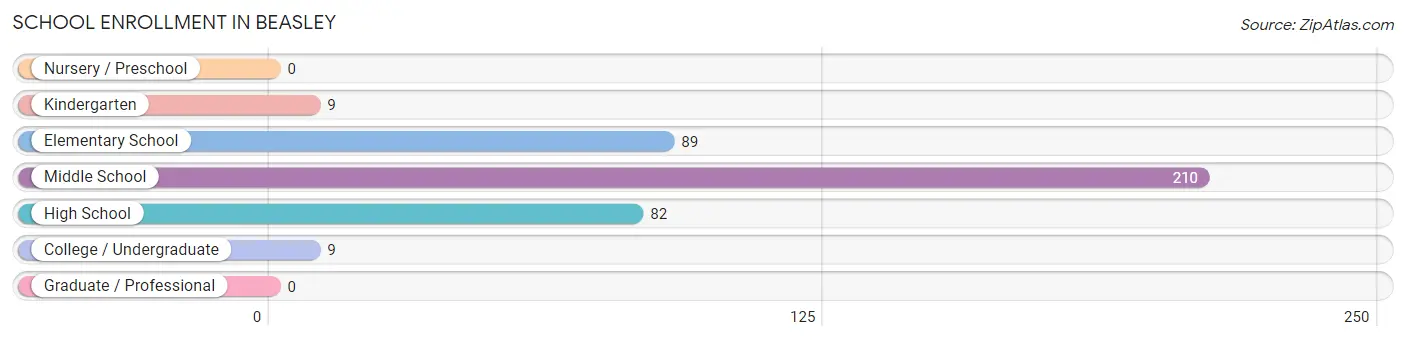
| School Level | # Students | % Students |
| Nursery / Preschool | 0 | 0.0% |
| Kindergarten | 9 | 2.3% |
| Elementary School | 89 | 22.3% |
| Middle School | 210 | 52.6% |
| High School | 82 | 20.5% |
| College / Undergraduate | 9 | 2.3% |
| Graduate / Professional | 0 | 0.0% |
| Total | 399 | 100.0% |
School Enrollment by Age by Funding Source in Beasley
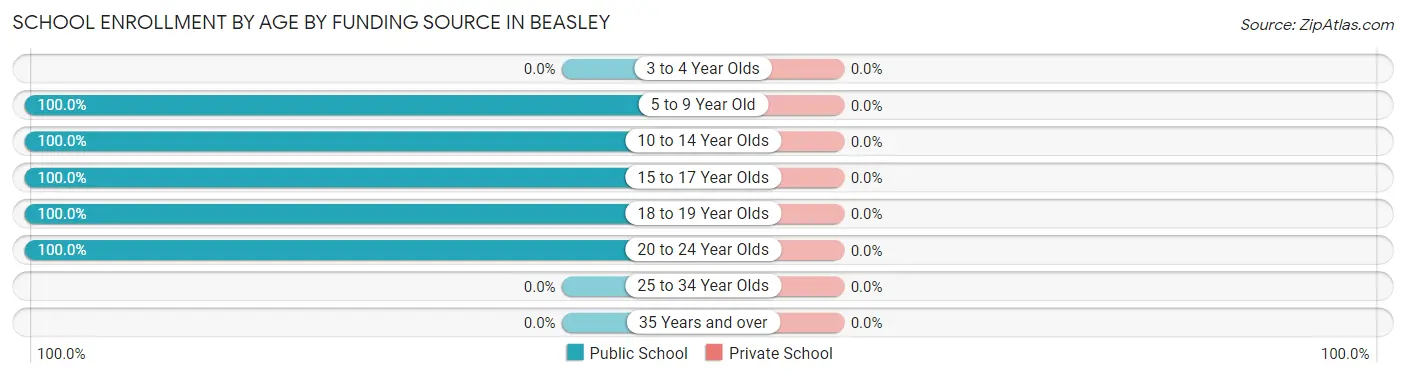
| Age Bracket | Public School | Private School |
| 3 to 4 Year Olds | 0 (0.0%) | 0 (0.0%) |
| 5 to 9 Year Old | 65 (100.0%) | 0 (0.0%) |
| 10 to 14 Year Olds | 246 (100.0%) | 0 (0.0%) |
| 15 to 17 Year Olds | 72 (100.0%) | 0 (0.0%) |
| 18 to 19 Year Olds | 14 (100.0%) | 0 (0.0%) |
| 20 to 24 Year Olds | 2 (100.0%) | 0 (0.0%) |
| 25 to 34 Year Olds | 0 (0.0%) | 0 (0.0%) |
| 35 Years and over | 0 (0.0%) | 0 (0.0%) |
| Total | 399 (100.0%) | 0 (0.0%) |
Educational Attainment by Field of Study in Beasley
Business (12 | 25.5%), education (12 | 25.5%), arts & humanities (9 | 19.2%), bio, nature & agricultural (4 | 8.5%), and social sciences (4 | 8.5%) are the most common fields of study among 47 individuals in Beasley who have obtained a bachelor's degree or higher.
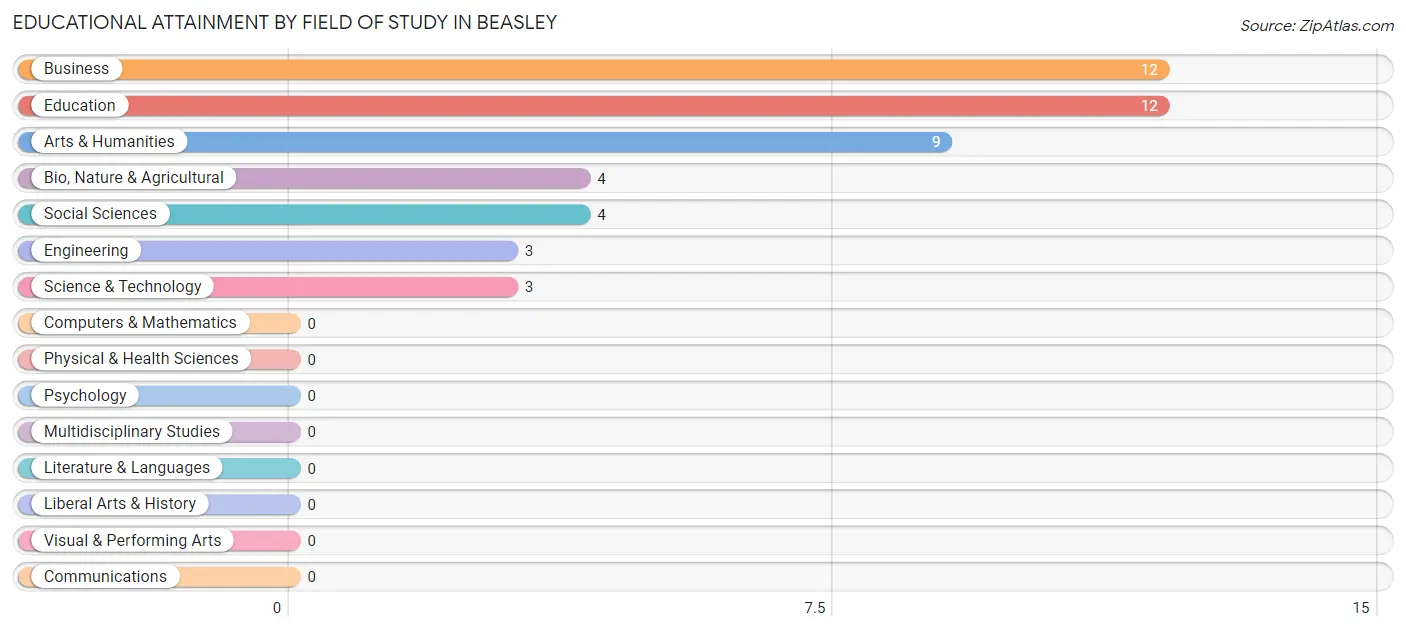
| Field of Study | # Graduates | % Graduates |
| Computers & Mathematics | 0 | 0.0% |
| Bio, Nature & Agricultural | 4 | 8.5% |
| Physical & Health Sciences | 0 | 0.0% |
| Psychology | 0 | 0.0% |
| Social Sciences | 4 | 8.5% |
| Engineering | 3 | 6.4% |
| Multidisciplinary Studies | 0 | 0.0% |
| Science & Technology | 3 | 6.4% |
| Business | 12 | 25.5% |
| Education | 12 | 25.5% |
| Literature & Languages | 0 | 0.0% |
| Liberal Arts & History | 0 | 0.0% |
| Visual & Performing Arts | 0 | 0.0% |
| Communications | 0 | 0.0% |
| Arts & Humanities | 9 | 19.2% |
| Total | 47 | 100.0% |
Transportation & Commute in Beasley
Vehicle Availability by Sex in Beasley
The most prevalent vehicle ownership categories in Beasley are males with 2 vehicles (59, accounting for 52.7%) and females with 2 vehicles (125, making up 27.6%).
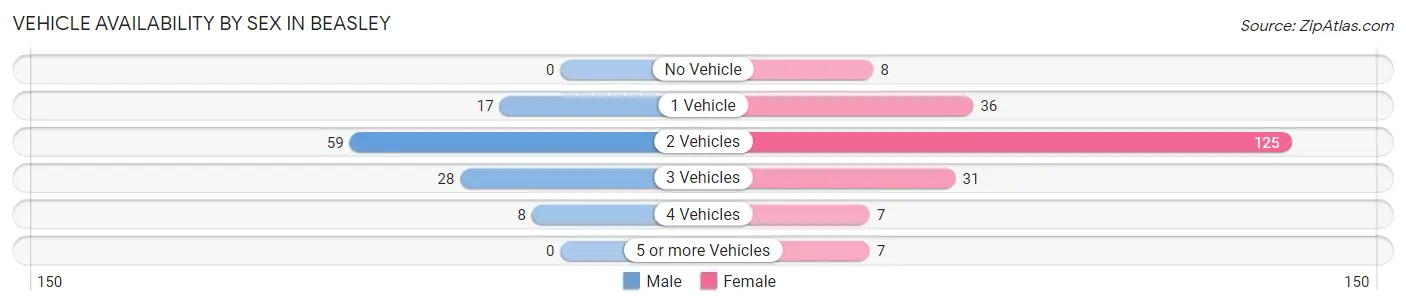
| Vehicles Available | Male | Female |
| No Vehicle | 0 (0.0%) | 8 (3.7%) |
| 1 Vehicle | 17 (15.2%) | 36 (16.8%) |
| 2 Vehicles | 59 (52.7%) | 125 (58.4%) |
| 3 Vehicles | 28 (25.0%) | 31 (14.5%) |
| 4 Vehicles | 8 (7.1%) | 7 (3.3%) |
| 5 or more Vehicles | 0 (0.0%) | 7 (3.3%) |
| Total | 112 (100.0%) | 214 (100.0%) |
Commute Time in Beasley
The most frequently occuring commute durations in Beasley are 20 to 24 minutes (195 commuters, 61.7%), 15 to 19 minutes (30 commuters, 9.5%), and 40 to 44 minutes (22 commuters, 7.0%).
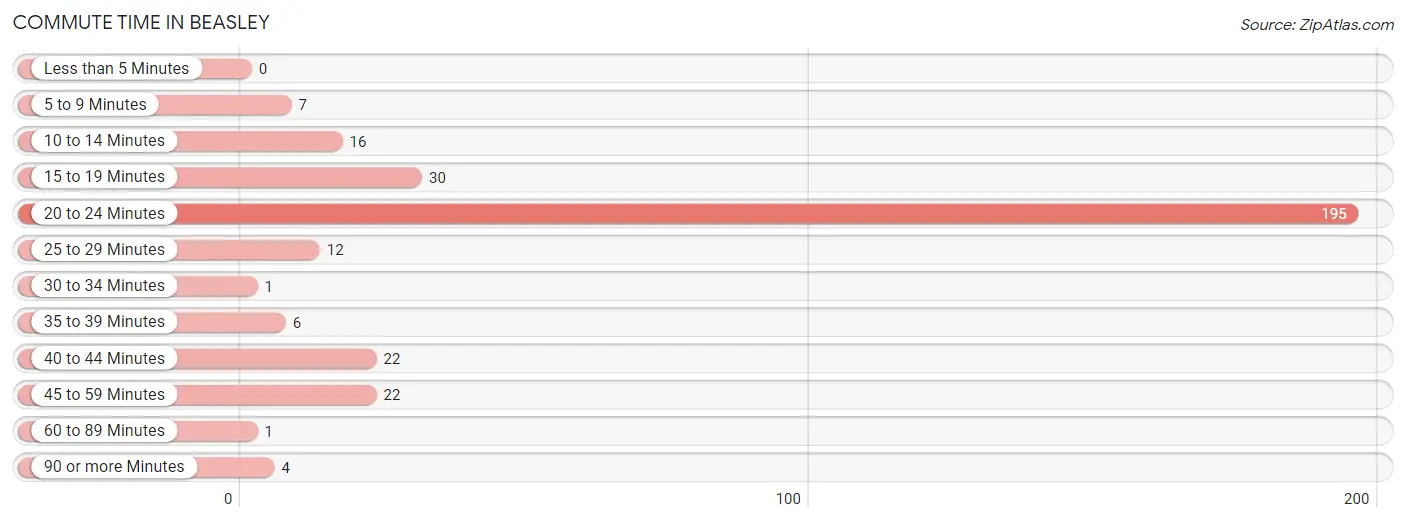
| Commute Time | # Commuters | % Commuters |
| Less than 5 Minutes | 0 | 0.0% |
| 5 to 9 Minutes | 7 | 2.2% |
| 10 to 14 Minutes | 16 | 5.1% |
| 15 to 19 Minutes | 30 | 9.5% |
| 20 to 24 Minutes | 195 | 61.7% |
| 25 to 29 Minutes | 12 | 3.8% |
| 30 to 34 Minutes | 1 | 0.3% |
| 35 to 39 Minutes | 6 | 1.9% |
| 40 to 44 Minutes | 22 | 7.0% |
| 45 to 59 Minutes | 22 | 7.0% |
| 60 to 89 Minutes | 1 | 0.3% |
| 90 or more Minutes | 4 | 1.3% |
Commute Time by Sex in Beasley
The most common commute times in Beasley are 20 to 24 minutes (51 commuters, 48.1%) for males and 20 to 24 minutes (144 commuters, 68.6%) for females.
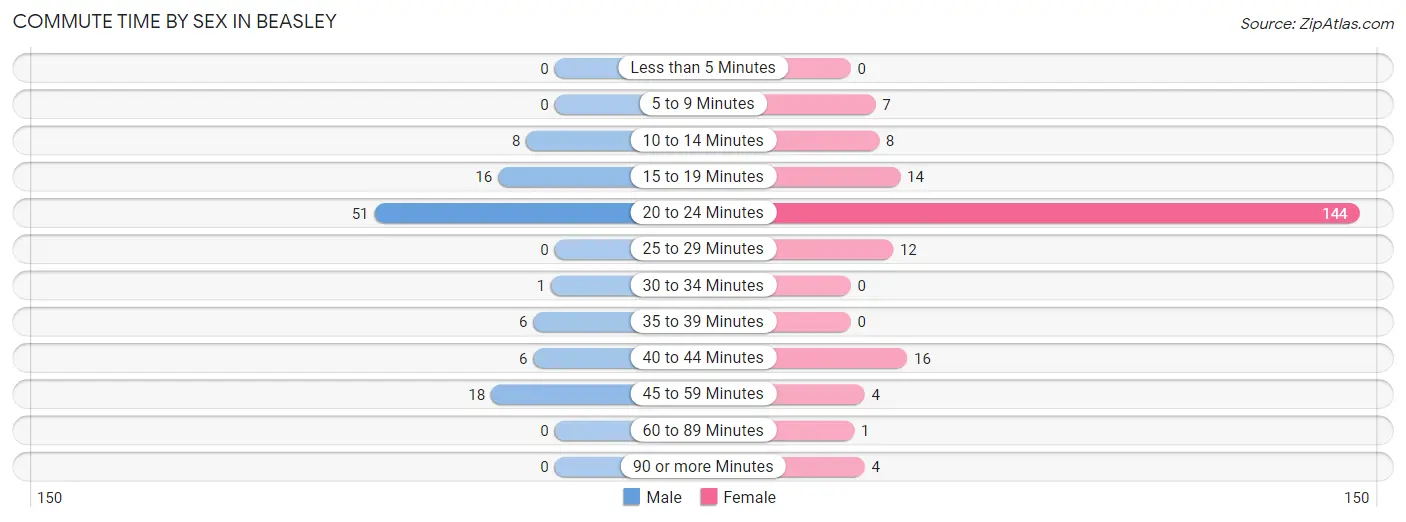
| Commute Time | Male | Female |
| Less than 5 Minutes | 0 (0.0%) | 0 (0.0%) |
| 5 to 9 Minutes | 0 (0.0%) | 7 (3.3%) |
| 10 to 14 Minutes | 8 (7.5%) | 8 (3.8%) |
| 15 to 19 Minutes | 16 (15.1%) | 14 (6.7%) |
| 20 to 24 Minutes | 51 (48.1%) | 144 (68.6%) |
| 25 to 29 Minutes | 0 (0.0%) | 12 (5.7%) |
| 30 to 34 Minutes | 1 (0.9%) | 0 (0.0%) |
| 35 to 39 Minutes | 6 (5.7%) | 0 (0.0%) |
| 40 to 44 Minutes | 6 (5.7%) | 16 (7.6%) |
| 45 to 59 Minutes | 18 (17.0%) | 4 (1.9%) |
| 60 to 89 Minutes | 0 (0.0%) | 1 (0.5%) |
| 90 or more Minutes | 0 (0.0%) | 4 (1.9%) |
Time of Departure to Work by Sex in Beasley
The most frequent times of departure to work in Beasley are 6:30 AM to 6:59 AM (25, 23.6%) for males and 12:00 AM to 4:59 AM (138, 65.7%) for females.
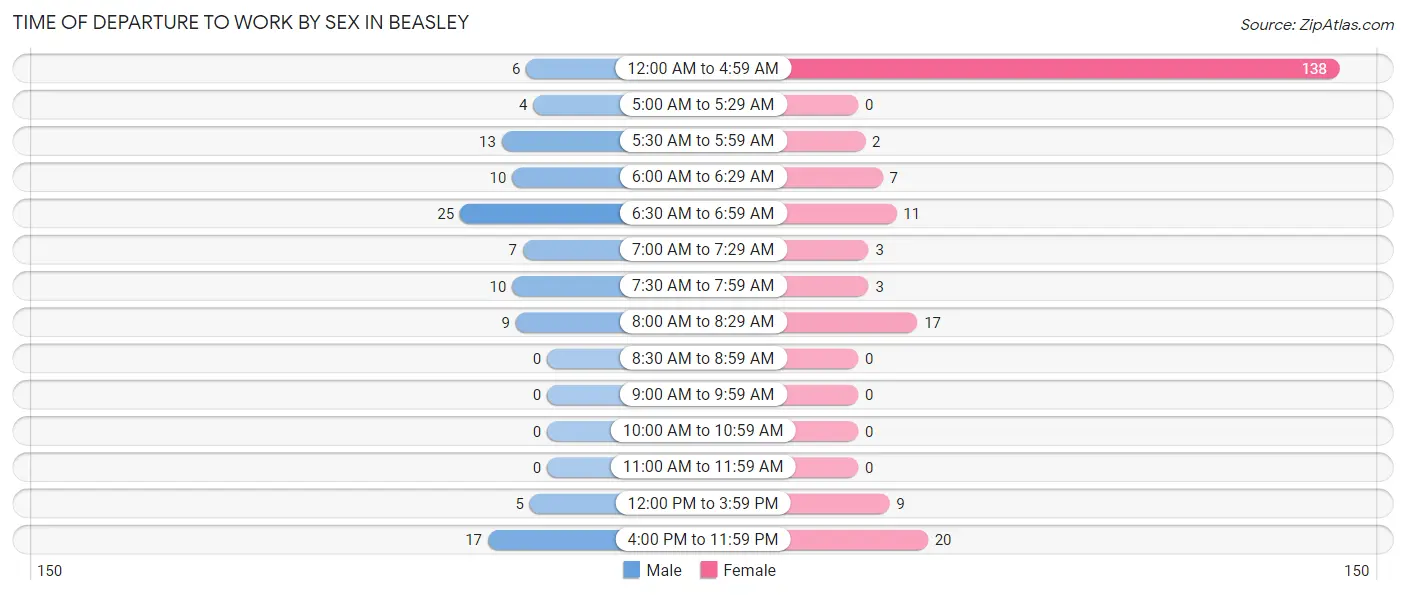
| Time of Departure | Male | Female |
| 12:00 AM to 4:59 AM | 6 (5.7%) | 138 (65.7%) |
| 5:00 AM to 5:29 AM | 4 (3.8%) | 0 (0.0%) |
| 5:30 AM to 5:59 AM | 13 (12.3%) | 2 (0.9%) |
| 6:00 AM to 6:29 AM | 10 (9.4%) | 7 (3.3%) |
| 6:30 AM to 6:59 AM | 25 (23.6%) | 11 (5.2%) |
| 7:00 AM to 7:29 AM | 7 (6.6%) | 3 (1.4%) |
| 7:30 AM to 7:59 AM | 10 (9.4%) | 3 (1.4%) |
| 8:00 AM to 8:29 AM | 9 (8.5%) | 17 (8.1%) |
| 8:30 AM to 8:59 AM | 0 (0.0%) | 0 (0.0%) |
| 9:00 AM to 9:59 AM | 0 (0.0%) | 0 (0.0%) |
| 10:00 AM to 10:59 AM | 0 (0.0%) | 0 (0.0%) |
| 11:00 AM to 11:59 AM | 0 (0.0%) | 0 (0.0%) |
| 12:00 PM to 3:59 PM | 5 (4.7%) | 9 (4.3%) |
| 4:00 PM to 11:59 PM | 17 (16.0%) | 20 (9.5%) |
| Total | 106 (100.0%) | 210 (100.0%) |
Housing Occupancy in Beasley
Occupancy by Ownership in Beasley
Of the total 271 dwellings in Beasley, owner-occupied units account for 201 (74.2%), while renter-occupied units make up 70 (25.8%).
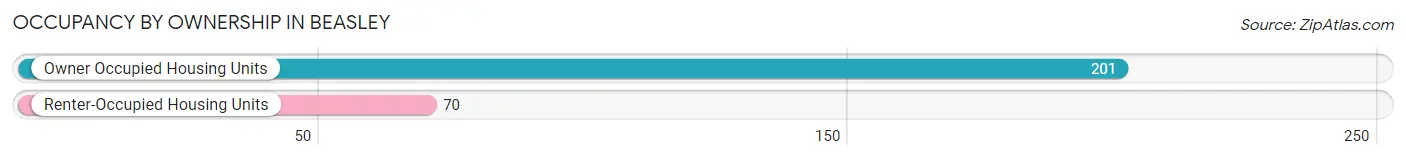
| Occupancy | # Housing Units | % Housing Units |
| Owner Occupied Housing Units | 201 | 74.2% |
| Renter-Occupied Housing Units | 70 | 25.8% |
| Total Occupied Housing Units | 271 | 100.0% |
Occupancy by Household Size in Beasley
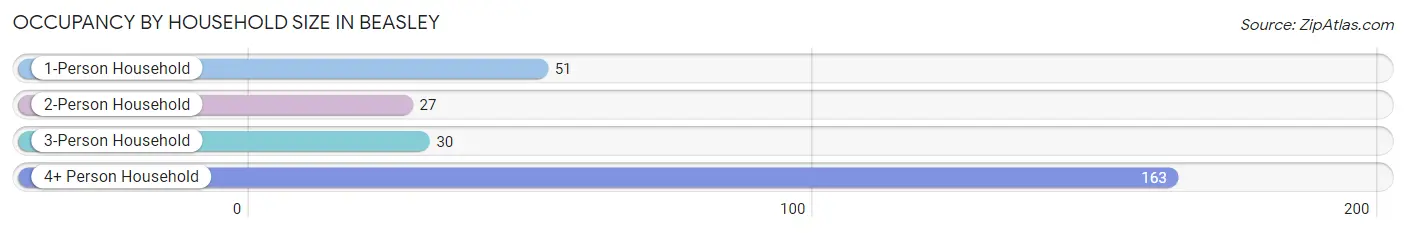
| Household Size | # Housing Units | % Housing Units |
| 1-Person Household | 51 | 18.8% |
| 2-Person Household | 27 | 10.0% |
| 3-Person Household | 30 | 11.1% |
| 4+ Person Household | 163 | 60.2% |
| Total Housing Units | 271 | 100.0% |
Occupancy by Ownership by Household Size in Beasley
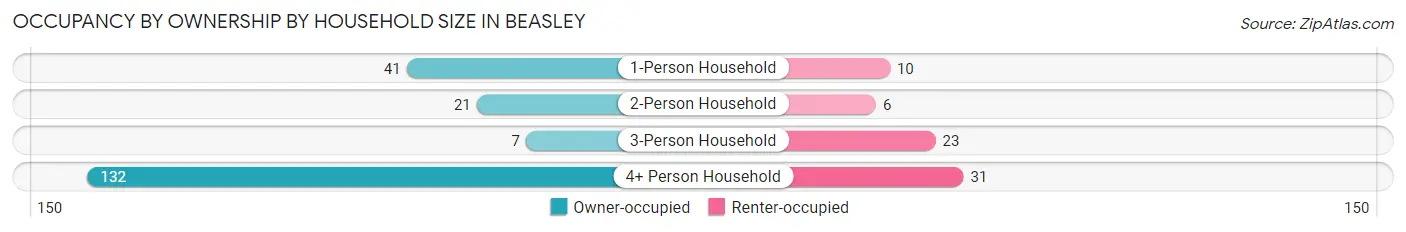
| Household Size | Owner-occupied | Renter-occupied |
| 1-Person Household | 41 (80.4%) | 10 (19.6%) |
| 2-Person Household | 21 (77.8%) | 6 (22.2%) |
| 3-Person Household | 7 (23.3%) | 23 (76.7%) |
| 4+ Person Household | 132 (81.0%) | 31 (19.0%) |
| Total Housing Units | 201 (74.2%) | 70 (25.8%) |
Occupancy by Educational Attainment in Beasley
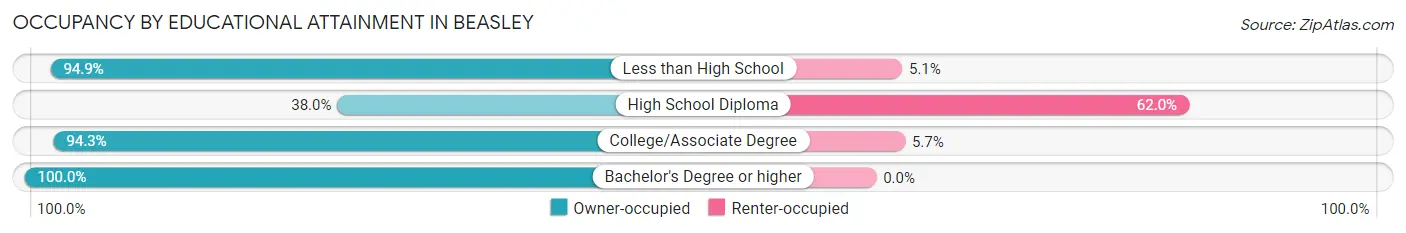
| Household Size | Owner-occupied | Renter-occupied |
| Less than High School | 111 (94.9%) | 6 (5.1%) |
| High School Diploma | 38 (38.0%) | 62 (62.0%) |
| College/Associate Degree | 33 (94.3%) | 2 (5.7%) |
| Bachelor's Degree or higher | 19 (100.0%) | 0 (0.0%) |
Occupancy by Age of Householder in Beasley
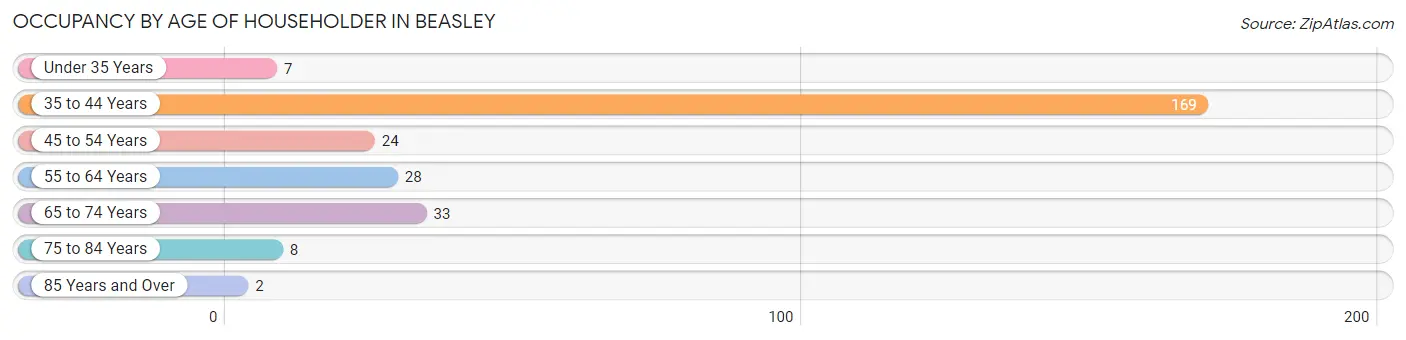
| Age Bracket | # Households | % Households |
| Under 35 Years | 7 | 2.6% |
| 35 to 44 Years | 169 | 62.4% |
| 45 to 54 Years | 24 | 8.9% |
| 55 to 64 Years | 28 | 10.3% |
| 65 to 74 Years | 33 | 12.2% |
| 75 to 84 Years | 8 | 2.9% |
| 85 Years and Over | 2 | 0.7% |
| Total | 271 | 100.0% |
Housing Finances in Beasley
Median Income by Occupancy in Beasley
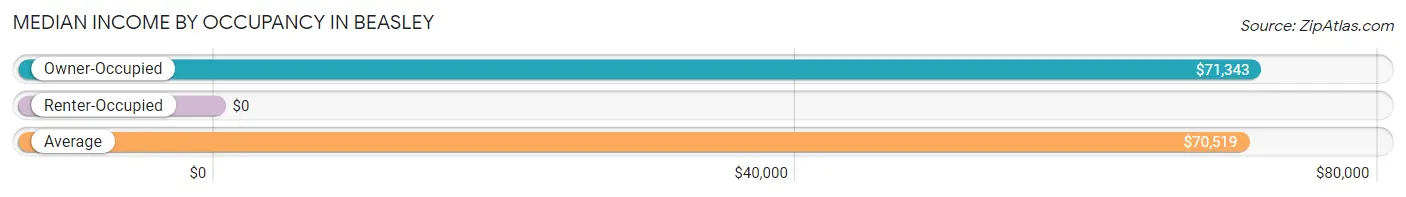
| Occupancy Type | # Households | Median Income |
| Owner-Occupied | 201 (74.2%) | $71,343 |
| Renter-Occupied | 70 (25.8%) | $0 |
| Average | 271 (100.0%) | $70,519 |
Occupancy by Householder Income Bracket in Beasley
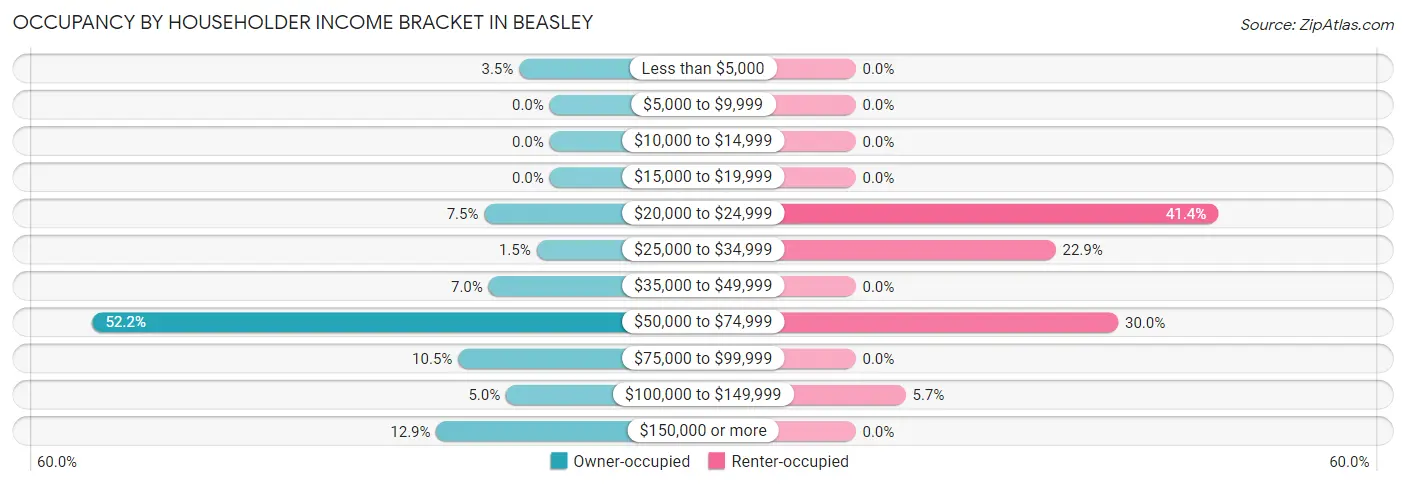
| Income Bracket | Owner-occupied | Renter-occupied |
| Less than $5,000 | 7 (3.5%) | 0 (0.0%) |
| $5,000 to $9,999 | 0 (0.0%) | 0 (0.0%) |
| $10,000 to $14,999 | 0 (0.0%) | 0 (0.0%) |
| $15,000 to $19,999 | 0 (0.0%) | 0 (0.0%) |
| $20,000 to $24,999 | 15 (7.5%) | 29 (41.4%) |
| $25,000 to $34,999 | 3 (1.5%) | 16 (22.9%) |
| $35,000 to $49,999 | 14 (7.0%) | 0 (0.0%) |
| $50,000 to $74,999 | 105 (52.2%) | 21 (30.0%) |
| $75,000 to $99,999 | 21 (10.4%) | 0 (0.0%) |
| $100,000 to $149,999 | 10 (5.0%) | 4 (5.7%) |
| $150,000 or more | 26 (12.9%) | 0 (0.0%) |
| Total | 201 (100.0%) | 70 (100.0%) |
Monthly Housing Cost Tiers in Beasley
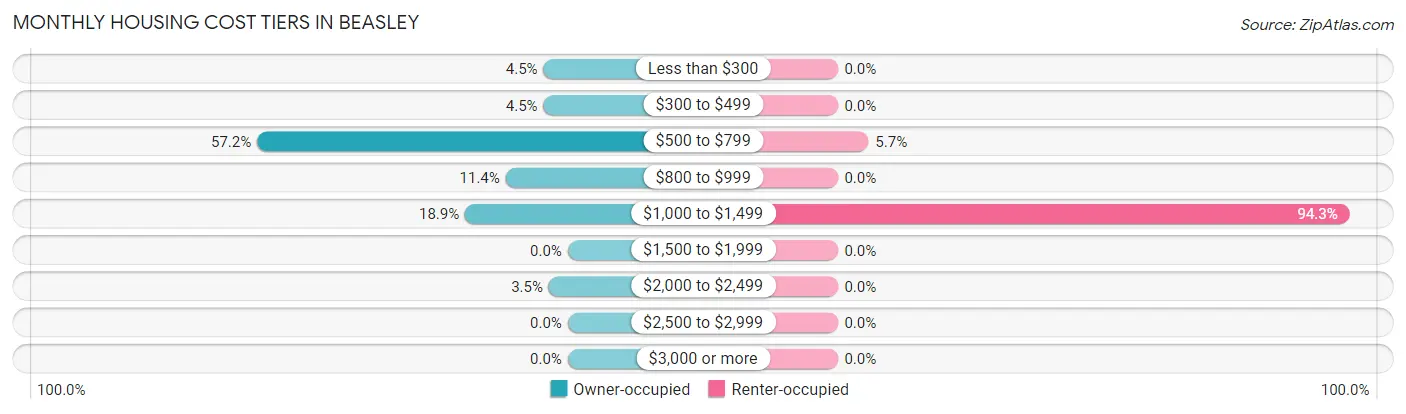
| Monthly Cost | Owner-occupied | Renter-occupied |
| Less than $300 | 9 (4.5%) | 0 (0.0%) |
| $300 to $499 | 9 (4.5%) | 0 (0.0%) |
| $500 to $799 | 115 (57.2%) | 4 (5.7%) |
| $800 to $999 | 23 (11.4%) | 0 (0.0%) |
| $1,000 to $1,499 | 38 (18.9%) | 66 (94.3%) |
| $1,500 to $1,999 | 0 (0.0%) | 0 (0.0%) |
| $2,000 to $2,499 | 7 (3.5%) | 0 (0.0%) |
| $2,500 to $2,999 | 0 (0.0%) | 0 (0.0%) |
| $3,000 or more | 0 (0.0%) | 0 (0.0%) |
| Total | 201 (100.0%) | 70 (100.0%) |
Physical Housing Characteristics in Beasley
Housing Structures in Beasley
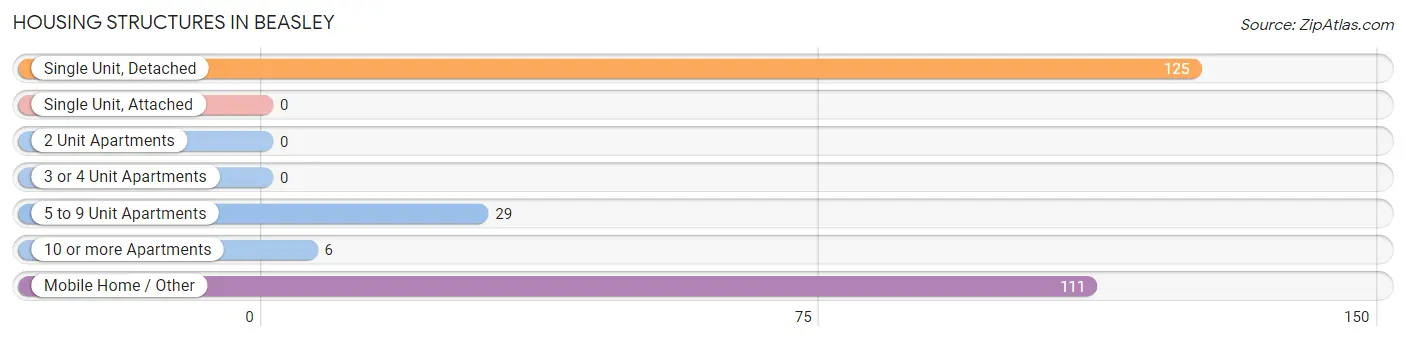
| Structure Type | # Housing Units | % Housing Units |
| Single Unit, Detached | 125 | 46.1% |
| Single Unit, Attached | 0 | 0.0% |
| 2 Unit Apartments | 0 | 0.0% |
| 3 or 4 Unit Apartments | 0 | 0.0% |
| 5 to 9 Unit Apartments | 29 | 10.7% |
| 10 or more Apartments | 6 | 2.2% |
| Mobile Home / Other | 111 | 41.0% |
| Total | 271 | 100.0% |
Housing Structures by Occupancy in Beasley
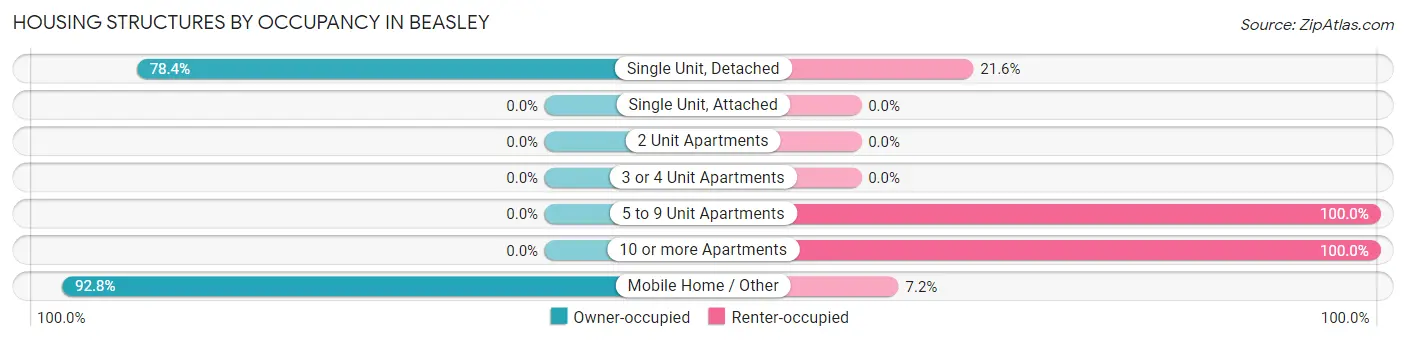
| Structure Type | Owner-occupied | Renter-occupied |
| Single Unit, Detached | 98 (78.4%) | 27 (21.6%) |
| Single Unit, Attached | 0 (0.0%) | 0 (0.0%) |
| 2 Unit Apartments | 0 (0.0%) | 0 (0.0%) |
| 3 or 4 Unit Apartments | 0 (0.0%) | 0 (0.0%) |
| 5 to 9 Unit Apartments | 0 (0.0%) | 29 (100.0%) |
| 10 or more Apartments | 0 (0.0%) | 6 (100.0%) |
| Mobile Home / Other | 103 (92.8%) | 8 (7.2%) |
| Total | 201 (74.2%) | 70 (25.8%) |
Housing Structures by Number of Rooms in Beasley
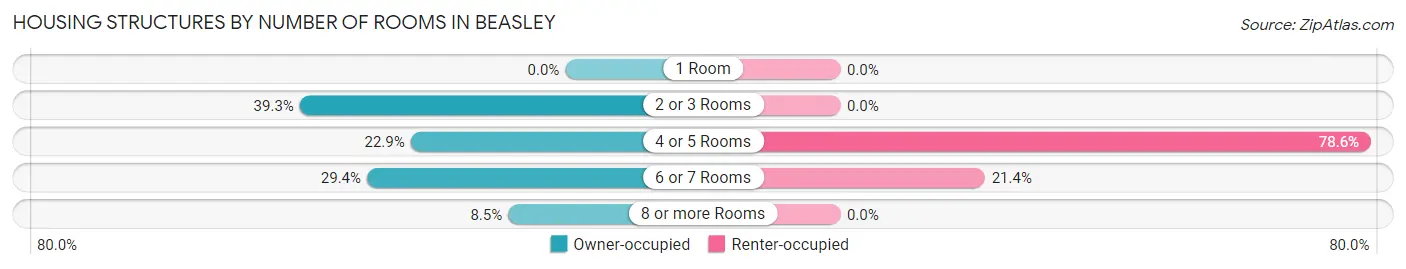
| Number of Rooms | Owner-occupied | Renter-occupied |
| 1 Room | 0 (0.0%) | 0 (0.0%) |
| 2 or 3 Rooms | 79 (39.3%) | 0 (0.0%) |
| 4 or 5 Rooms | 46 (22.9%) | 55 (78.6%) |
| 6 or 7 Rooms | 59 (29.3%) | 15 (21.4%) |
| 8 or more Rooms | 17 (8.5%) | 0 (0.0%) |
| Total | 201 (100.0%) | 70 (100.0%) |
Housing Structure by Heating Type in Beasley
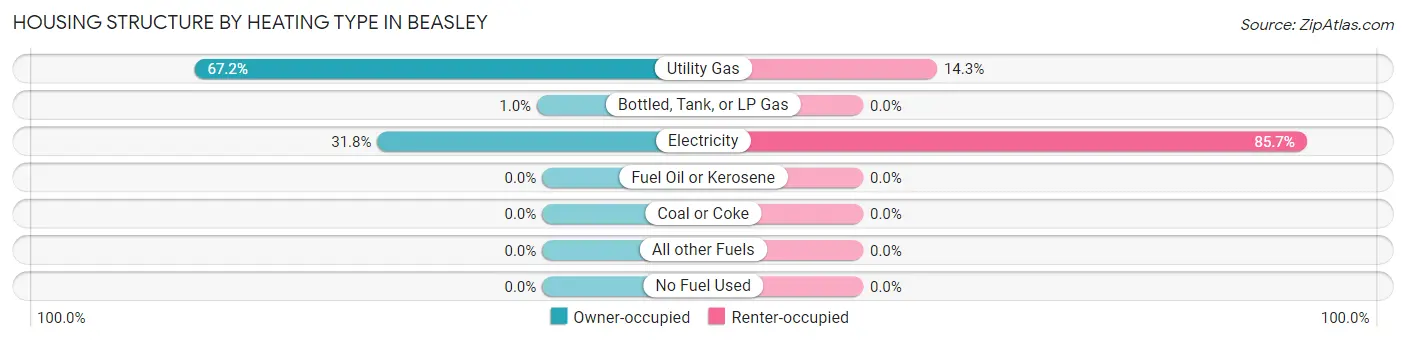
| Heating Type | Owner-occupied | Renter-occupied |
| Utility Gas | 135 (67.2%) | 10 (14.3%) |
| Bottled, Tank, or LP Gas | 2 (1.0%) | 0 (0.0%) |
| Electricity | 64 (31.8%) | 60 (85.7%) |
| Fuel Oil or Kerosene | 0 (0.0%) | 0 (0.0%) |
| Coal or Coke | 0 (0.0%) | 0 (0.0%) |
| All other Fuels | 0 (0.0%) | 0 (0.0%) |
| No Fuel Used | 0 (0.0%) | 0 (0.0%) |
| Total | 201 (100.0%) | 70 (100.0%) |
Household Vehicle Usage in Beasley
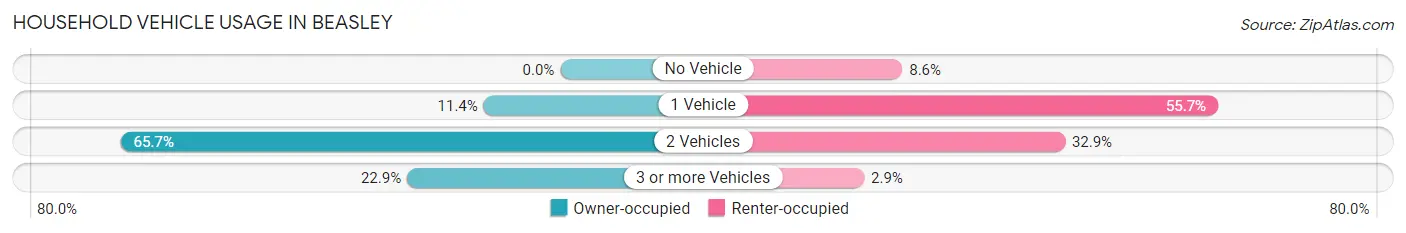
| Vehicles per Household | Owner-occupied | Renter-occupied |
| No Vehicle | 0 (0.0%) | 6 (8.6%) |
| 1 Vehicle | 23 (11.4%) | 39 (55.7%) |
| 2 Vehicles | 132 (65.7%) | 23 (32.9%) |
| 3 or more Vehicles | 46 (22.9%) | 2 (2.9%) |
| Total | 201 (100.0%) | 70 (100.0%) |
Real Estate & Mortgages in Beasley
Real Estate and Mortgage Overview in Beasley
| Characteristic | Without Mortgage | With Mortgage |
| Housing Units | 124 | 77 |
| Median Property Value | $13,500 | $116,200 |
| Median Household Income | $71,677 | $18 |
| Monthly Housing Costs | $546 | $0 |
| Real Estate Taxes | $367 | $0 |
Property Value by Mortgage Status in Beasley
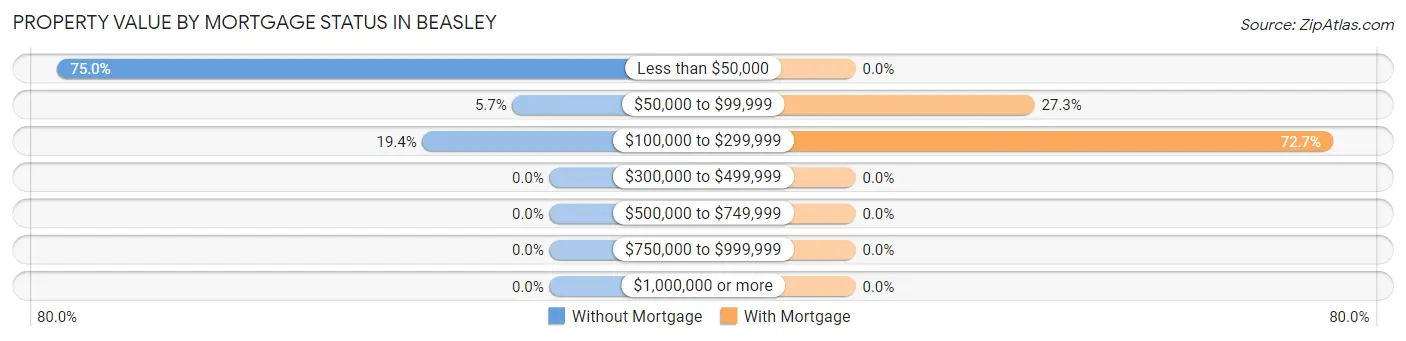
| Property Value | Without Mortgage | With Mortgage |
| Less than $50,000 | 93 (75.0%) | 0 (0.0%) |
| $50,000 to $99,999 | 7 (5.7%) | 21 (27.3%) |
| $100,000 to $299,999 | 24 (19.4%) | 56 (72.7%) |
| $300,000 to $499,999 | 0 (0.0%) | 0 (0.0%) |
| $500,000 to $749,999 | 0 (0.0%) | 0 (0.0%) |
| $750,000 to $999,999 | 0 (0.0%) | 0 (0.0%) |
| $1,000,000 or more | 0 (0.0%) | 0 (0.0%) |
| Total | 124 (100.0%) | 77 (100.0%) |
Household Income by Mortgage Status in Beasley
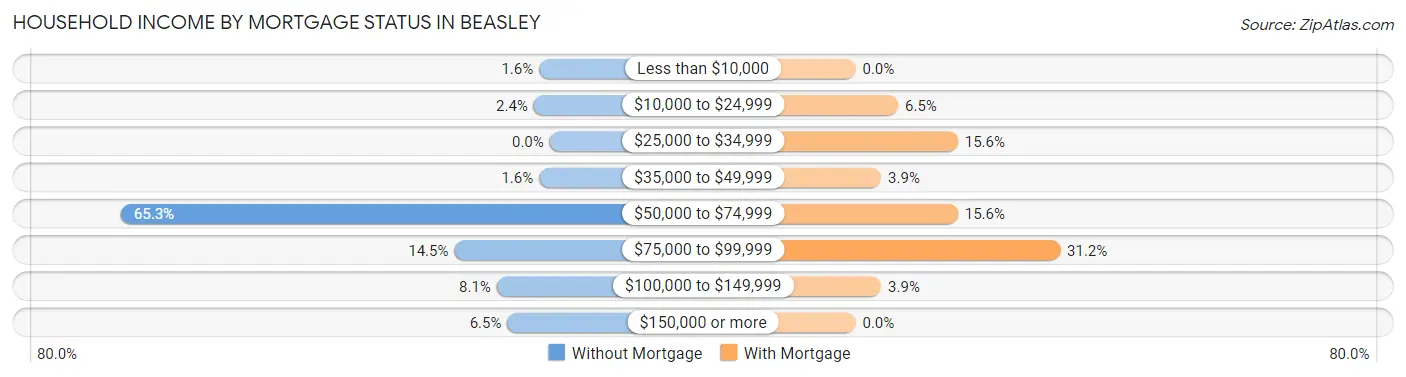
| Household Income | Without Mortgage | With Mortgage |
| Less than $10,000 | 2 (1.6%) | 0 (0.0%) |
| $10,000 to $24,999 | 3 (2.4%) | 5 (6.5%) |
| $25,000 to $34,999 | 0 (0.0%) | 12 (15.6%) |
| $35,000 to $49,999 | 2 (1.6%) | 3 (3.9%) |
| $50,000 to $74,999 | 81 (65.3%) | 12 (15.6%) |
| $75,000 to $99,999 | 18 (14.5%) | 24 (31.2%) |
| $100,000 to $149,999 | 10 (8.1%) | 3 (3.9%) |
| $150,000 or more | 8 (6.5%) | 0 (0.0%) |
| Total | 124 (100.0%) | 77 (100.0%) |
Property Value to Household Income Ratio in Beasley
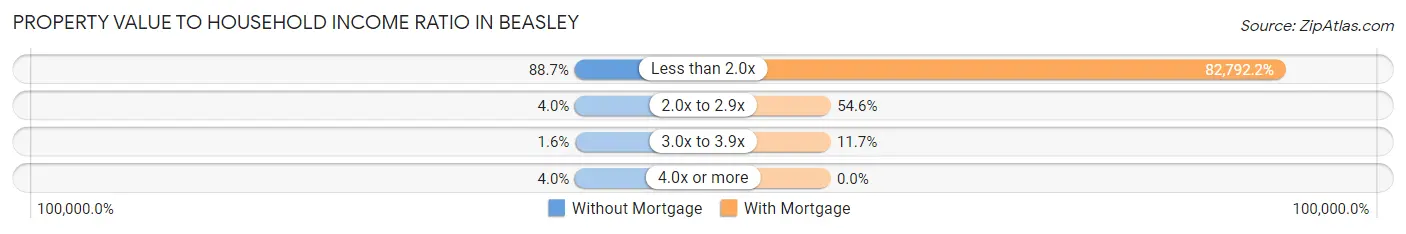
| Value-to-Income Ratio | Without Mortgage | With Mortgage |
| Less than 2.0x | 110 (88.7%) | 63,750 (82,792.2%) |
| 2.0x to 2.9x | 5 (4.0%) | 42 (54.5%) |
| 3.0x to 3.9x | 2 (1.6%) | 9 (11.7%) |
| 4.0x or more | 5 (4.0%) | 0 (0.0%) |
| Total | 124 (100.0%) | 77 (100.0%) |
Real Estate Taxes by Mortgage Status in Beasley
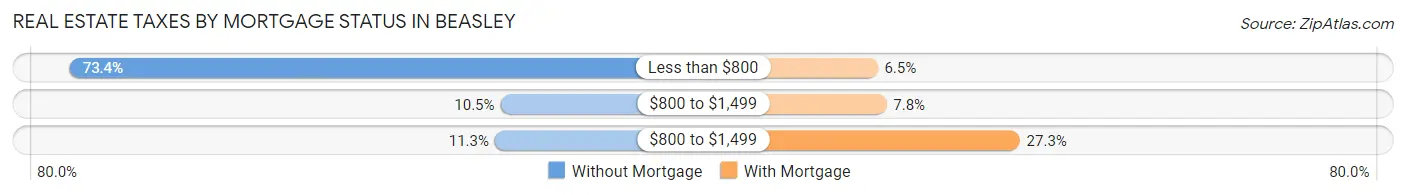
| Property Taxes | Without Mortgage | With Mortgage |
| Less than $800 | 91 (73.4%) | 5 (6.5%) |
| $800 to $1,499 | 13 (10.5%) | 6 (7.8%) |
| $800 to $1,499 | 14 (11.3%) | 21 (27.3%) |
| Total | 124 (100.0%) | 77 (100.0%) |
Health & Disability in Beasley
Health Insurance Coverage by Age in Beasley
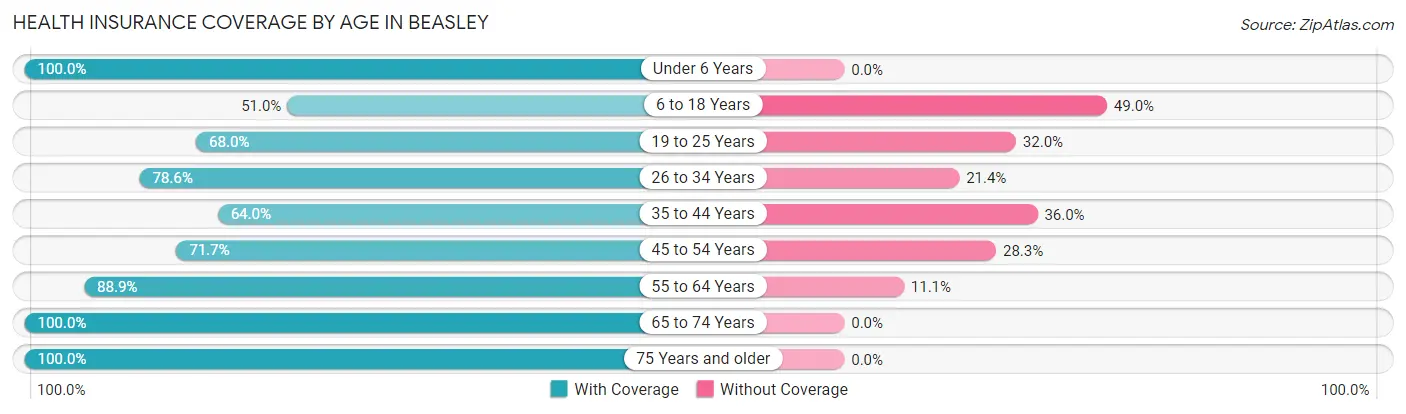
| Age Bracket | With Coverage | Without Coverage |
| Under 6 Years | 60 (100.0%) | 0 (0.0%) |
| 6 to 18 Years | 199 (51.0%) | 191 (49.0%) |
| 19 to 25 Years | 17 (68.0%) | 8 (32.0%) |
| 26 to 34 Years | 22 (78.6%) | 6 (21.4%) |
| 35 to 44 Years | 206 (64.0%) | 116 (36.0%) |
| 45 to 54 Years | 38 (71.7%) | 15 (28.3%) |
| 55 to 64 Years | 40 (88.9%) | 5 (11.1%) |
| 65 to 74 Years | 45 (100.0%) | 0 (0.0%) |
| 75 Years and older | 16 (100.0%) | 0 (0.0%) |
| Total | 643 (65.3%) | 341 (34.6%) |
Health Insurance Coverage by Citizenship Status in Beasley
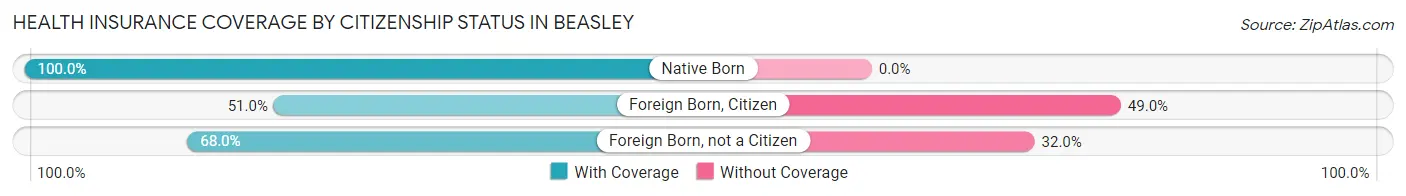
| Citizenship Status | With Coverage | Without Coverage |
| Native Born | 60 (100.0%) | 0 (0.0%) |
| Foreign Born, Citizen | 199 (51.0%) | 191 (49.0%) |
| Foreign Born, not a Citizen | 17 (68.0%) | 8 (32.0%) |
Health Insurance Coverage by Household Income in Beasley
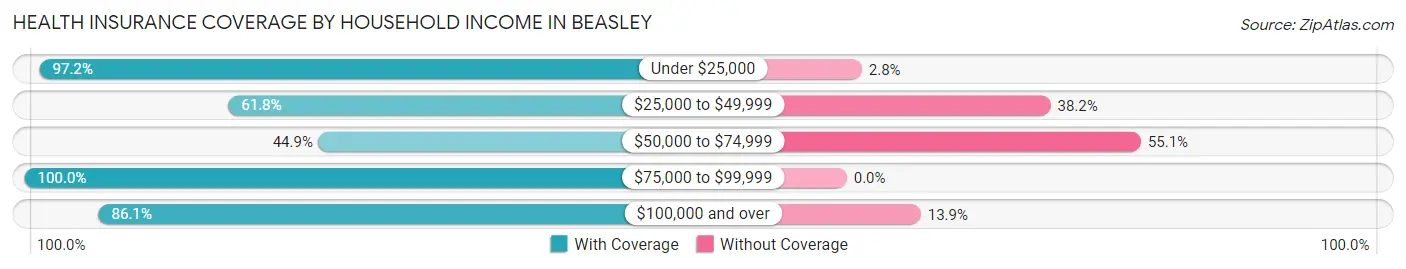
| Household Income | With Coverage | Without Coverage |
| Under $25,000 | 172 (97.2%) | 5 (2.8%) |
| $25,000 to $49,999 | 34 (61.8%) | 21 (38.2%) |
| $50,000 to $74,999 | 237 (44.9%) | 291 (55.1%) |
| $75,000 to $99,999 | 51 (100.0%) | 0 (0.0%) |
| $100,000 and over | 149 (86.1%) | 24 (13.9%) |
Public vs Private Health Insurance Coverage by Age in Beasley
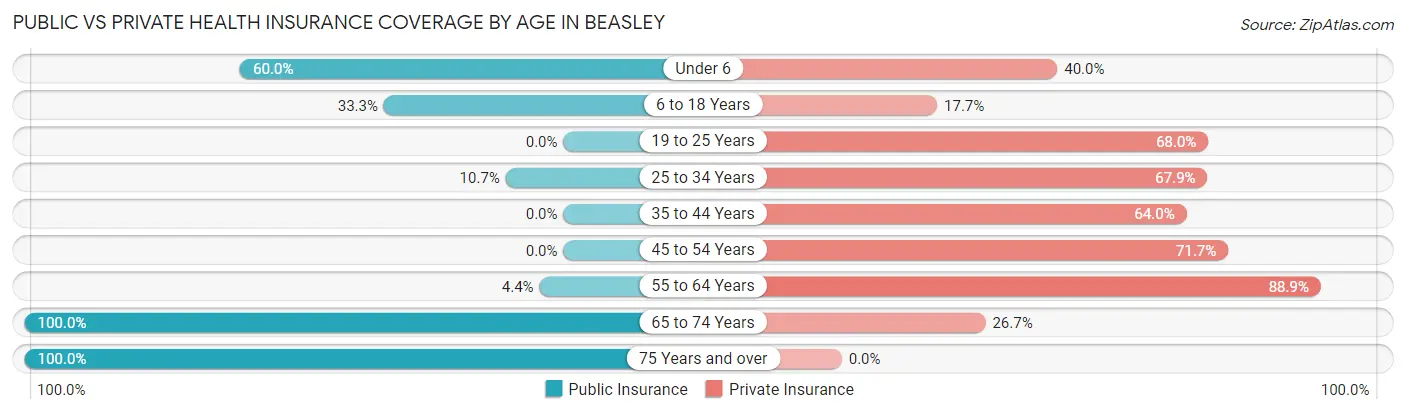
| Age Bracket | Public Insurance | Private Insurance |
| Under 6 | 36 (60.0%) | 24 (40.0%) |
| 6 to 18 Years | 130 (33.3%) | 69 (17.7%) |
| 19 to 25 Years | 0 (0.0%) | 17 (68.0%) |
| 25 to 34 Years | 3 (10.7%) | 19 (67.9%) |
| 35 to 44 Years | 0 (0.0%) | 206 (64.0%) |
| 45 to 54 Years | 0 (0.0%) | 38 (71.7%) |
| 55 to 64 Years | 2 (4.4%) | 40 (88.9%) |
| 65 to 74 Years | 45 (100.0%) | 12 (26.7%) |
| 75 Years and over | 16 (100.0%) | 0 (0.0%) |
| Total | 232 (23.6%) | 425 (43.2%) |
Disability Status by Sex by Age in Beasley
| Age Bracket | Male | Female |
| Under 5 Years | 0 (0.0%) | 0 (0.0%) |
| 5 to 17 Years | 0 (0.0%) | 0 (0.0%) |
| 18 to 34 Years | 7 (22.6%) | 0 (0.0%) |
| 35 to 64 Years | 9 (4.4%) | 19 (8.8%) |
| 65 to 74 Years | 0 (0.0%) | 12 (37.5%) |
| 75 Years and over | 0 (0.0%) | 14 (100.0%) |
Disability Class by Sex by Age in Beasley
Disability Class: Hearing Difficulty
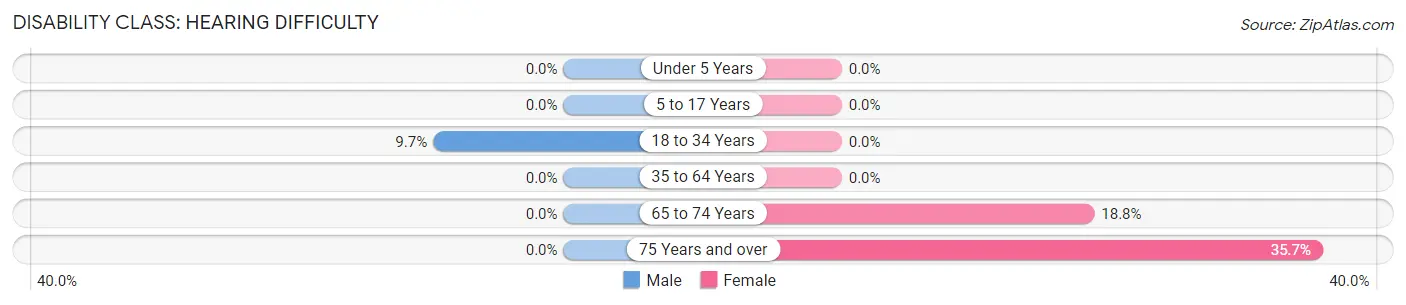
| Age Bracket | Male | Female |
| Under 5 Years | 0 (0.0%) | 0 (0.0%) |
| 5 to 17 Years | 0 (0.0%) | 0 (0.0%) |
| 18 to 34 Years | 3 (9.7%) | 0 (0.0%) |
| 35 to 64 Years | 0 (0.0%) | 0 (0.0%) |
| 65 to 74 Years | 0 (0.0%) | 6 (18.8%) |
| 75 Years and over | 0 (0.0%) | 5 (35.7%) |
Disability Class: Vision Difficulty
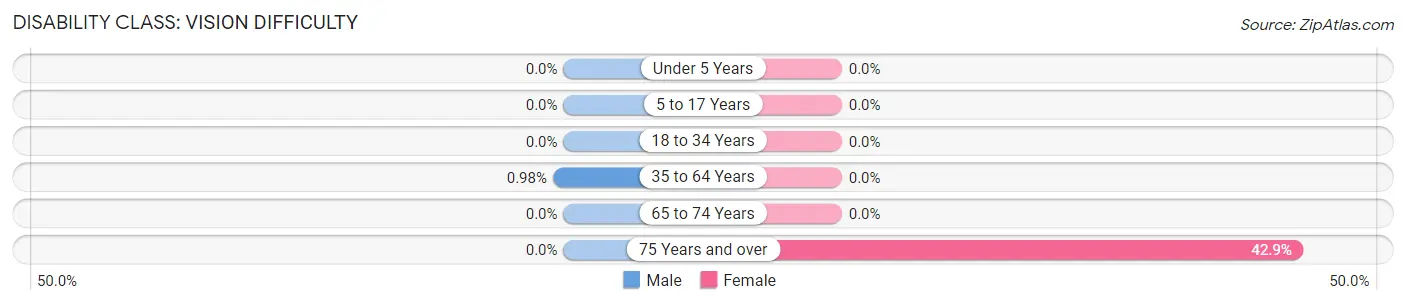
| Age Bracket | Male | Female |
| Under 5 Years | 0 (0.0%) | 0 (0.0%) |
| 5 to 17 Years | 0 (0.0%) | 0 (0.0%) |
| 18 to 34 Years | 0 (0.0%) | 0 (0.0%) |
| 35 to 64 Years | 2 (1.0%) | 0 (0.0%) |
| 65 to 74 Years | 0 (0.0%) | 0 (0.0%) |
| 75 Years and over | 0 (0.0%) | 6 (42.9%) |
Disability Class: Cognitive Difficulty
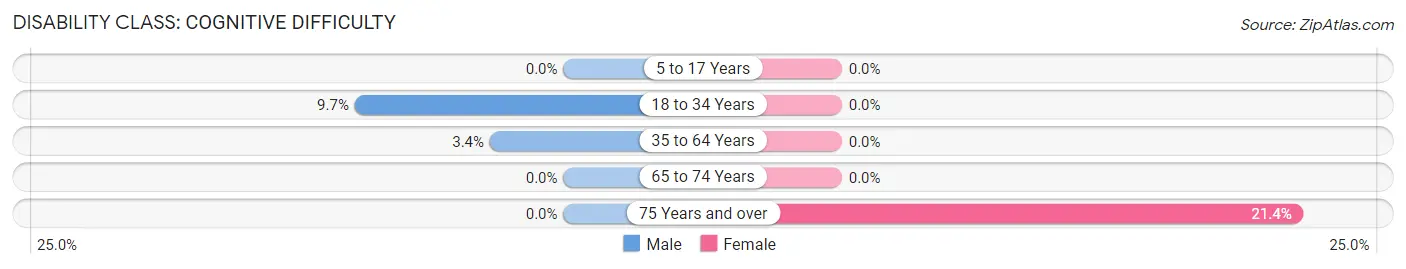
| Age Bracket | Male | Female |
| 5 to 17 Years | 0 (0.0%) | 0 (0.0%) |
| 18 to 34 Years | 3 (9.7%) | 0 (0.0%) |
| 35 to 64 Years | 7 (3.4%) | 0 (0.0%) |
| 65 to 74 Years | 0 (0.0%) | 0 (0.0%) |
| 75 Years and over | 0 (0.0%) | 3 (21.4%) |
Disability Class: Ambulatory Difficulty
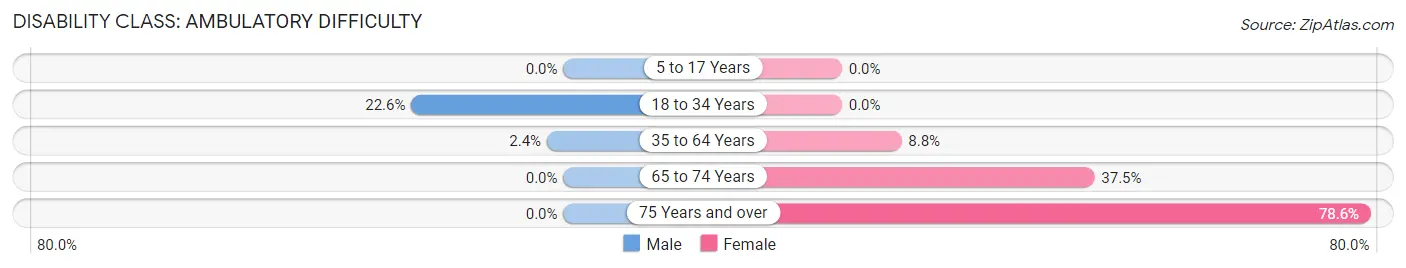
| Age Bracket | Male | Female |
| 5 to 17 Years | 0 (0.0%) | 0 (0.0%) |
| 18 to 34 Years | 7 (22.6%) | 0 (0.0%) |
| 35 to 64 Years | 5 (2.4%) | 19 (8.8%) |
| 65 to 74 Years | 0 (0.0%) | 12 (37.5%) |
| 75 Years and over | 0 (0.0%) | 11 (78.6%) |
Disability Class: Self-Care Difficulty
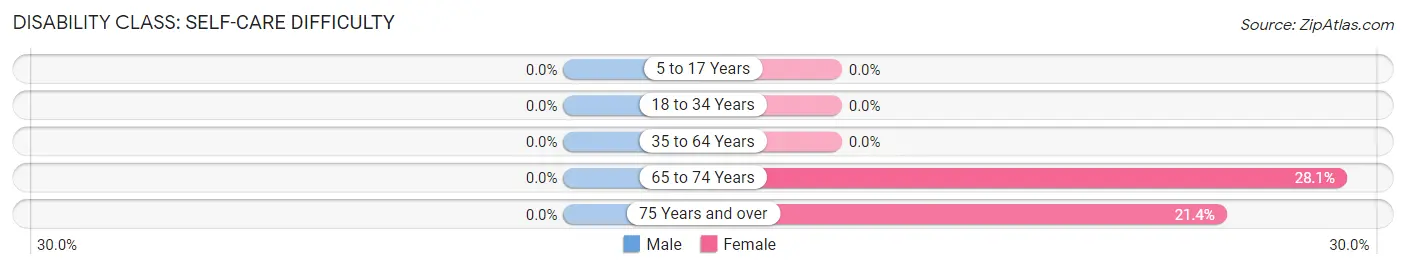
| Age Bracket | Male | Female |
| 5 to 17 Years | 0 (0.0%) | 0 (0.0%) |
| 18 to 34 Years | 0 (0.0%) | 0 (0.0%) |
| 35 to 64 Years | 0 (0.0%) | 0 (0.0%) |
| 65 to 74 Years | 0 (0.0%) | 9 (28.1%) |
| 75 Years and over | 0 (0.0%) | 3 (21.4%) |
Technology Access in Beasley
Computing Device Access in Beasley
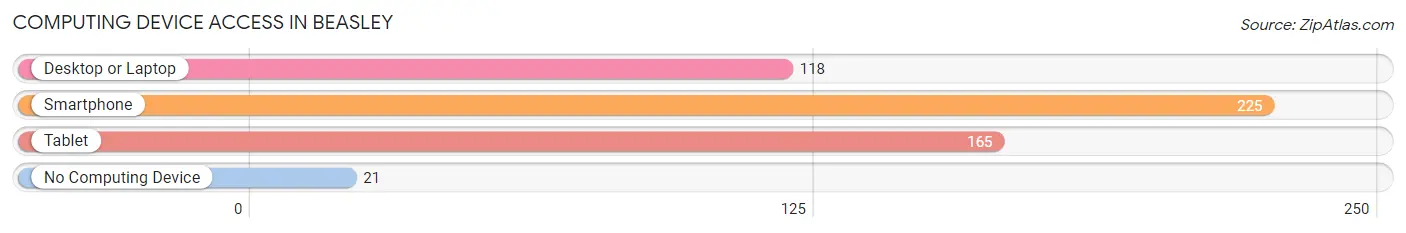
| Device Type | # Households | % Households |
| Desktop or Laptop | 118 | 43.5% |
| Smartphone | 225 | 83.0% |
| Tablet | 165 | 60.9% |
| No Computing Device | 21 | 7.7% |
| Total | 271 | 100.0% |
Internet Access in Beasley
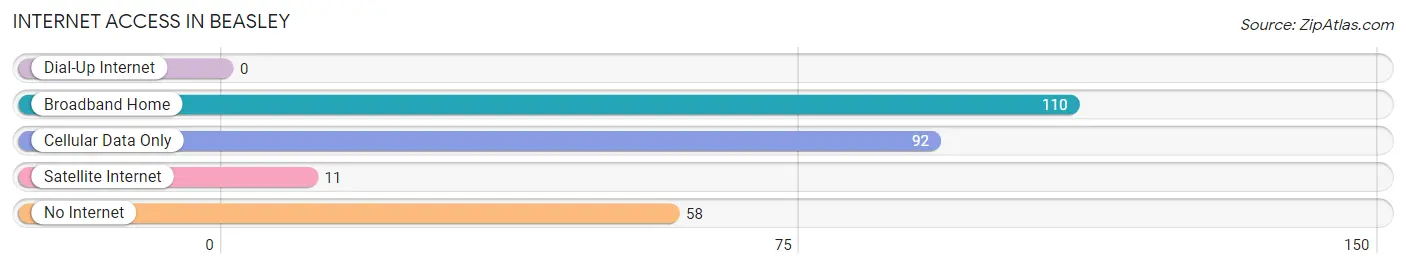
| Internet Type | # Households | % Households |
| Dial-Up Internet | 0 | 0.0% |
| Broadband Home | 110 | 40.6% |
| Cellular Data Only | 92 | 34.0% |
| Satellite Internet | 11 | 4.1% |
| No Internet | 58 | 21.4% |
| Total | 271 | 100.0% |
Beasley Summary
Beasley, Texas is a small town located in Fort Bend County, Texas. It is situated about 25 miles southwest of Houston and is part of the Houston–The Woodlands–Sugar Land metropolitan area. The town was founded in 1883 and was named after the Beasley family, who were among the first settlers in the area. As of the 2010 census, the population of Beasley was 1,443.
Geography
Beasley is located at 29°33'25" North, 95°51'45" West (29.556944, -95.862500). It is situated at an elevation of approximately 50 feet (15 m) above sea level. The town covers an area of 1.2 square miles (3.2 km2), all of which is land.
Beasley is located in the Gulf Coastal Plains region of Texas. The climate is humid subtropical, with hot summers and mild winters. The average annual temperature is 68°F (20°C), and the average annual precipitation is 45 inches (114 cm).
Economy
Beasley’s economy is largely based on agriculture. The town is home to several farms, which produce a variety of crops, including cotton, corn, soybeans, and hay. The town also has a few small businesses, including a grocery store, a hardware store, and a few restaurants.
Demographics
As of the 2010 census, there were 1,443 people, 517 households, and 393 families residing in Beasley. The population density was 1,196.7 people per square mile (462.2/km2). The racial makeup of the town was 79.2% White, 15.2% African American, 0.3% Native American, 0.7% Asian, 0.1% Pacific Islander, 2.3% from other races, and 2.3% from two or more races. Hispanic or Latino of any race were 8.2% of the population.
There were 517 households, out of which 37.2% had children under the age of 18 living with them, 54.2% were married couples living together, 14.2% had a female householder with no husband present, and 25.3% were non-families. 21.2% of all households were made up of individuals, and 8.3% had someone living alone who was 65 years of age or older. The average household size was 2.80 and the average family size was 3.27.
In Beasley, the population was spread out, with 28.2% under the age of 18, 8.2% from 18 to 24, 28.2% from 25 to 44, 24.2% from 45 to 64, and 11.2% who were 65 years of age or older. The median age was 36 years. For every 100 females, there were 97.2 males. For every 100 females age 18 and over, there were 94.2 males.
The median income for a household in Beasley was $41,250, and the median income for a family was $45,000. Males had a median income of $35,000 versus $25,000 for females. The per capita income for the town was $17,845. About 10.2% of families and 12.2% of the population were below the poverty line, including 16.2% of those under age 18 and 8.2% of those age 65 or over.
Beasley is a small town with a rich history and a diverse population. It is a great place to live and work, and it offers a variety of opportunities for those who are looking for a place to call home.
Common Questions
What is Per Capita Income in Beasley?
Per Capita income in Beasley is $20,758.
What is the Median Family Income in Beasley?
Median Family Income in Beasley is $71,090.
What is the Median Household income in Beasley?
Median Household Income in Beasley is $70,519.
What is Income or Wage Gap in Beasley?
Income or Wage Gap in Beasley is 32.2%.
Women in Beasley earn 67.8 cents for every dollar earned by a man.
What is Inequality or Gini Index in Beasley?
Inequality or Gini Index in Beasley is 0.34.
What is the Total Population of Beasley?
Total Population of Beasley is 984.
What is the Total Male Population of Beasley?
Total Male Population of Beasley is 550.
What is the Total Female Population of Beasley?
Total Female Population of Beasley is 434.
What is the Ratio of Males per 100 Females in Beasley?
There are 126.73 Males per 100 Females in Beasley.
What is the Ratio of Females per 100 Males in Beasley?
There are 78.91 Females per 100 Males in Beasley.
What is the Median Population Age in Beasley?
Median Population Age in Beasley is 34.0 Years.
What is the Average Family Size in Beasley
Average Family Size in Beasley is 4.2 People.
What is the Average Household Size in Beasley
Average Household Size in Beasley is 3.6 People.
How Large is the Labor Force in Beasley?
There are 418 People in the Labor Forcein in Beasley.
What is the Percentage of People in the Labor Force in Beasley?
75.6% of People are in the Labor Force in Beasley.
What is the Unemployment Rate in Beasley?
Unemployment Rate in Beasley is 20.1%.