Batesville, TX Map & Demographics
Batesville Map
Batesville Overview
$13,219
PER CAPITA INCOME
$26,134
AVG FAMILY INCOME
$35,132
AVG HOUSEHOLD INCOME
0.46
INEQUALITY / GINI INDEX
1,124
TOTAL POPULATION
645
MALE POPULATION
479
FEMALE POPULATION
134.66
MALES / 100 FEMALES
74.26
FEMALES / 100 MALES
24.6
MEDIAN AGE
5.0
AVG FAMILY SIZE
4.0
AVG HOUSEHOLD SIZE
418
LABOR FORCE [ PEOPLE ]
55.2%
PERCENT IN LABOR FORCE
3.6%
UNEMPLOYMENT RATE
Batesville Zip Codes
Batesville Area Codes
Income in Batesville
Income Overview in Batesville
Per Capita Income in Batesville is $13,219, while median incomes of families and households are $26,134 and $35,132 respectively.
| Characteristic | Number | Measure |
| Per Capita Income | 1,124 | $13,219 |
| Median Family Income | 197 | $26,134 |
| Mean Family Income | 197 | $37,775 |
| Median Household Income | 284 | $35,132 |
| Mean Household Income | 284 | $42,251 |
| Income Deficit | 197 | $0 |
| Wage / Income Gap (%) | 1,124 | 0.00% |
| Wage / Income Gap ($) | 1,124 | 100.00¢ per $1 |
| Gini / Inequality Index | 1,124 | 0.46 |
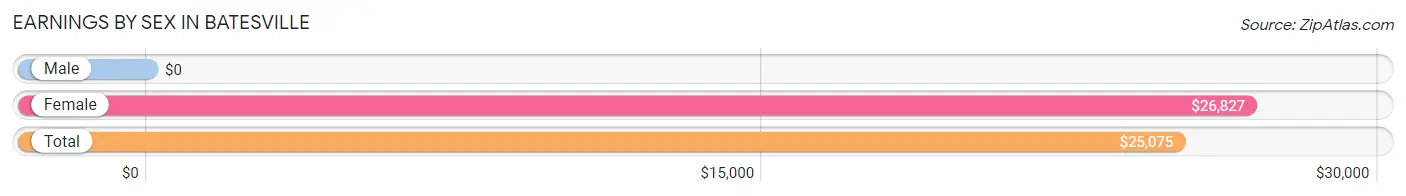
Earnings by Sex in Batesville
| Sex | Number | Average Earnings |
| Male | 287 (68.7%) | $0 |
| Female | 131 (31.3%) | $26,827 |
| Total | 418 (100.0%) | $25,075 |
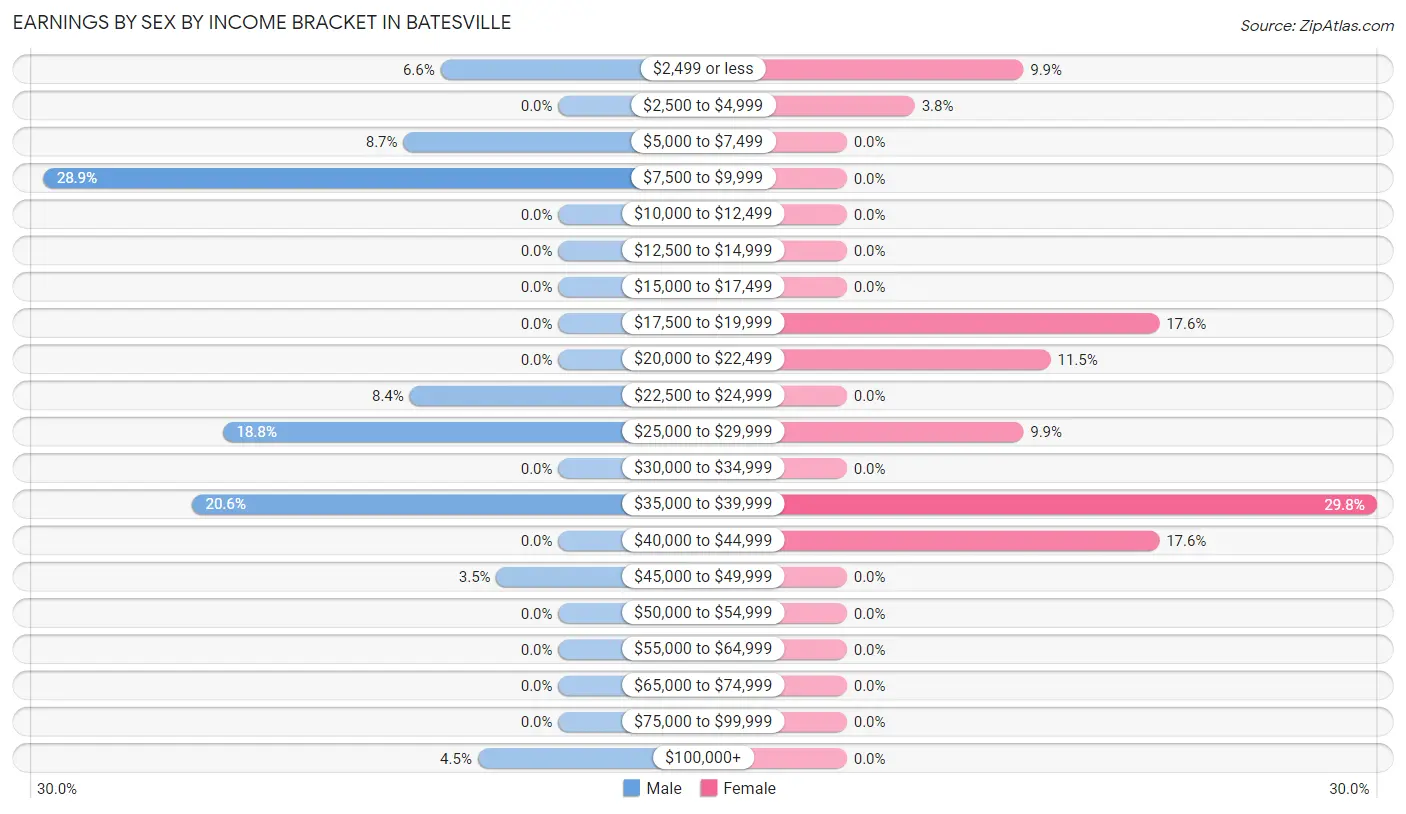
Earnings by Sex by Income Bracket in Batesville
The most common earnings brackets in Batesville are $7,500 to $9,999 for men (83 | 28.9%) and $35,000 to $39,999 for women (39 | 29.8%).
| Income | Male | Female |
| $2,499 or less | 19 (6.6%) | 13 (9.9%) |
| $2,500 to $4,999 | 0 (0.0%) | 5 (3.8%) |
| $5,000 to $7,499 | 25 (8.7%) | 0 (0.0%) |
| $7,500 to $9,999 | 83 (28.9%) | 0 (0.0%) |
| $10,000 to $12,499 | 0 (0.0%) | 0 (0.0%) |
| $12,500 to $14,999 | 0 (0.0%) | 0 (0.0%) |
| $15,000 to $17,499 | 0 (0.0%) | 0 (0.0%) |
| $17,500 to $19,999 | 0 (0.0%) | 23 (17.6%) |
| $20,000 to $22,499 | 0 (0.0%) | 15 (11.5%) |
| $22,500 to $24,999 | 24 (8.4%) | 0 (0.0%) |
| $25,000 to $29,999 | 54 (18.8%) | 13 (9.9%) |
| $30,000 to $34,999 | 0 (0.0%) | 0 (0.0%) |
| $35,000 to $39,999 | 59 (20.6%) | 39 (29.8%) |
| $40,000 to $44,999 | 0 (0.0%) | 23 (17.6%) |
| $45,000 to $49,999 | 10 (3.5%) | 0 (0.0%) |
| $50,000 to $54,999 | 0 (0.0%) | 0 (0.0%) |
| $55,000 to $64,999 | 0 (0.0%) | 0 (0.0%) |
| $65,000 to $74,999 | 0 (0.0%) | 0 (0.0%) |
| $75,000 to $99,999 | 0 (0.0%) | 0 (0.0%) |
| $100,000+ | 13 (4.5%) | 0 (0.0%) |
| Total | 287 (100.0%) | 131 (100.0%) |
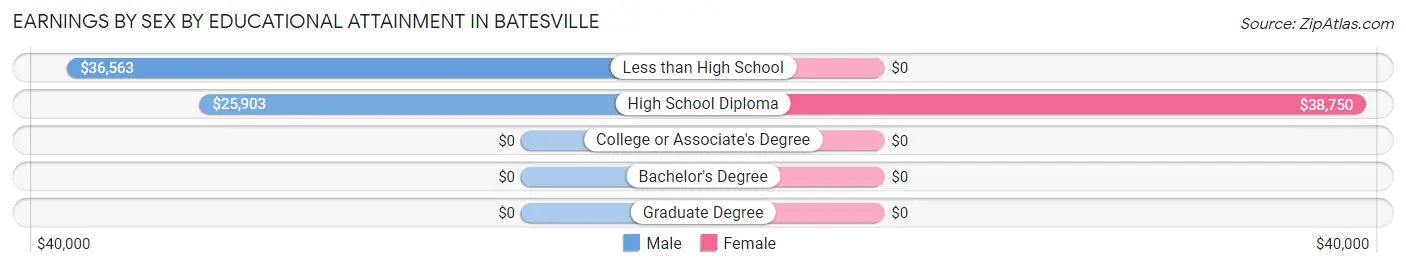
Earnings by Sex by Educational Attainment in Batesville
Average earnings in Batesville are $26,921 for men and $26,827 for women, a difference of 0.4%. Men with an educational attainment of less than high school enjoy the highest average annual earnings of $36,563, while those with high school diploma education earn the least with $25,903. Women with an educational attainment of high school diploma earn the most with the average annual earnings of $38,750, while those with high school diploma education have the smallest earnings of $38,750.
| Educational Attainment | Male Income | Female Income |
| Less than High School | $36,563 | $0 |
| High School Diploma | $25,903 | $38,750 |
| College or Associate's Degree | - | - |
| Bachelor's Degree | - | - |
| Graduate Degree | - | - |
| Total | $26,921 | $26,827 |
Family Income in Batesville
Family Income Brackets in Batesville
According to the Batesville family income data, there are 61 families falling into the less than $10,000 income range, which is the most common income bracket and makes up 31.0% of all families.
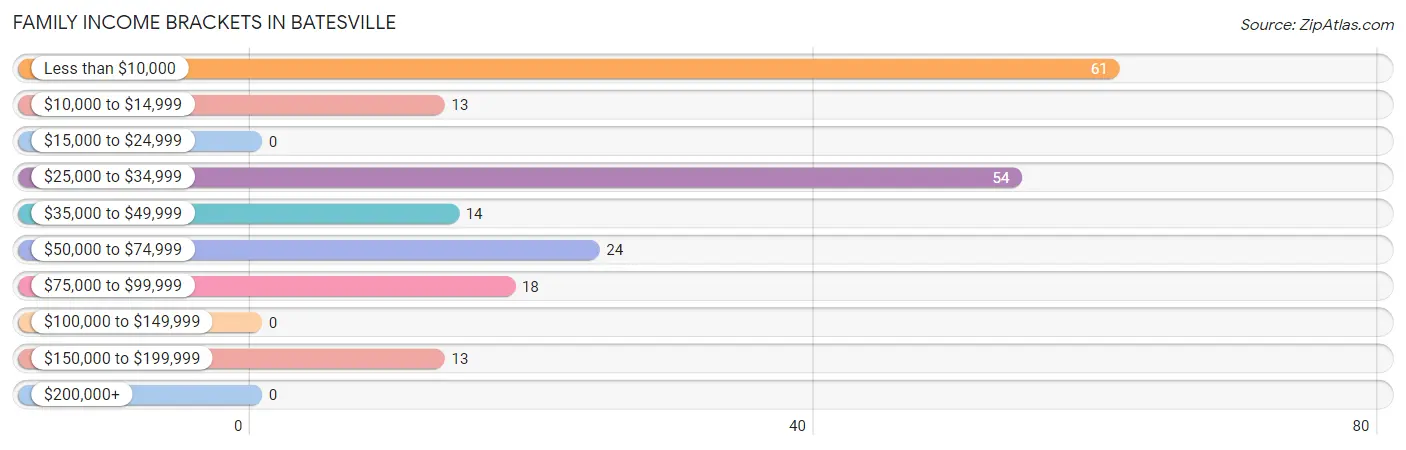
| Income Bracket | # Families | % Families |
| Less than $10,000 | 61 | 31.0% |
| $10,000 to $14,999 | 13 | 6.6% |
| $15,000 to $24,999 | 0 | 0.0% |
| $25,000 to $34,999 | 54 | 27.4% |
| $35,000 to $49,999 | 14 | 7.1% |
| $50,000 to $74,999 | 24 | 12.2% |
| $75,000 to $99,999 | 18 | 9.1% |
| $100,000 to $149,999 | 0 | 0.0% |
| $150,000 to $199,999 | 13 | 6.6% |
| $200,000+ | 0 | 0.0% |
Family Income by Famaliy Size in Batesville
2-person families (58 | 29.4%) account for the highest median family income in Batesville with $46,964 per family, while 2-person families (58 | 29.4%) have the highest median income of $23,482 per family member.
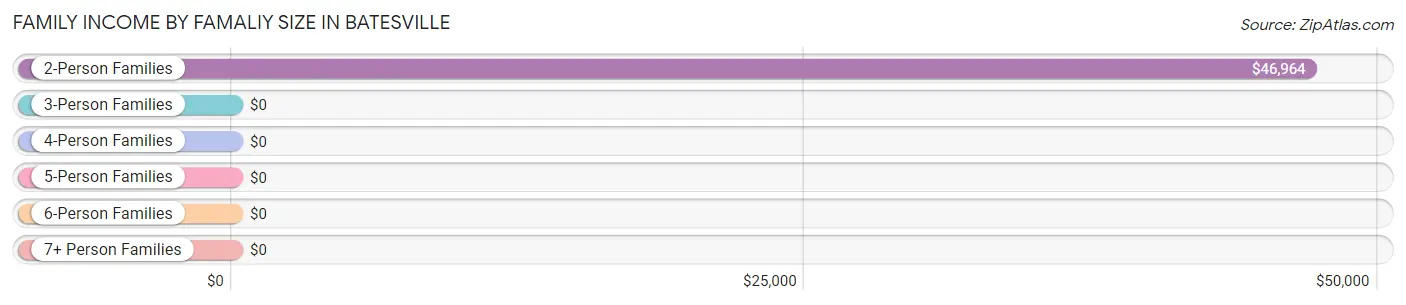
| Income Bracket | # Families | Median Income |
| 2-Person Families | 58 (29.4%) | $46,964 |
| 3-Person Families | 110 (55.8%) | $0 |
| 4-Person Families | 0 (0.0%) | $0 |
| 5-Person Families | 18 (9.1%) | $0 |
| 6-Person Families | 11 (5.6%) | $0 |
| 7+ Person Families | 0 (0.0%) | $0 |
| Total | 197 (100.0%) | $26,134 |
Family Income by Number of Earners in Batesville
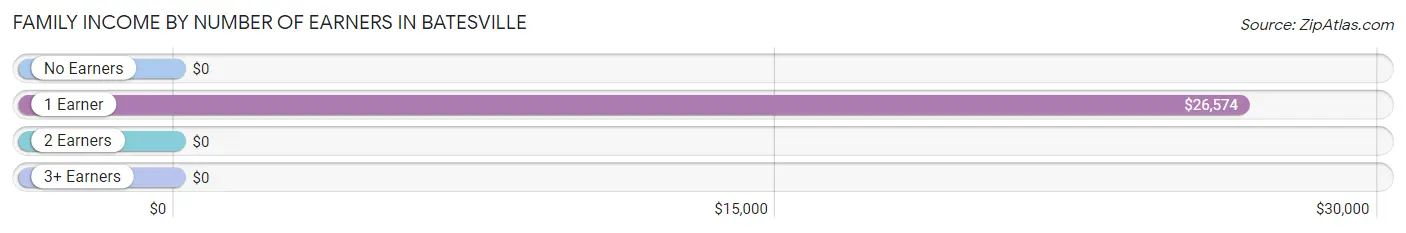
| Number of Earners | # Families | Median Income |
| No Earners | 42 (21.3%) | $0 |
| 1 Earner | 94 (47.7%) | $26,574 |
| 2 Earners | 43 (21.8%) | $0 |
| 3+ Earners | 18 (9.1%) | $0 |
| Total | 197 (100.0%) | $26,134 |
Household Income in Batesville
Household Income Brackets in Batesville
With 60 households falling in the category, the $50,000 to $74,999 income range is the most frequent in Batesville, accounting for 21.1% of all households.
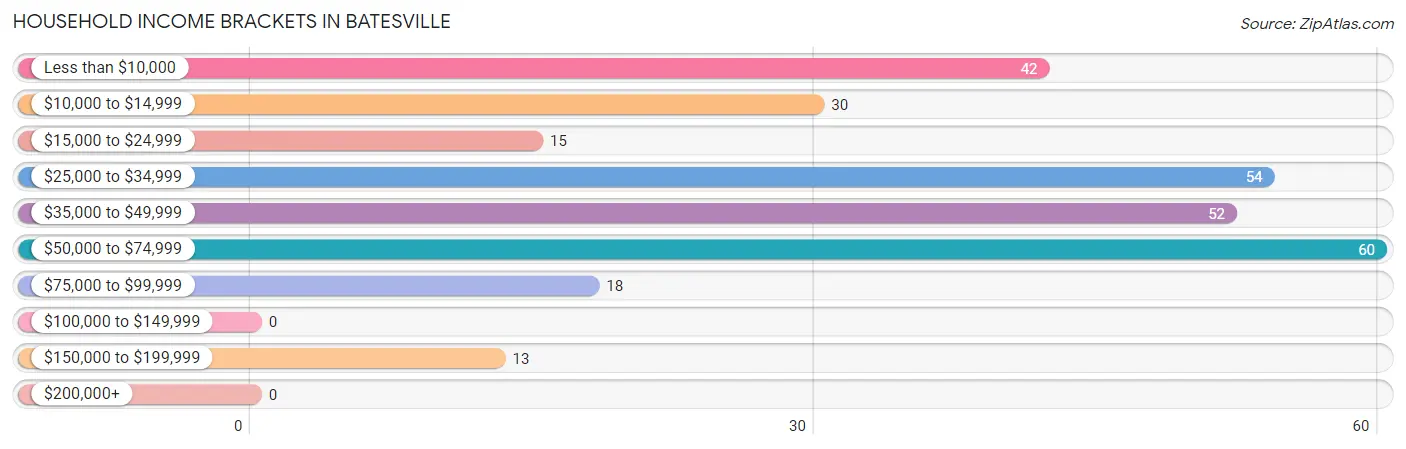
| Income Bracket | # Households | % Households |
| Less than $10,000 | 42 | 14.8% |
| $10,000 to $14,999 | 30 | 10.6% |
| $15,000 to $24,999 | 15 | 5.3% |
| $25,000 to $34,999 | 54 | 19.0% |
| $35,000 to $49,999 | 52 | 18.3% |
| $50,000 to $74,999 | 60 | 21.1% |
| $75,000 to $99,999 | 18 | 6.3% |
| $100,000 to $149,999 | 0 | 0.0% |
| $150,000 to $199,999 | 13 | 4.6% |
| $200,000+ | 0 | 0.0% |
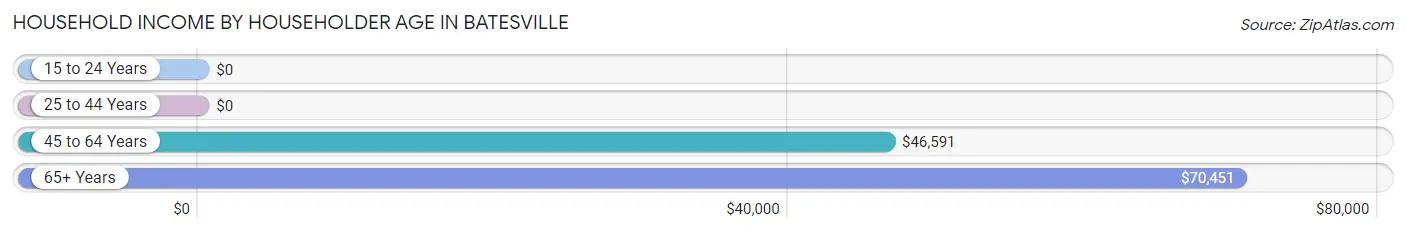
Household Income by Householder Age in Batesville
The median household income in Batesville is $35,132, with the highest median household income of $70,451 found in the 65+ years age bracket for the primary householder. A total of 85 households (29.9%) fall into this category.
| Income Bracket | # Households | Median Income |
| 15 to 24 Years | 0 (0.0%) | $0 |
| 25 to 44 Years | 91 (32.0%) | $0 |
| 45 to 64 Years | 108 (38.0%) | $46,591 |
| 65+ Years | 85 (29.9%) | $70,451 |
| Total | 284 (100.0%) | $35,132 |
Poverty in Batesville
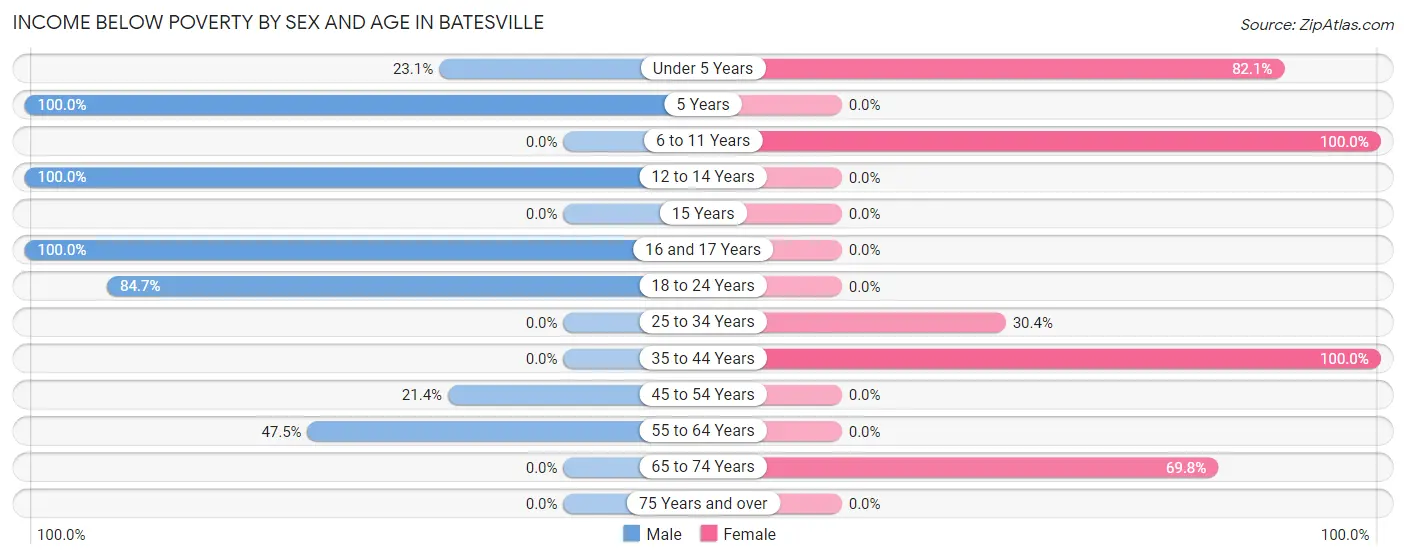
Income Below Poverty by Sex and Age in Batesville
With 55.7% poverty level for males and 43.2% for females among the residents of Batesville, 5 year old males and 6 to 11 year old females are the most vulnerable to poverty, with 104 males (100.0%) and 40 females (100.0%) in their respective age groups living below the poverty level.
| Age Bracket | Male | Female |
| Under 5 Years | 9 (23.1%) | 78 (82.1%) |
| 5 Years | 104 (100.0%) | 0 (0.0%) |
| 6 to 11 Years | 0 (0.0%) | 40 (100.0%) |
| 12 to 14 Years | 64 (100.0%) | 0 (0.0%) |
| 15 Years | 0 (0.0%) | 0 (0.0%) |
| 16 and 17 Years | 62 (100.0%) | 0 (0.0%) |
| 18 to 24 Years | 83 (84.7%) | 0 (0.0%) |
| 25 to 34 Years | 0 (0.0%) | 21 (30.4%) |
| 35 to 44 Years | 0 (0.0%) | 24 (100.0%) |
| 45 to 54 Years | 18 (21.4%) | 0 (0.0%) |
| 55 to 64 Years | 19 (47.5%) | 0 (0.0%) |
| 65 to 74 Years | 0 (0.0%) | 44 (69.8%) |
| 75 Years and over | 0 (0.0%) | 0 (0.0%) |
| Total | 359 (55.7%) | 207 (43.2%) |
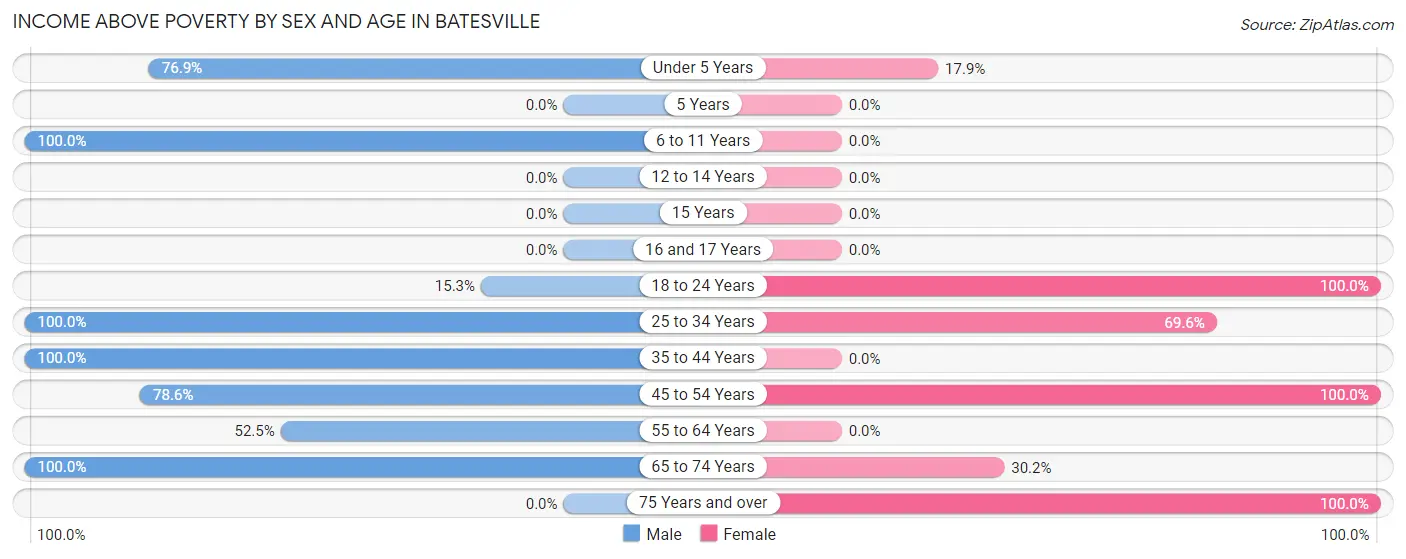
Income Above Poverty by Sex and Age in Batesville
According to the poverty statistics in Batesville, males aged 6 to 11 years and females aged 18 to 24 years are the age groups that are most secure financially, with 100.0% of males and 100.0% of females in these age groups living above the poverty line.
| Age Bracket | Male | Female |
| Under 5 Years | 30 (76.9%) | 17 (17.9%) |
| 5 Years | 0 (0.0%) | 0 (0.0%) |
| 6 to 11 Years | 25 (100.0%) | 0 (0.0%) |
| 12 to 14 Years | 0 (0.0%) | 0 (0.0%) |
| 15 Years | 0 (0.0%) | 0 (0.0%) |
| 16 and 17 Years | 0 (0.0%) | 0 (0.0%) |
| 18 to 24 Years | 15 (15.3%) | 58 (100.0%) |
| 25 to 34 Years | 39 (100.0%) | 48 (69.6%) |
| 35 to 44 Years | 54 (100.0%) | 0 (0.0%) |
| 45 to 54 Years | 66 (78.6%) | 117 (100.0%) |
| 55 to 64 Years | 21 (52.5%) | 0 (0.0%) |
| 65 to 74 Years | 36 (100.0%) | 19 (30.2%) |
| 75 Years and over | 0 (0.0%) | 13 (100.0%) |
| Total | 286 (44.3%) | 272 (56.8%) |
Income Below Poverty Among Married-Couple Families in Batesville
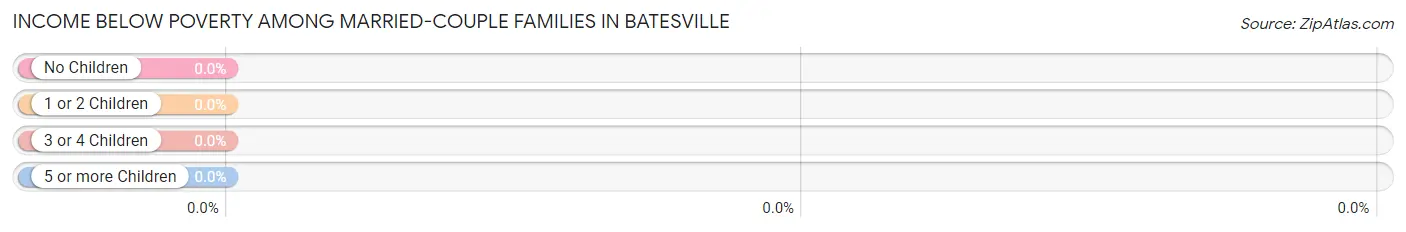
| Children | Above Poverty | Below Poverty |
| No Children | 32 (100.0%) | 0 (0.0%) |
| 1 or 2 Children | 65 (100.0%) | 0 (0.0%) |
| 3 or 4 Children | 0 (0.0%) | 0 (0.0%) |
| 5 or more Children | 0 (0.0%) | 0 (0.0%) |
| Total | 97 (100.0%) | 0 (0.0%) |
Income Below Poverty Among Single-Parent Households in Batesville
According to the poverty data in Batesville, 100.0% or 37 single-father households and 58.7% or 37 single-mother households are living below the poverty line. Among single-father households, those with 1 or 2 children have the highest poverty rate, with 37 households (100.0%) experiencing poverty. Likewise, among single-mother households, those with 1 or 2 children have the highest poverty rate, with 24 households (100.0%) falling below the poverty line.

| Children | Single Father | Single Mother |
| No Children | 0 (0.0%) | 0 (0.0%) |
| 1 or 2 Children | 37 (100.0%) | 24 (100.0%) |
| 3 or 4 Children | 0 (0.0%) | 13 (100.0%) |
| 5 or more Children | 0 (0.0%) | 0 (0.0%) |
| Total | 37 (100.0%) | 37 (58.7%) |
Income Below Poverty Among Married-Couple vs Single-Parent Households in Batesville
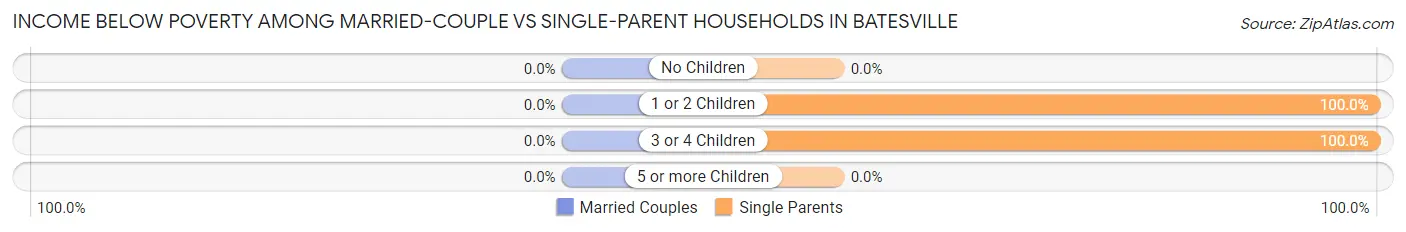
| Children | Married-Couple Families | Single-Parent Households |
| No Children | 0 (0.0%) | 0 (0.0%) |
| 1 or 2 Children | 0 (0.0%) | 61 (100.0%) |
| 3 or 4 Children | 0 (0.0%) | 13 (100.0%) |
| 5 or more Children | 0 (0.0%) | 0 (0.0%) |
| Total | 0 (0.0%) | 74 (74.0%) |
Race in Batesville
The most populous races in Batesville are Hispanic or Latino (1,105 | 98.3%), White / Caucasian (673 | 59.9%), and Two or more Races (451 | 40.1%).
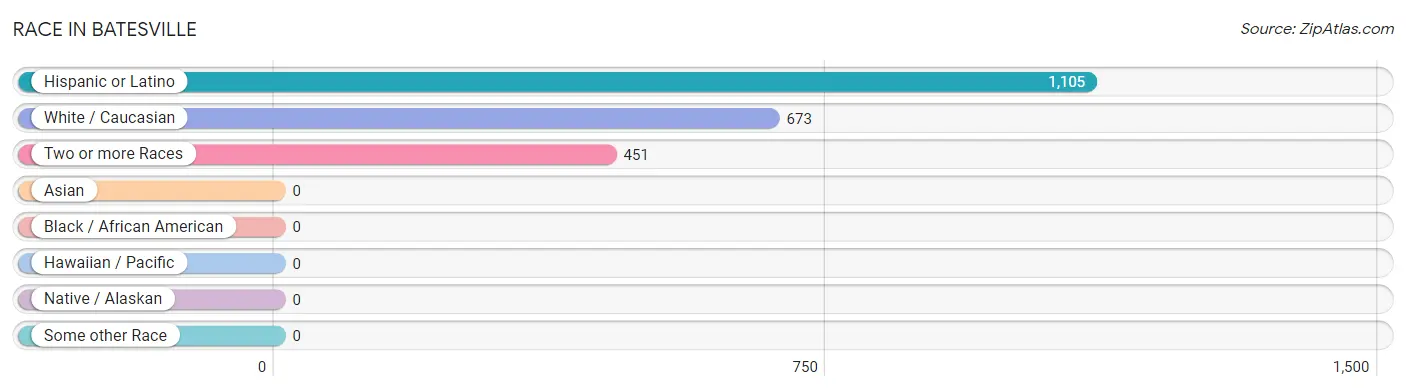
| Race | # Population | % Population |
| Asian | 0 | 0.0% |
| Black / African American | 0 | 0.0% |
| Hawaiian / Pacific | 0 | 0.0% |
| Hispanic or Latino | 1,105 | 98.3% |
| Native / Alaskan | 0 | 0.0% |
| White / Caucasian | 673 | 59.9% |
| Two or more Races | 451 | 40.1% |
| Some other Race | 0 | 0.0% |
| Total | 1,124 | 100.0% |
Ancestry in Batesville
The most populous ancestries reported in Batesville are Mexican (1,105 | 98.3%), and English (19 | 1.7%), together accounting for 100.0% of all Batesville residents.
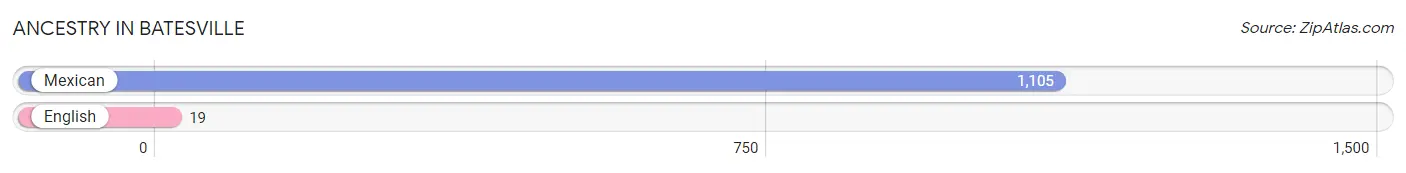
| Ancestry | # Population | % Population |
| English | 19 | 1.7% |
| Mexican | 1,105 | 98.3% | View All 2 Rows |
Immigrants in Batesville
The most numerous immigrant groups reported in Batesville came from Central America (45 | 4.0%), Latin America (45 | 4.0%), and Mexico (45 | 4.0%), together accounting for 12.0% of all Batesville residents.
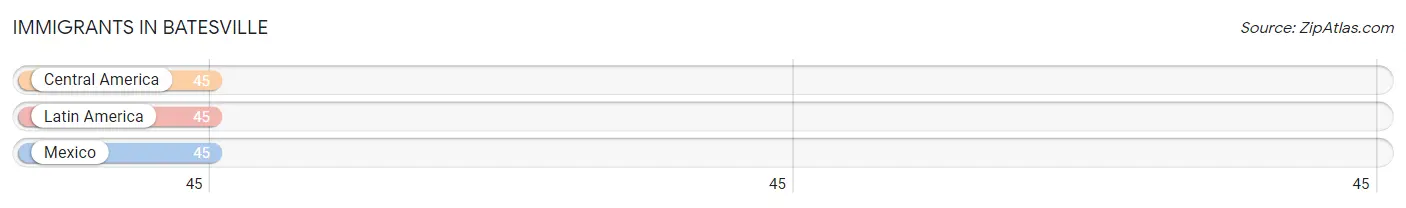
| Immigration Origin | # Population | % Population |
| Central America | 45 | 4.0% |
| Latin America | 45 | 4.0% |
| Mexico | 45 | 4.0% | View All 3 Rows |
Sex and Age in Batesville
Sex and Age in Batesville
The most populous age groups in Batesville are 15 to 19 Years (145 | 22.5%) for men and Under 5 Years (95 | 19.8%) for women.
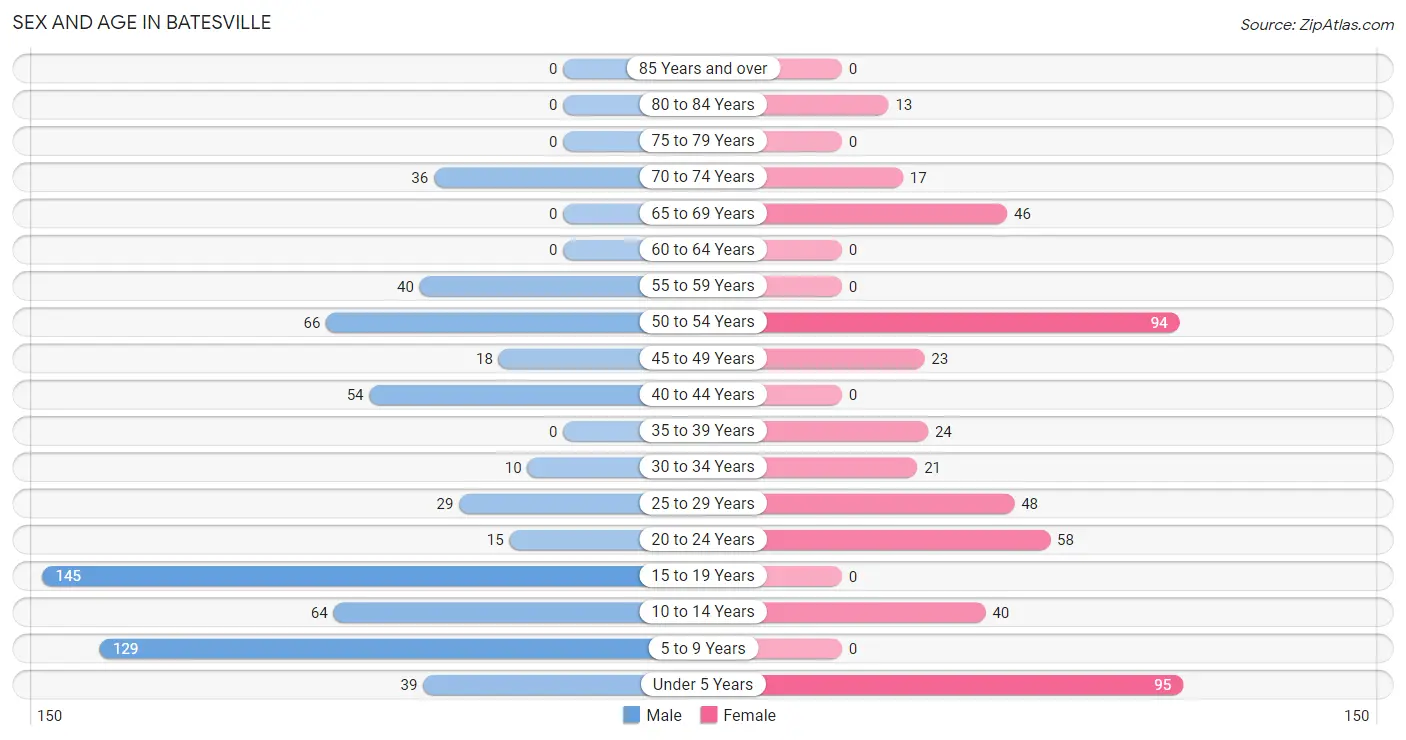
| Age Bracket | Male | Female |
| Under 5 Years | 39 (6.0%) | 95 (19.8%) |
| 5 to 9 Years | 129 (20.0%) | 0 (0.0%) |
| 10 to 14 Years | 64 (9.9%) | 40 (8.4%) |
| 15 to 19 Years | 145 (22.5%) | 0 (0.0%) |
| 20 to 24 Years | 15 (2.3%) | 58 (12.1%) |
| 25 to 29 Years | 29 (4.5%) | 48 (10.0%) |
| 30 to 34 Years | 10 (1.5%) | 21 (4.4%) |
| 35 to 39 Years | 0 (0.0%) | 24 (5.0%) |
| 40 to 44 Years | 54 (8.4%) | 0 (0.0%) |
| 45 to 49 Years | 18 (2.8%) | 23 (4.8%) |
| 50 to 54 Years | 66 (10.2%) | 94 (19.6%) |
| 55 to 59 Years | 40 (6.2%) | 0 (0.0%) |
| 60 to 64 Years | 0 (0.0%) | 0 (0.0%) |
| 65 to 69 Years | 0 (0.0%) | 46 (9.6%) |
| 70 to 74 Years | 36 (5.6%) | 17 (3.5%) |
| 75 to 79 Years | 0 (0.0%) | 0 (0.0%) |
| 80 to 84 Years | 0 (0.0%) | 13 (2.7%) |
| 85 Years and over | 0 (0.0%) | 0 (0.0%) |
| Total | 645 (100.0%) | 479 (100.0%) |
Families and Households in Batesville
Median Family Size in Batesville
The median family size in Batesville is 4.97 persons per family, with single female/mother families (63 | 32.0%) accounting for the largest median family size of 5.95 persons per family. On the other hand, married-couple families (97 | 49.2%) represent the smallest median family size with 4.15 persons per family.
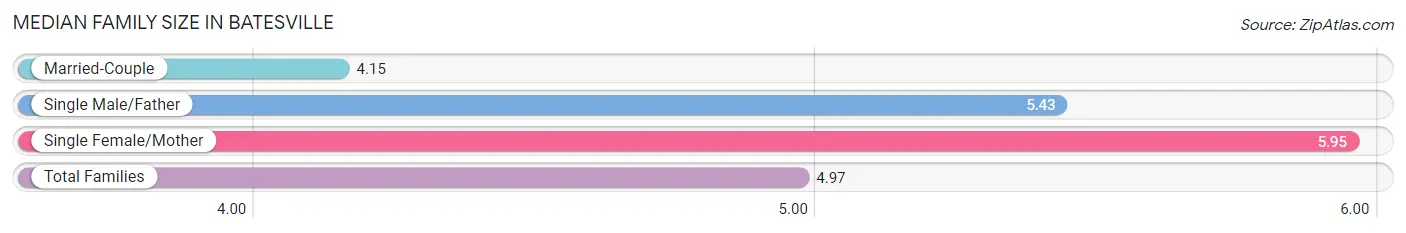
| Family Type | # Families | Family Size |
| Married-Couple | 97 (49.2%) | 4.15 |
| Single Male/Father | 37 (18.8%) | 5.43 |
| Single Female/Mother | 63 (32.0%) | 5.95 |
| Total Families | 197 (100.0%) | 4.97 |
Median Household Size in Batesville
The median household size in Batesville is 3.96 persons per household, with single male/father households (37 | 13.0%) accounting for the largest median household size of 6.27 persons per household. non-family households (87 | 30.6%) represent the smallest median household size with 1.31 persons per household.
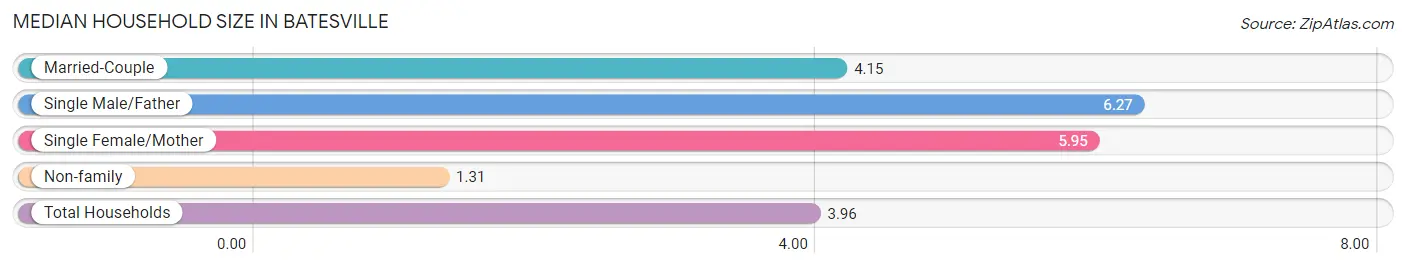
| Household Type | # Households | Household Size |
| Married-Couple | 97 (34.2%) | 4.15 |
| Single Male/Father | 37 (13.0%) | 6.27 |
| Single Female/Mother | 63 (22.2%) | 5.95 |
| Non-family | 87 (30.6%) | 1.31 |
| Total Households | 284 (100.0%) | 3.96 |
Household Size by Marriage Status in Batesville
Out of a total of 284 households in Batesville, 197 (69.4%) are family households, while 87 (30.6%) are nonfamily households. The most numerous type of family households are 3-person households, comprising 109, and the most common type of nonfamily households are 1-person households, comprising 51.
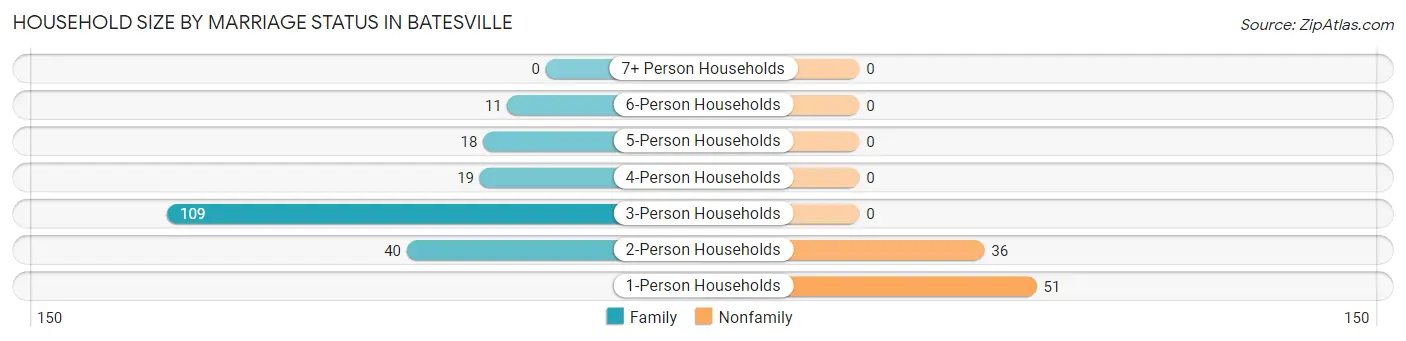
| Household Size | Family Households | Nonfamily Households |
| 1-Person Households | - | 51 (18.0%) |
| 2-Person Households | 40 (14.1%) | 36 (12.7%) |
| 3-Person Households | 109 (38.4%) | 0 (0.0%) |
| 4-Person Households | 19 (6.7%) | 0 (0.0%) |
| 5-Person Households | 18 (6.3%) | 0 (0.0%) |
| 6-Person Households | 11 (3.9%) | 0 (0.0%) |
| 7+ Person Households | 0 (0.0%) | 0 (0.0%) |
| Total | 197 (69.4%) | 87 (30.6%) |
Female Fertility in Batesville
Fertility by Age in Batesville
Average fertility rate in Batesville is 42.0 births per 1,000 women. Women in the age bracket of 20 to 34 years have the highest fertility rate with 63.0 births per 1,000 women. Women in the age bracket of 20 to 34 years acount for 100.0% of all women with births.
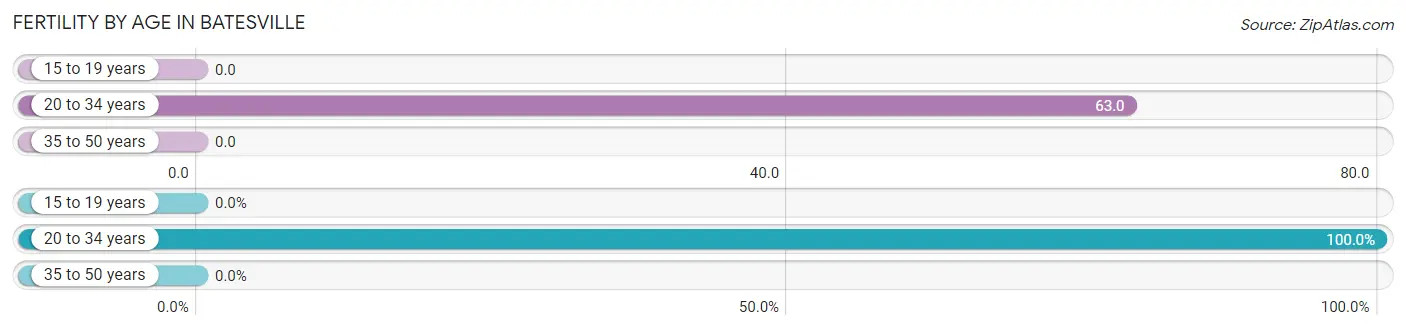
| Age Bracket | Women with Births | Births / 1,000 Women |
| 15 to 19 years | 0 (0.0%) | 0.0 |
| 20 to 34 years | 8 (100.0%) | 63.0 |
| 35 to 50 years | 0 (0.0%) | 0.0 |
| Total | 8 (100.0%) | 42.0 |
Fertility by Age by Marriage Status in Batesville
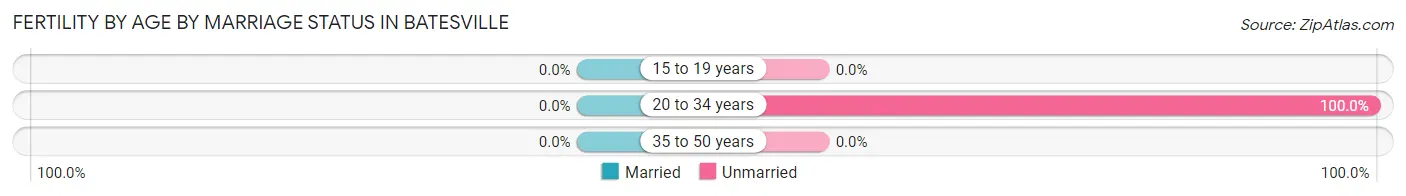
| Age Bracket | Married | Unmarried |
| 15 to 19 years | 0 (0.0%) | 0 (0.0%) |
| 20 to 34 years | 0 (0.0%) | 8 (100.0%) |
| 35 to 50 years | 0 (0.0%) | 0 (0.0%) |
| Total | 0 (0.0%) | 8 (100.0%) |
Fertility by Education in Batesville
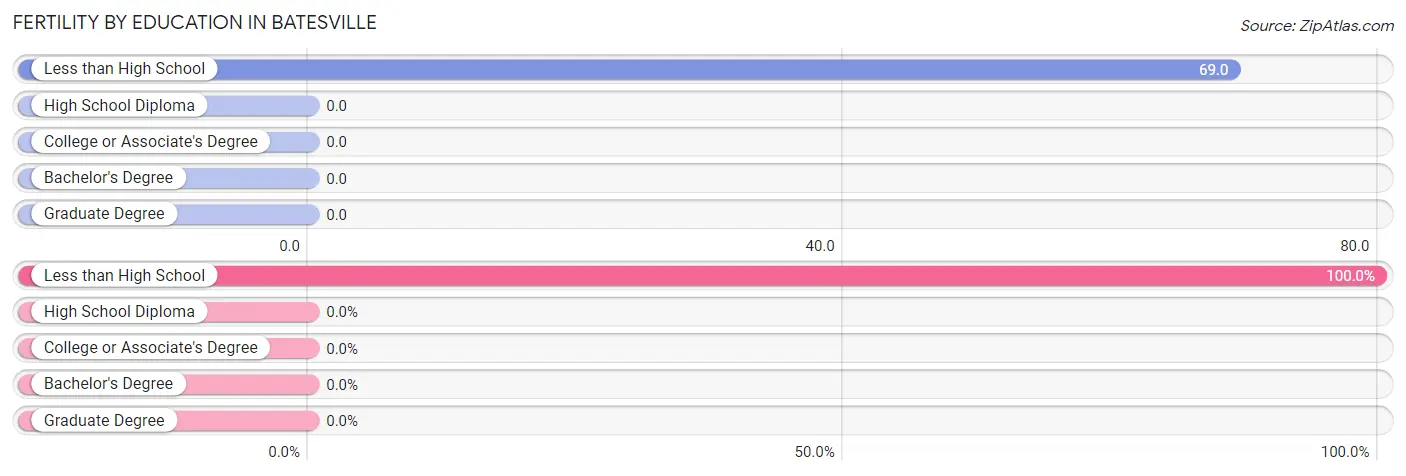
| Educational Attainment | Women with Births | Births / 1,000 Women |
| Less than High School | 8 (100.0%) | 69.0 |
| High School Diploma | 0 (0.0%) | 0.0 |
| College or Associate's Degree | 0 (0.0%) | 0.0 |
| Bachelor's Degree | 0 (0.0%) | 0.0 |
| Graduate Degree | 0 (0.0%) | 0.0 |
| Total | 8 (100.0%) | 42.0 |
Fertility by Education by Marriage Status in Batesville
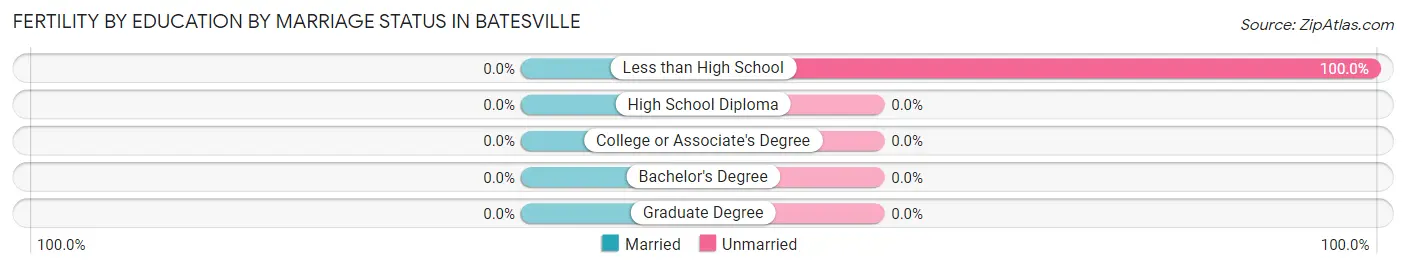
| Educational Attainment | Married | Unmarried |
| Less than High School | 0 (0.0%) | 8 (100.0%) |
| High School Diploma | 0 (0.0%) | 0 (0.0%) |
| College or Associate's Degree | 0 (0.0%) | 0 (0.0%) |
| Bachelor's Degree | 0 (0.0%) | 0 (0.0%) |
| Graduate Degree | 0 (0.0%) | 0 (0.0%) |
| Total | 0 (0.0%) | 8 (100.0%) |
Employment Characteristics in Batesville
Employment by Class of Employer in Batesville
Among the 384 employed individuals in Batesville, private company employees (317 | 82.6%), self-employed (not incorporated) (54 | 14.1%), and local government employees (13 | 3.4%) make up the most common classes of employment.
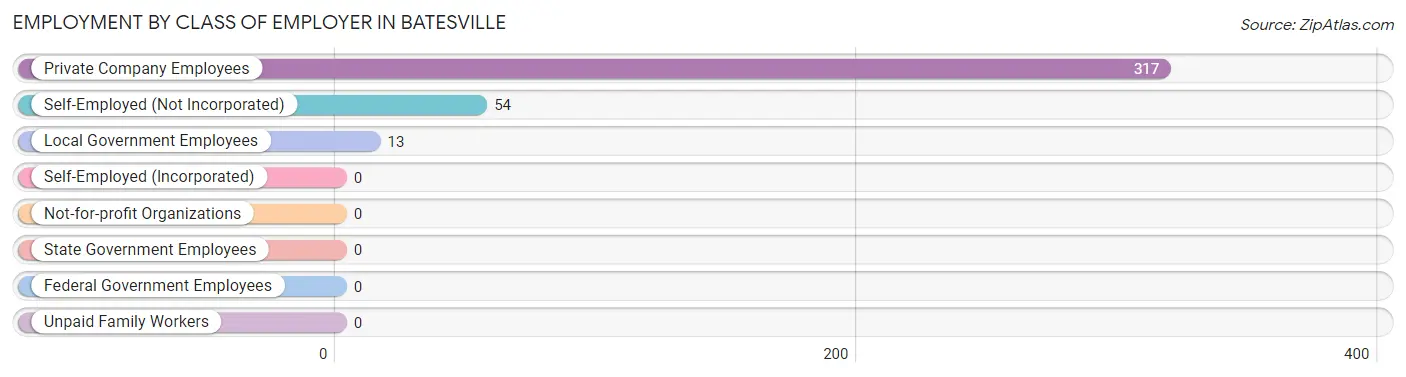
| Employer Class | # Employees | % Employees |
| Private Company Employees | 317 | 82.6% |
| Self-Employed (Incorporated) | 0 | 0.0% |
| Self-Employed (Not Incorporated) | 54 | 14.1% |
| Not-for-profit Organizations | 0 | 0.0% |
| Local Government Employees | 13 | 3.4% |
| State Government Employees | 0 | 0.0% |
| Federal Government Employees | 0 | 0.0% |
| Unpaid Family Workers | 0 | 0.0% |
| Total | 384 | 100.0% |
Employment Status by Age in Batesville
According to the labor force statistics for Batesville, out of the total population over 16 years of age (757), 55.2% or 418 individuals are in the labor force, with 3.6% or 15 of them unemployed. The age group with the highest labor force participation rate is 55 to 59 years, with 100.0% or 40 individuals in the labor force. Within the labor force, the 20 to 24 years age range has the highest percentage of unemployed individuals, with 100.0% or 15 of them being unemployed.
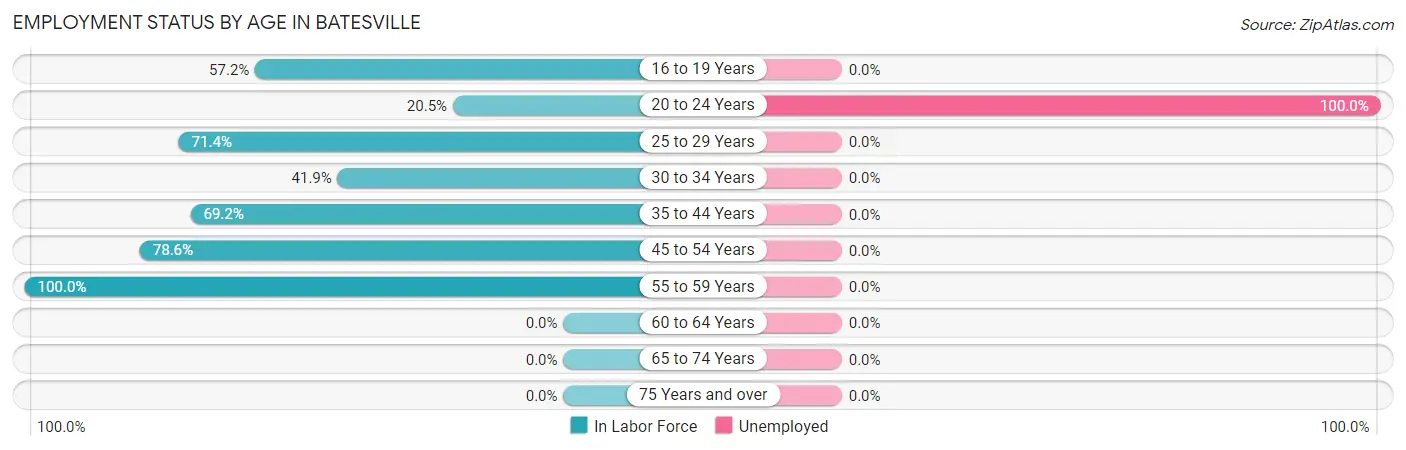
| Age Bracket | In Labor Force | Unemployed |
| 16 to 19 Years | 83 (57.2%) | 0 (0.0%) |
| 20 to 24 Years | 15 (20.5%) | 15 (100.0%) |
| 25 to 29 Years | 55 (71.4%) | 0 (0.0%) |
| 30 to 34 Years | 13 (41.9%) | 0 (0.0%) |
| 35 to 44 Years | 54 (69.2%) | 0 (0.0%) |
| 45 to 54 Years | 158 (78.6%) | 0 (0.0%) |
| 55 to 59 Years | 40 (100.0%) | 0 (0.0%) |
| 60 to 64 Years | 0 (0.0%) | 0 (0.0%) |
| 65 to 74 Years | 0 (0.0%) | 0 (0.0%) |
| 75 Years and over | 0 (0.0%) | 0 (0.0%) |
| Total | 418 (55.2%) | 15 (3.6%) |
Employment Status by Educational Attainment in Batesville
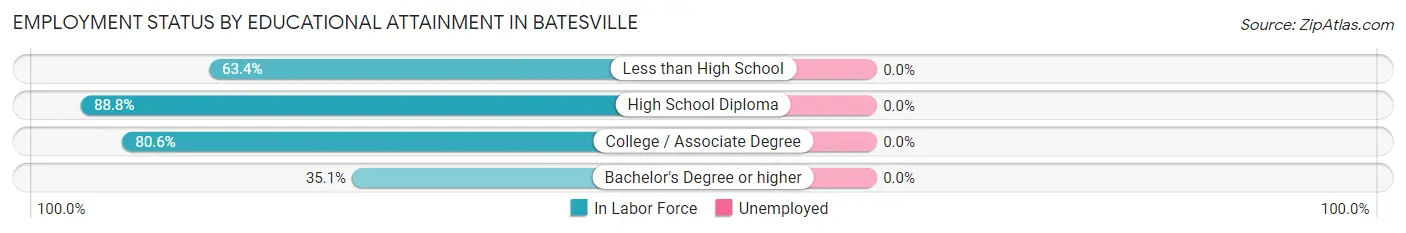
| Educational Attainment | In Labor Force | Unemployed |
| Less than High School | 83 (63.4%) | 0 (0.0%) |
| High School Diploma | 166 (88.8%) | 0 (0.0%) |
| College / Associate Degree | 58 (80.6%) | 0 (0.0%) |
| Bachelor's Degree or higher | 13 (35.1%) | 0 (0.0%) |
| Total | 320 (74.9%) | 0 (0.0%) |
Employment Occupations by Sex in Batesville
Management, Business, Science and Arts Occupations
The most common Management, Business, Science and Arts occupations in Batesville are Business & Financial (26 | 6.5%), Community & Social Service (13 | 3.2%), and Education Instruction & Library (13 | 3.2%).
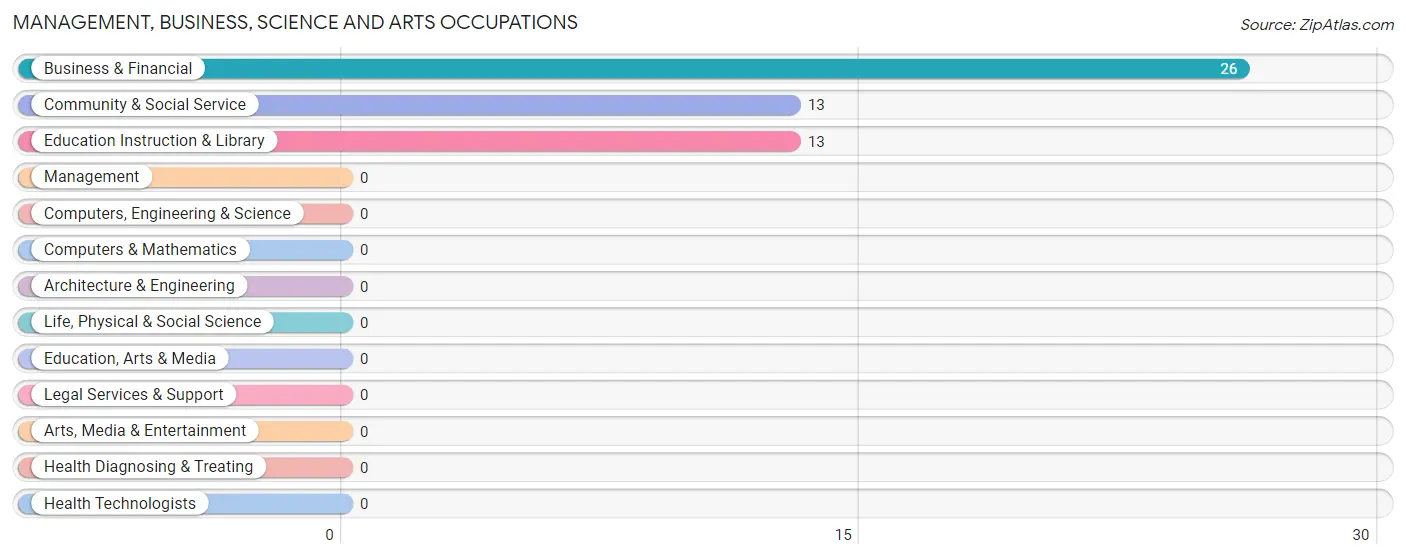
Management, Business, Science and Arts Occupations by Sex
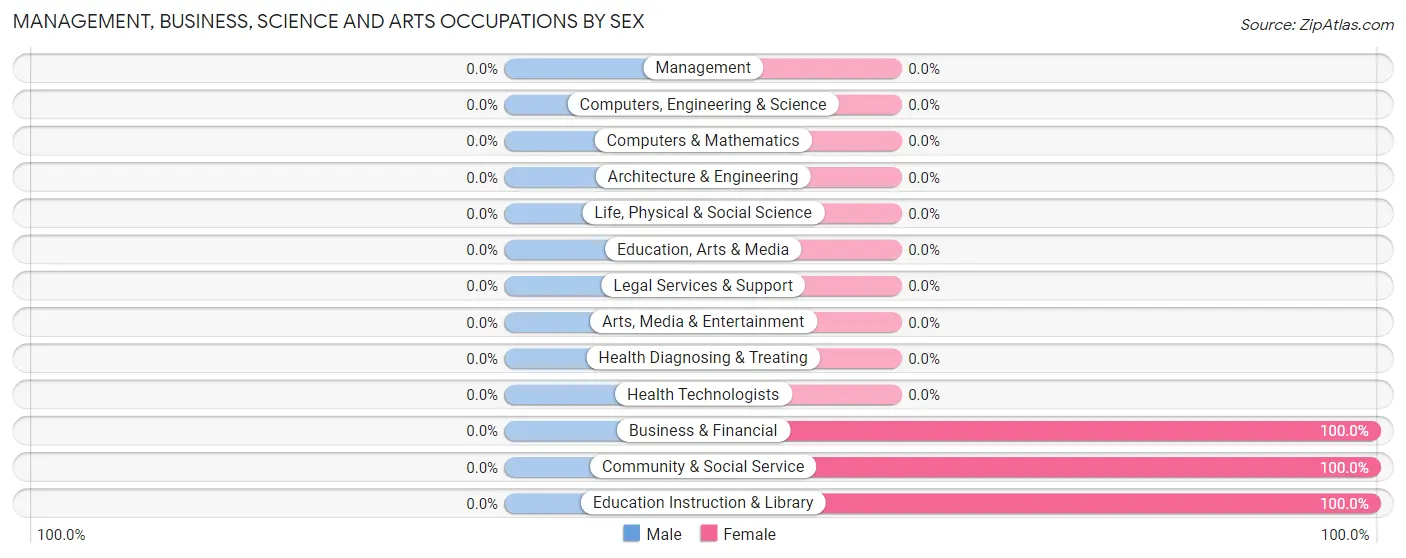
| Occupation | Male | Female |
| Management | 0 (0.0%) | 0 (0.0%) |
| Business & Financial | 0 (0.0%) | 26 (100.0%) |
| Computers, Engineering & Science | 0 (0.0%) | 0 (0.0%) |
| Computers & Mathematics | 0 (0.0%) | 0 (0.0%) |
| Architecture & Engineering | 0 (0.0%) | 0 (0.0%) |
| Life, Physical & Social Science | 0 (0.0%) | 0 (0.0%) |
| Community & Social Service | 0 (0.0%) | 13 (100.0%) |
| Education, Arts & Media | 0 (0.0%) | 0 (0.0%) |
| Legal Services & Support | 0 (0.0%) | 0 (0.0%) |
| Education Instruction & Library | 0 (0.0%) | 13 (100.0%) |
| Arts, Media & Entertainment | 0 (0.0%) | 0 (0.0%) |
| Health Diagnosing & Treating | 0 (0.0%) | 0 (0.0%) |
| Health Technologists | 0 (0.0%) | 0 (0.0%) |
| Total (Category) | 0 (0.0%) | 39 (100.0%) |
| Total (Overall) | 272 (67.5%) | 131 (32.5%) |
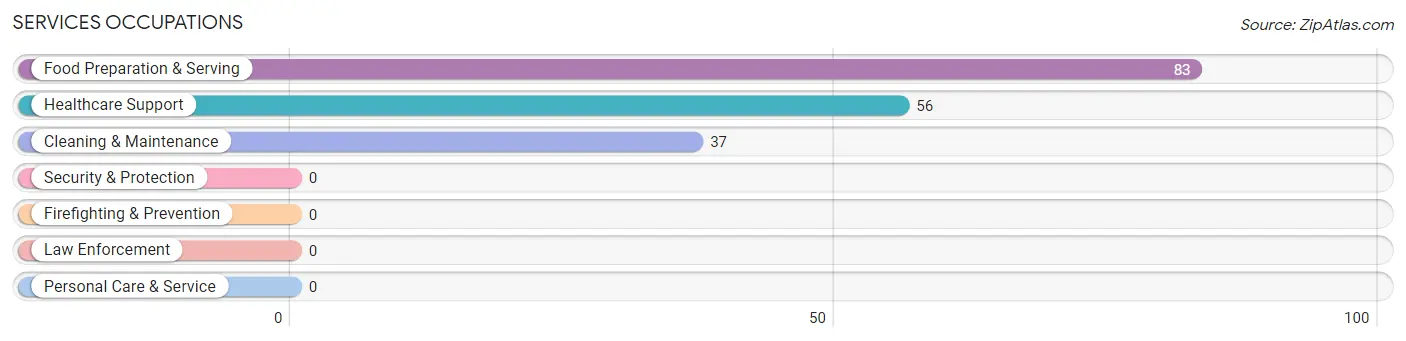
Services Occupations
The most common Services occupations in Batesville are Food Preparation & Serving (83 | 20.6%), Healthcare Support (56 | 13.9%), and Cleaning & Maintenance (37 | 9.2%).
Services Occupations by Sex
Within the Services occupations in Batesville, the most male-oriented occupations are Food Preparation & Serving (100.0%), and Cleaning & Maintenance (64.9%), while the most female-oriented occupations are Healthcare Support (100.0%), and Cleaning & Maintenance (35.1%).
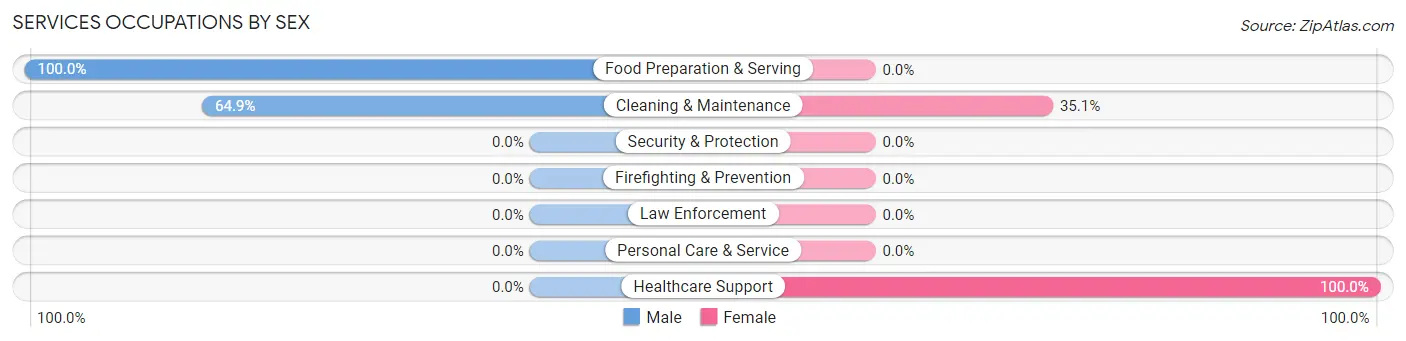
| Occupation | Male | Female |
| Healthcare Support | 0 (0.0%) | 56 (100.0%) |
| Security & Protection | 0 (0.0%) | 0 (0.0%) |
| Firefighting & Prevention | 0 (0.0%) | 0 (0.0%) |
| Law Enforcement | 0 (0.0%) | 0 (0.0%) |
| Food Preparation & Serving | 83 (100.0%) | 0 (0.0%) |
| Cleaning & Maintenance | 24 (64.9%) | 13 (35.1%) |
| Personal Care & Service | 0 (0.0%) | 0 (0.0%) |
| Total (Category) | 107 (60.8%) | 69 (39.2%) |
| Total (Overall) | 272 (67.5%) | 131 (32.5%) |
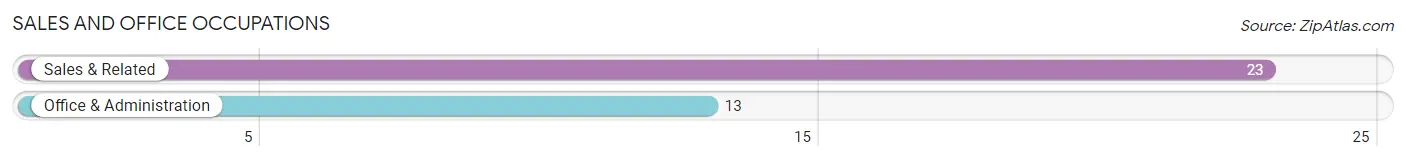
Sales and Office Occupations
The most common Sales and Office occupations in Batesville are Sales & Related (23 | 5.7%), and Office & Administration (13 | 3.2%).
Sales and Office Occupations by Sex

| Occupation | Male | Female |
| Sales & Related | 0 (0.0%) | 23 (100.0%) |
| Office & Administration | 13 (100.0%) | 0 (0.0%) |
| Total (Category) | 13 (36.1%) | 23 (63.9%) |
| Total (Overall) | 272 (67.5%) | 131 (32.5%) |
Natural Resources, Construction and Maintenance Occupations
The most common Natural Resources, Construction and Maintenance occupations in Batesville are Installation, Maintenance & Repair (54 | 13.4%), and Farming, Fishing & Forestry (50 | 12.4%).
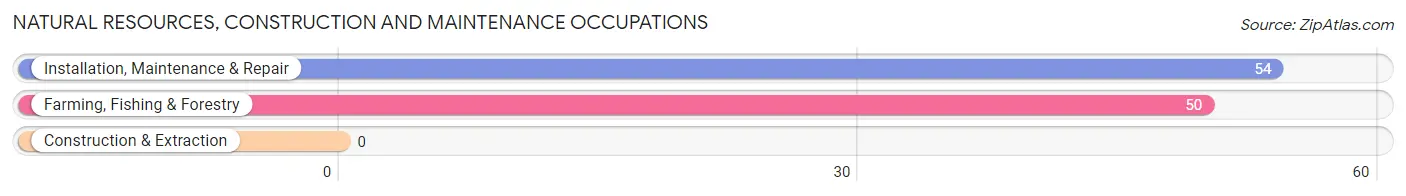
Natural Resources, Construction and Maintenance Occupations by Sex
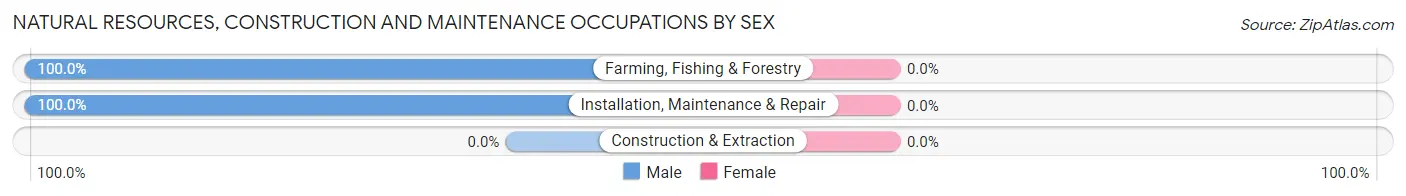
| Occupation | Male | Female |
| Farming, Fishing & Forestry | 50 (100.0%) | 0 (0.0%) |
| Construction & Extraction | 0 (0.0%) | 0 (0.0%) |
| Installation, Maintenance & Repair | 54 (100.0%) | 0 (0.0%) |
| Total (Category) | 104 (100.0%) | 0 (0.0%) |
| Total (Overall) | 272 (67.5%) | 131 (32.5%) |
Production, Transportation and Moving Occupations
The most common Production, Transportation and Moving occupations in Batesville are Material Moving (29 | 7.2%), and Transportation (19 | 4.7%).
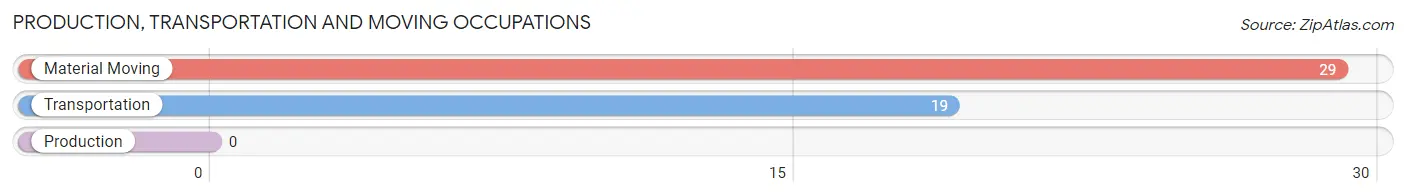
Production, Transportation and Moving Occupations by Sex
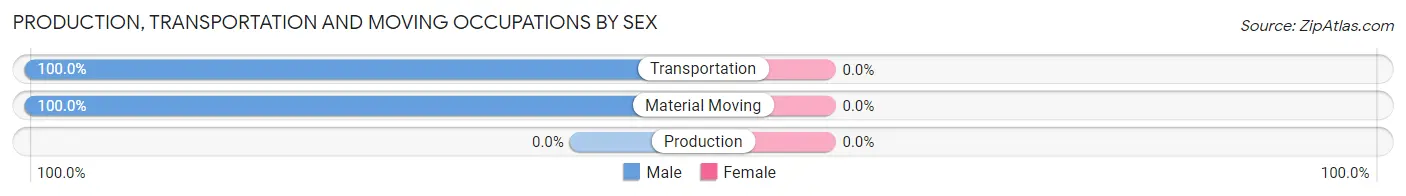
| Occupation | Male | Female |
| Production | 0 (0.0%) | 0 (0.0%) |
| Transportation | 19 (100.0%) | 0 (0.0%) |
| Material Moving | 29 (100.0%) | 0 (0.0%) |
| Total (Category) | 48 (100.0%) | 0 (0.0%) |
| Total (Overall) | 272 (67.5%) | 131 (32.5%) |
Employment Industries by Sex in Batesville
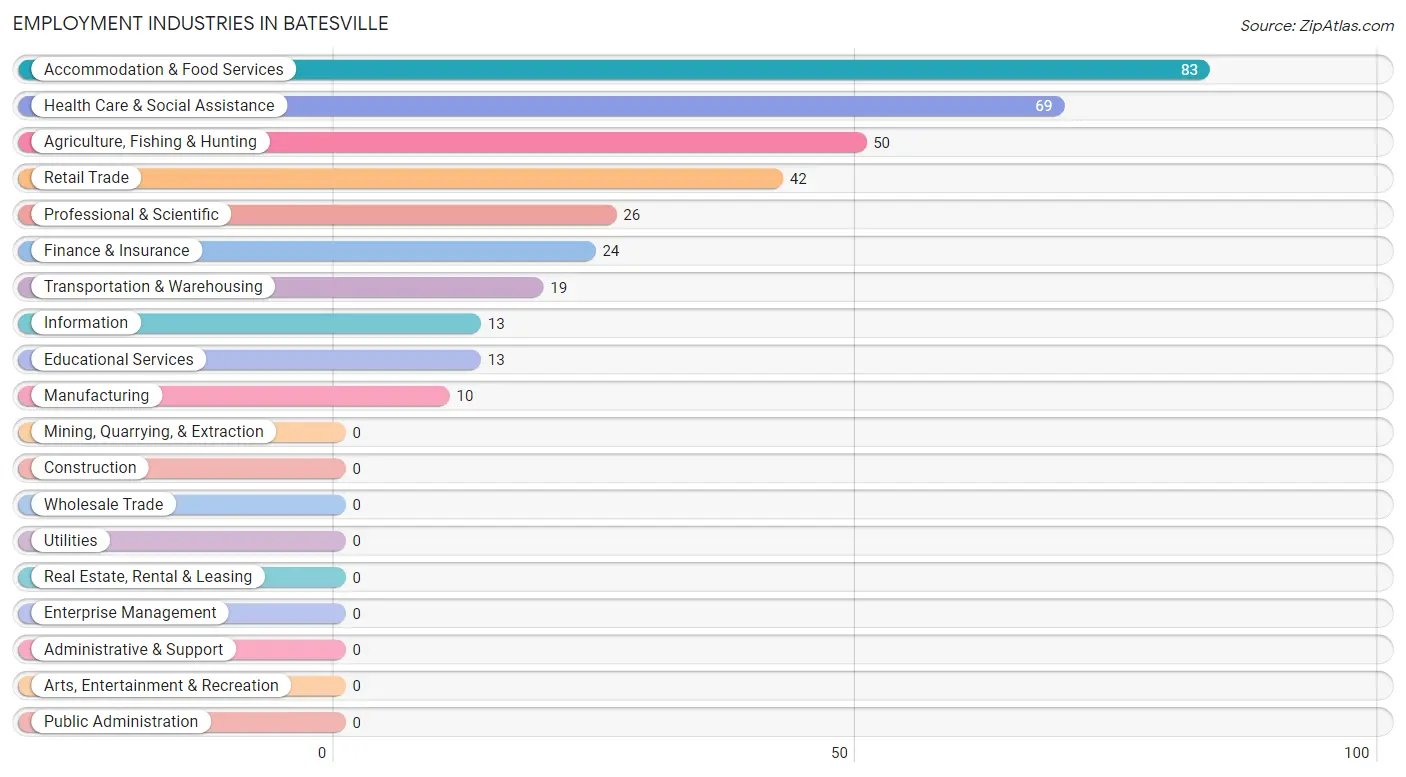
Employment Industries in Batesville
The major employment industries in Batesville include Accommodation & Food Services (83 | 20.6%), Health Care & Social Assistance (69 | 17.1%), Agriculture, Fishing & Hunting (50 | 12.4%), Retail Trade (42 | 10.4%), and Professional & Scientific (26 | 6.5%).
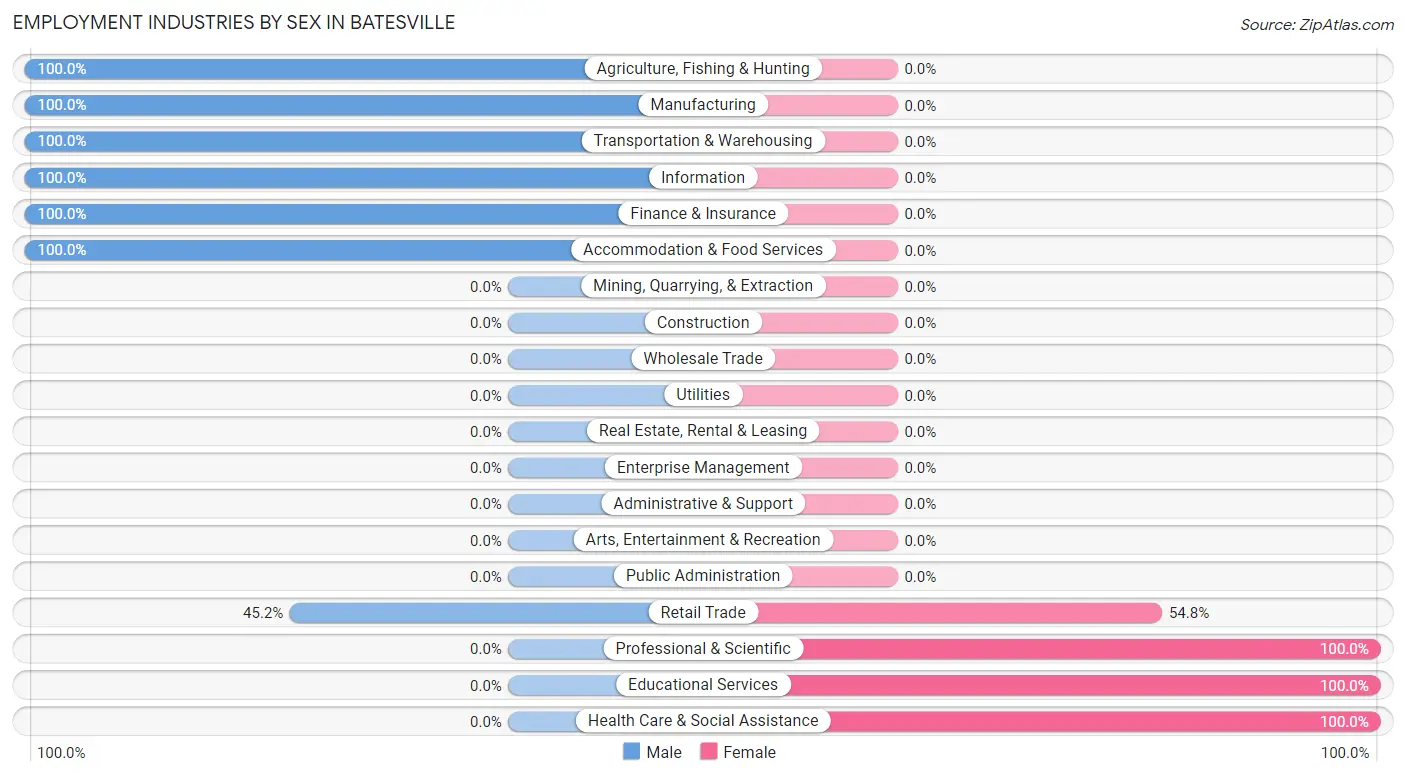
Employment Industries by Sex in Batesville
The Batesville industries that see more men than women are Agriculture, Fishing & Hunting (100.0%), Manufacturing (100.0%), and Transportation & Warehousing (100.0%), whereas the industries that tend to have a higher number of women are Professional & Scientific (100.0%), Educational Services (100.0%), and Health Care & Social Assistance (100.0%).
| Industry | Male | Female |
| Agriculture, Fishing & Hunting | 50 (100.0%) | 0 (0.0%) |
| Mining, Quarrying, & Extraction | 0 (0.0%) | 0 (0.0%) |
| Construction | 0 (0.0%) | 0 (0.0%) |
| Manufacturing | 10 (100.0%) | 0 (0.0%) |
| Wholesale Trade | 0 (0.0%) | 0 (0.0%) |
| Retail Trade | 19 (45.2%) | 23 (54.8%) |
| Transportation & Warehousing | 19 (100.0%) | 0 (0.0%) |
| Utilities | 0 (0.0%) | 0 (0.0%) |
| Information | 13 (100.0%) | 0 (0.0%) |
| Finance & Insurance | 24 (100.0%) | 0 (0.0%) |
| Real Estate, Rental & Leasing | 0 (0.0%) | 0 (0.0%) |
| Professional & Scientific | 0 (0.0%) | 26 (100.0%) |
| Enterprise Management | 0 (0.0%) | 0 (0.0%) |
| Administrative & Support | 0 (0.0%) | 0 (0.0%) |
| Educational Services | 0 (0.0%) | 13 (100.0%) |
| Health Care & Social Assistance | 0 (0.0%) | 69 (100.0%) |
| Arts, Entertainment & Recreation | 0 (0.0%) | 0 (0.0%) |
| Accommodation & Food Services | 83 (100.0%) | 0 (0.0%) |
| Public Administration | 0 (0.0%) | 0 (0.0%) |
| Total | 272 (67.5%) | 131 (32.5%) |
Education in Batesville
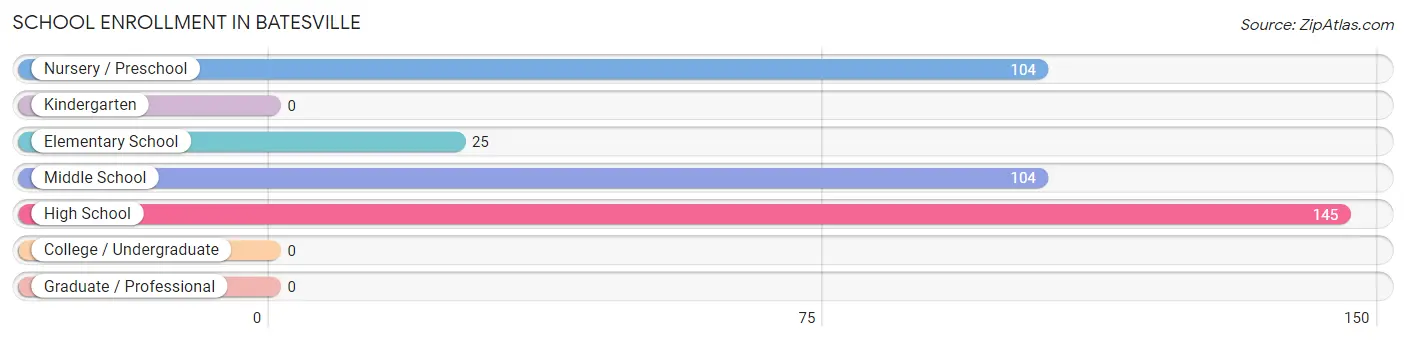
School Enrollment in Batesville
The most common levels of schooling among the 378 students in Batesville are high school (145 | 38.4%), nursery / preschool (104 | 27.5%), and middle school (104 | 27.5%).
| School Level | # Students | % Students |
| Nursery / Preschool | 104 | 27.5% |
| Kindergarten | 0 | 0.0% |
| Elementary School | 25 | 6.6% |
| Middle School | 104 | 27.5% |
| High School | 145 | 38.4% |
| College / Undergraduate | 0 | 0.0% |
| Graduate / Professional | 0 | 0.0% |
| Total | 378 | 100.0% |
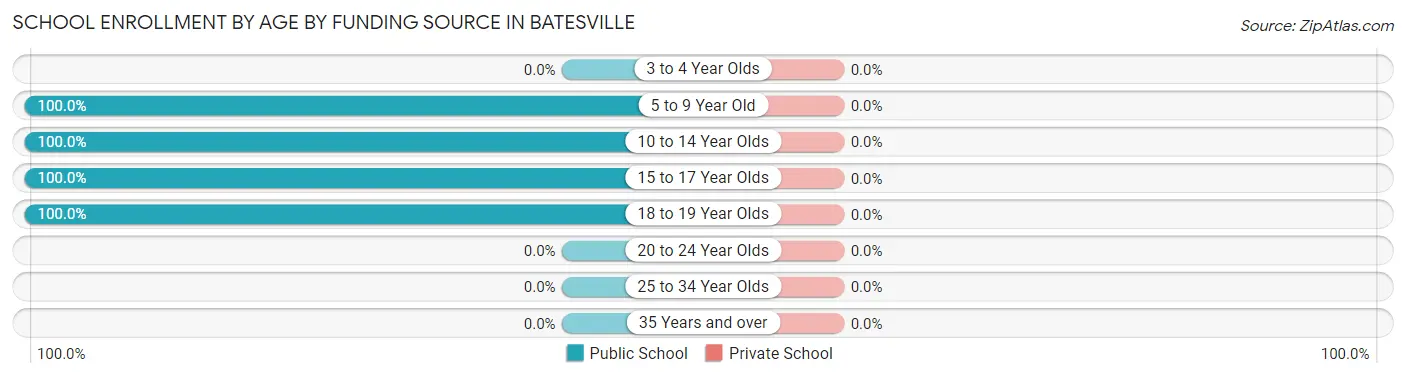
School Enrollment by Age by Funding Source in Batesville
| Age Bracket | Public School | Private School |
| 3 to 4 Year Olds | 0 (0.0%) | 0 (0.0%) |
| 5 to 9 Year Old | 129 (100.0%) | 0 (0.0%) |
| 10 to 14 Year Olds | 104 (100.0%) | 0 (0.0%) |
| 15 to 17 Year Olds | 62 (100.0%) | 0 (0.0%) |
| 18 to 19 Year Olds | 83 (100.0%) | 0 (0.0%) |
| 20 to 24 Year Olds | 0 (0.0%) | 0 (0.0%) |
| 25 to 34 Year Olds | 0 (0.0%) | 0 (0.0%) |
| 35 Years and over | 0 (0.0%) | 0 (0.0%) |
| Total | 378 (100.0%) | 0 (0.0%) |
Educational Attainment by Field of Study in Batesville
Social sciences (24 | 42.9%), education (19 | 33.9%), and business (13 | 23.2%) are the most common fields of study among 56 individuals in Batesville who have obtained a bachelor's degree or higher.
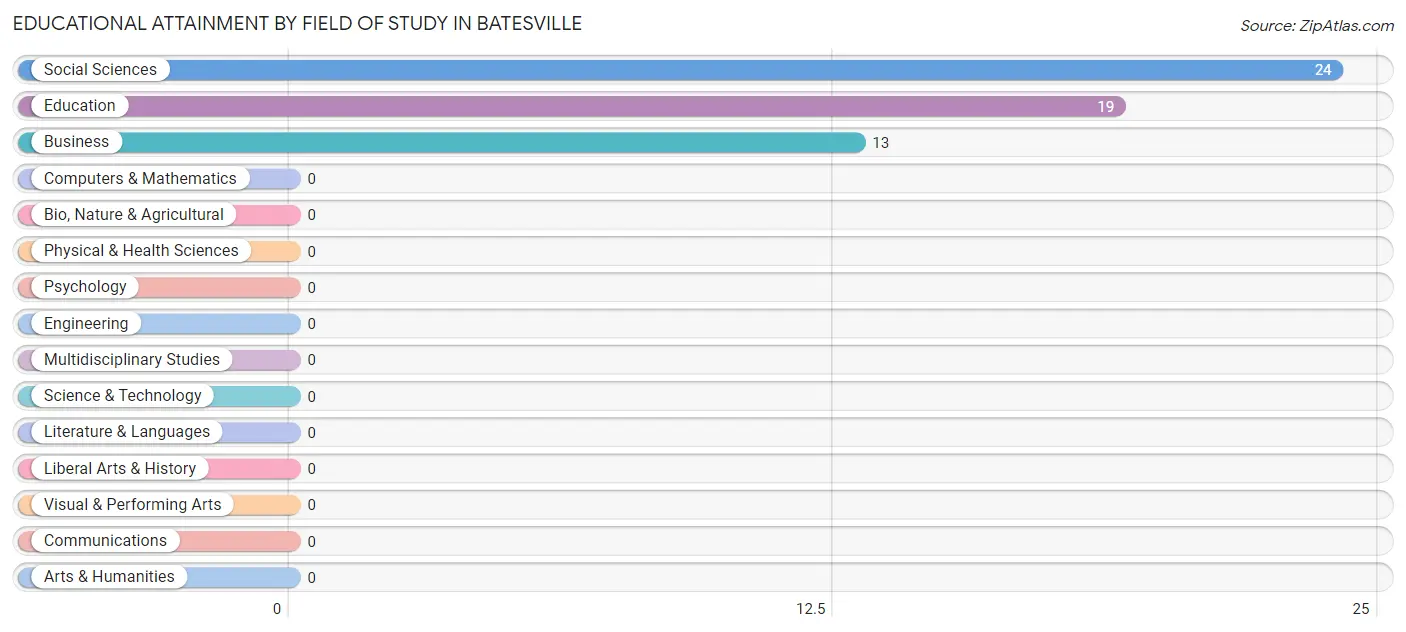
| Field of Study | # Graduates | % Graduates |
| Computers & Mathematics | 0 | 0.0% |
| Bio, Nature & Agricultural | 0 | 0.0% |
| Physical & Health Sciences | 0 | 0.0% |
| Psychology | 0 | 0.0% |
| Social Sciences | 24 | 42.9% |
| Engineering | 0 | 0.0% |
| Multidisciplinary Studies | 0 | 0.0% |
| Science & Technology | 0 | 0.0% |
| Business | 13 | 23.2% |
| Education | 19 | 33.9% |
| Literature & Languages | 0 | 0.0% |
| Liberal Arts & History | 0 | 0.0% |
| Visual & Performing Arts | 0 | 0.0% |
| Communications | 0 | 0.0% |
| Arts & Humanities | 0 | 0.0% |
| Total | 56 | 100.0% |
Transportation & Commute in Batesville
Vehicle Availability by Sex in Batesville
The most prevalent vehicle ownership categories in Batesville are males with 2 vehicles (141, accounting for 55.7%) and females with 2 vehicles (28, making up 107.6%).
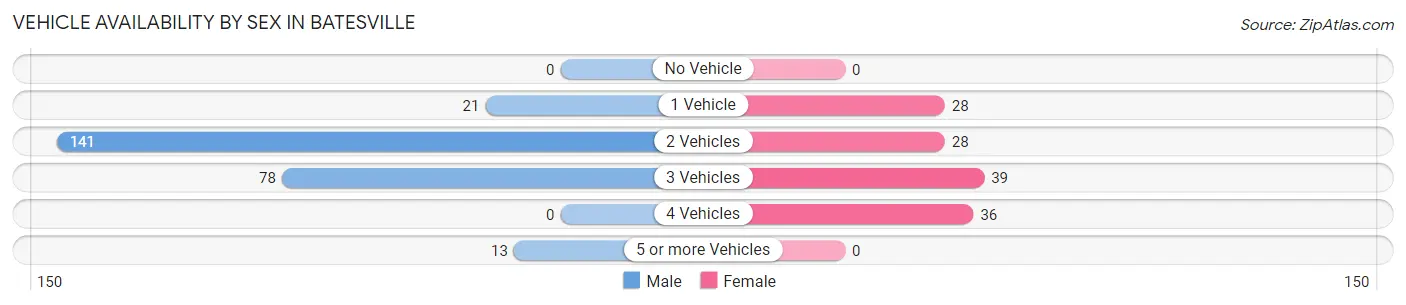
| Vehicles Available | Male | Female |
| No Vehicle | 0 (0.0%) | 0 (0.0%) |
| 1 Vehicle | 21 (8.3%) | 28 (21.4%) |
| 2 Vehicles | 141 (55.7%) | 28 (21.4%) |
| 3 Vehicles | 78 (30.8%) | 39 (29.8%) |
| 4 Vehicles | 0 (0.0%) | 36 (27.5%) |
| 5 or more Vehicles | 13 (5.1%) | 0 (0.0%) |
| Total | 253 (100.0%) | 131 (100.0%) |
Commute Time in Batesville
The most frequently occuring commute durations in Batesville are 5 to 9 minutes (123 commuters, 35.3%), 25 to 29 minutes (106 commuters, 30.5%), and 15 to 19 minutes (47 commuters, 13.5%).
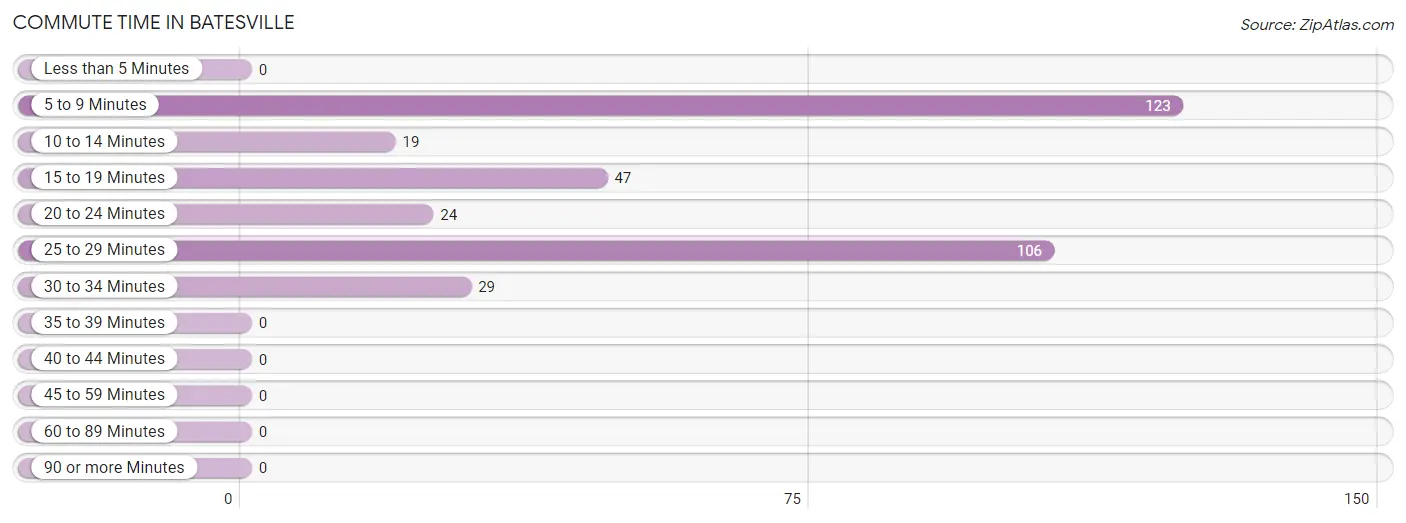
| Commute Time | # Commuters | % Commuters |
| Less than 5 Minutes | 0 | 0.0% |
| 5 to 9 Minutes | 123 | 35.3% |
| 10 to 14 Minutes | 19 | 5.5% |
| 15 to 19 Minutes | 47 | 13.5% |
| 20 to 24 Minutes | 24 | 6.9% |
| 25 to 29 Minutes | 106 | 30.5% |
| 30 to 34 Minutes | 29 | 8.3% |
| 35 to 39 Minutes | 0 | 0.0% |
| 40 to 44 Minutes | 0 | 0.0% |
| 45 to 59 Minutes | 0 | 0.0% |
| 60 to 89 Minutes | 0 | 0.0% |
| 90 or more Minutes | 0 | 0.0% |
Commute Time by Sex in Batesville
The most common commute times in Batesville are 25 to 29 minutes (83 commuters, 34.6%) for males and 5 to 9 minutes (59 commuters, 54.6%) for females.
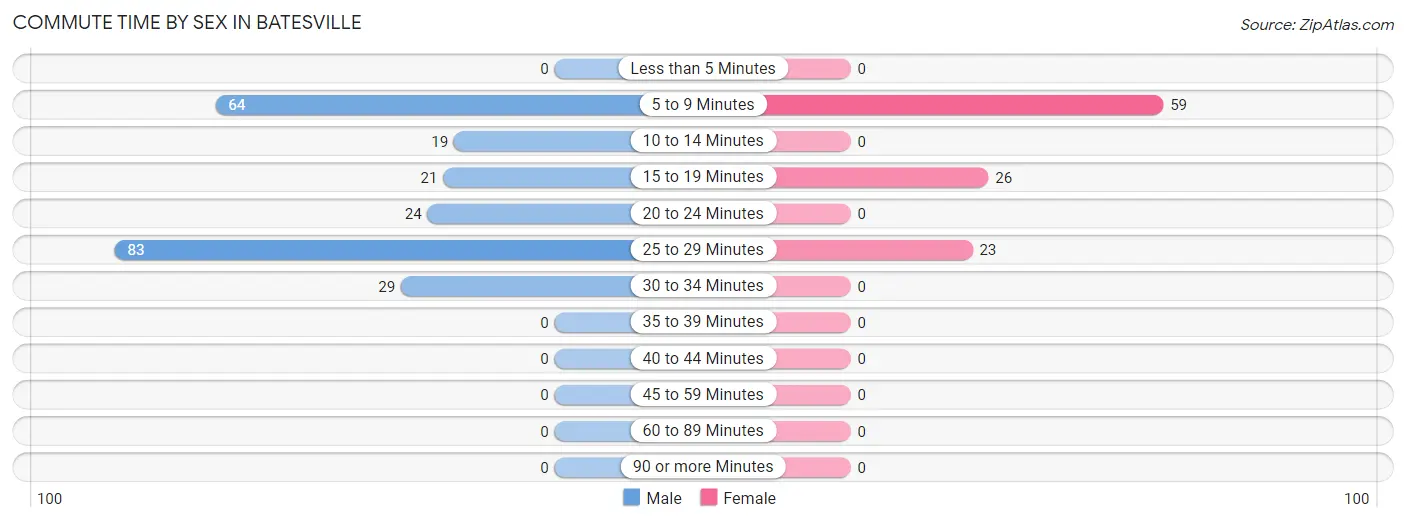
| Commute Time | Male | Female |
| Less than 5 Minutes | 0 (0.0%) | 0 (0.0%) |
| 5 to 9 Minutes | 64 (26.7%) | 59 (54.6%) |
| 10 to 14 Minutes | 19 (7.9%) | 0 (0.0%) |
| 15 to 19 Minutes | 21 (8.7%) | 26 (24.1%) |
| 20 to 24 Minutes | 24 (10.0%) | 0 (0.0%) |
| 25 to 29 Minutes | 83 (34.6%) | 23 (21.3%) |
| 30 to 34 Minutes | 29 (12.1%) | 0 (0.0%) |
| 35 to 39 Minutes | 0 (0.0%) | 0 (0.0%) |
| 40 to 44 Minutes | 0 (0.0%) | 0 (0.0%) |
| 45 to 59 Minutes | 0 (0.0%) | 0 (0.0%) |
| 60 to 89 Minutes | 0 (0.0%) | 0 (0.0%) |
| 90 or more Minutes | 0 (0.0%) | 0 (0.0%) |
Time of Departure to Work by Sex in Batesville
The most frequent times of departure to work in Batesville are 10:00 AM to 10:59 AM (83, 34.6%) for males and 7:30 AM to 7:59 AM (39, 36.1%) for females.
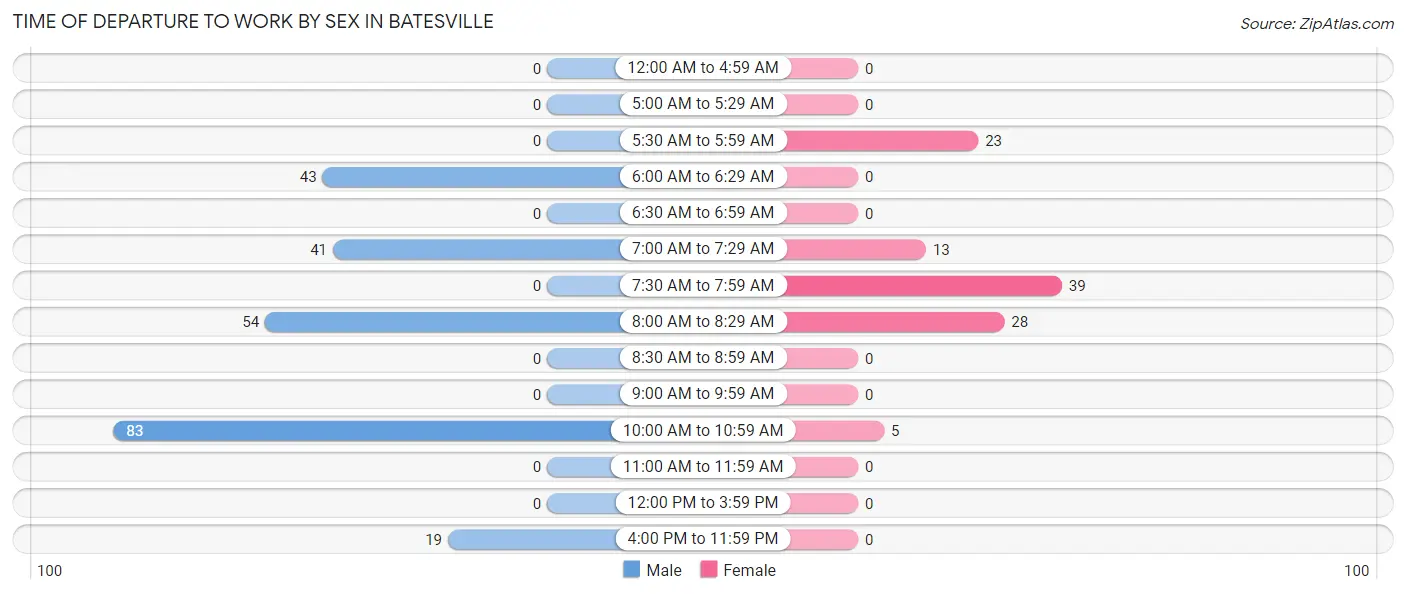
| Time of Departure | Male | Female |
| 12:00 AM to 4:59 AM | 0 (0.0%) | 0 (0.0%) |
| 5:00 AM to 5:29 AM | 0 (0.0%) | 0 (0.0%) |
| 5:30 AM to 5:59 AM | 0 (0.0%) | 23 (21.3%) |
| 6:00 AM to 6:29 AM | 43 (17.9%) | 0 (0.0%) |
| 6:30 AM to 6:59 AM | 0 (0.0%) | 0 (0.0%) |
| 7:00 AM to 7:29 AM | 41 (17.1%) | 13 (12.0%) |
| 7:30 AM to 7:59 AM | 0 (0.0%) | 39 (36.1%) |
| 8:00 AM to 8:29 AM | 54 (22.5%) | 28 (25.9%) |
| 8:30 AM to 8:59 AM | 0 (0.0%) | 0 (0.0%) |
| 9:00 AM to 9:59 AM | 0 (0.0%) | 0 (0.0%) |
| 10:00 AM to 10:59 AM | 83 (34.6%) | 5 (4.6%) |
| 11:00 AM to 11:59 AM | 0 (0.0%) | 0 (0.0%) |
| 12:00 PM to 3:59 PM | 0 (0.0%) | 0 (0.0%) |
| 4:00 PM to 11:59 PM | 19 (7.9%) | 0 (0.0%) |
| Total | 240 (100.0%) | 108 (100.0%) |
Housing Occupancy in Batesville
Occupancy by Ownership in Batesville
Of the total 284 dwellings in Batesville, owner-occupied units account for 212 (74.7%), while renter-occupied units make up 72 (25.4%).
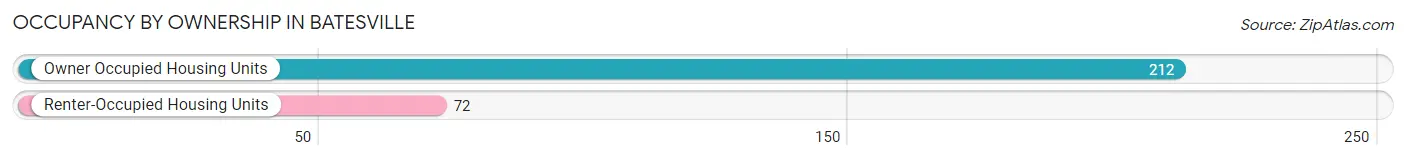
| Occupancy | # Housing Units | % Housing Units |
| Owner Occupied Housing Units | 212 | 74.7% |
| Renter-Occupied Housing Units | 72 | 25.4% |
| Total Occupied Housing Units | 284 | 100.0% |
Occupancy by Household Size in Batesville
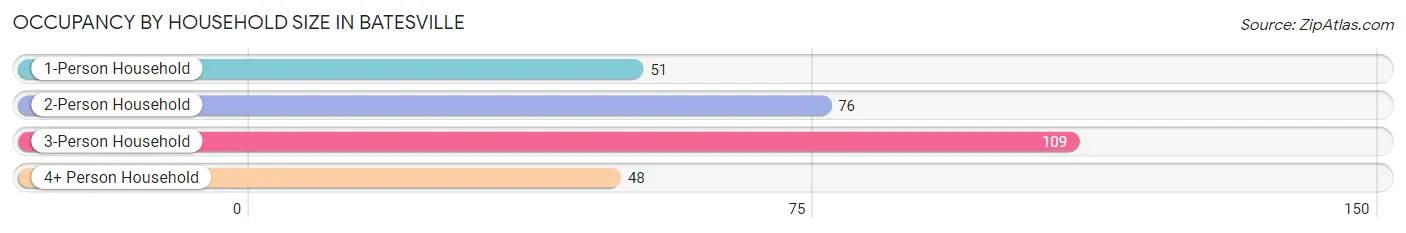
| Household Size | # Housing Units | % Housing Units |
| 1-Person Household | 51 | 18.0% |
| 2-Person Household | 76 | 26.8% |
| 3-Person Household | 109 | 38.4% |
| 4+ Person Household | 48 | 16.9% |
| Total Housing Units | 284 | 100.0% |
Occupancy by Ownership by Household Size in Batesville
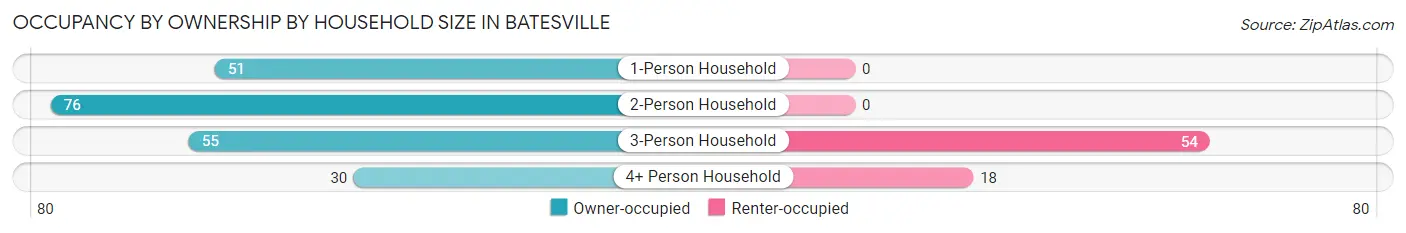
| Household Size | Owner-occupied | Renter-occupied |
| 1-Person Household | 51 (100.0%) | 0 (0.0%) |
| 2-Person Household | 76 (100.0%) | 0 (0.0%) |
| 3-Person Household | 55 (50.5%) | 54 (49.5%) |
| 4+ Person Household | 30 (62.5%) | 18 (37.5%) |
| Total Housing Units | 212 (74.7%) | 72 (25.4%) |
Occupancy by Educational Attainment in Batesville
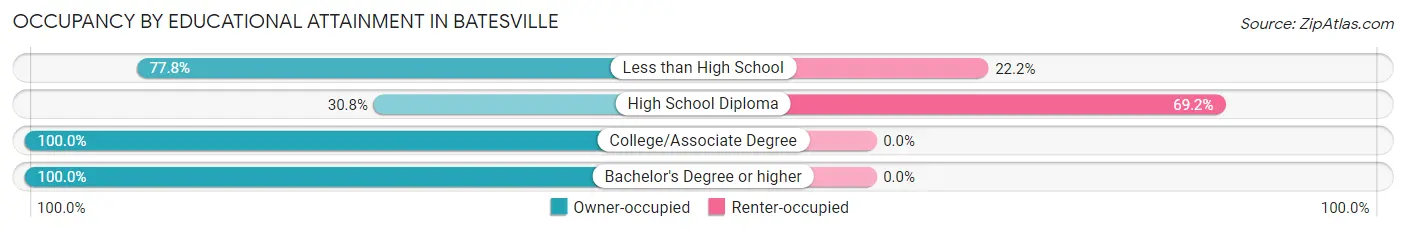
| Household Size | Owner-occupied | Renter-occupied |
| Less than High School | 63 (77.8%) | 18 (22.2%) |
| High School Diploma | 24 (30.8%) | 54 (69.2%) |
| College/Associate Degree | 82 (100.0%) | 0 (0.0%) |
| Bachelor's Degree or higher | 43 (100.0%) | 0 (0.0%) |
Occupancy by Age of Householder in Batesville
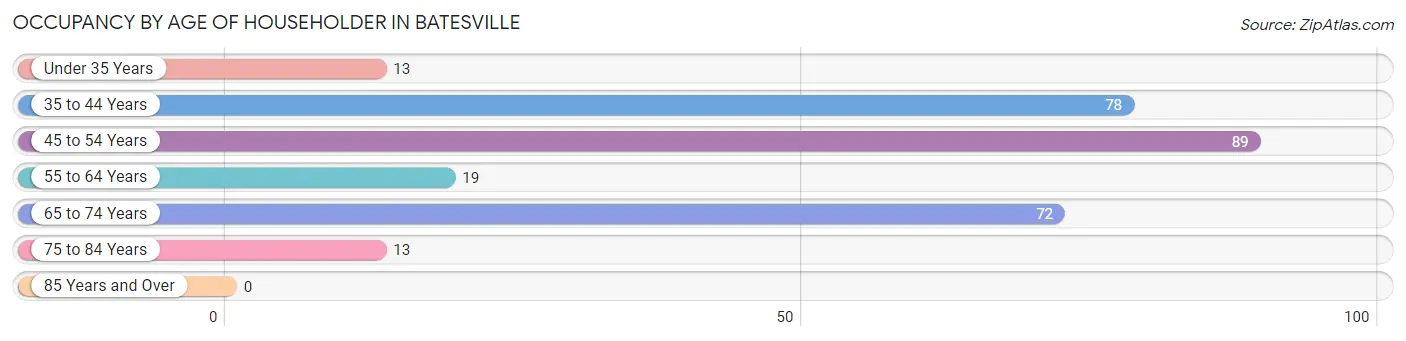
| Age Bracket | # Households | % Households |
| Under 35 Years | 13 | 4.6% |
| 35 to 44 Years | 78 | 27.5% |
| 45 to 54 Years | 89 | 31.3% |
| 55 to 64 Years | 19 | 6.7% |
| 65 to 74 Years | 72 | 25.4% |
| 75 to 84 Years | 13 | 4.6% |
| 85 Years and Over | 0 | 0.0% |
| Total | 284 | 100.0% |
Housing Finances in Batesville
Median Income by Occupancy in Batesville
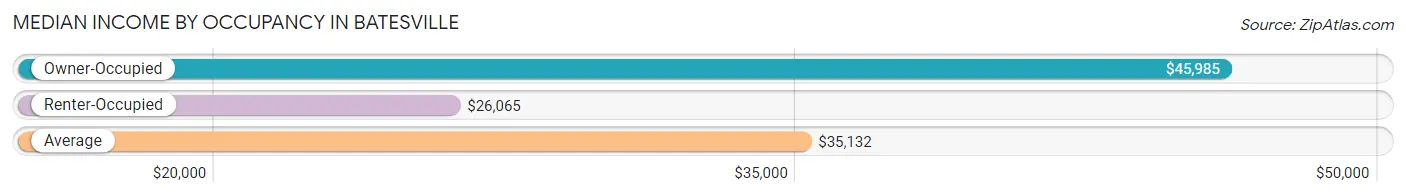
| Occupancy Type | # Households | Median Income |
| Owner-Occupied | 212 (74.7%) | $45,985 |
| Renter-Occupied | 72 (25.4%) | $26,065 |
| Average | 284 (100.0%) | $35,132 |
Occupancy by Householder Income Bracket in Batesville
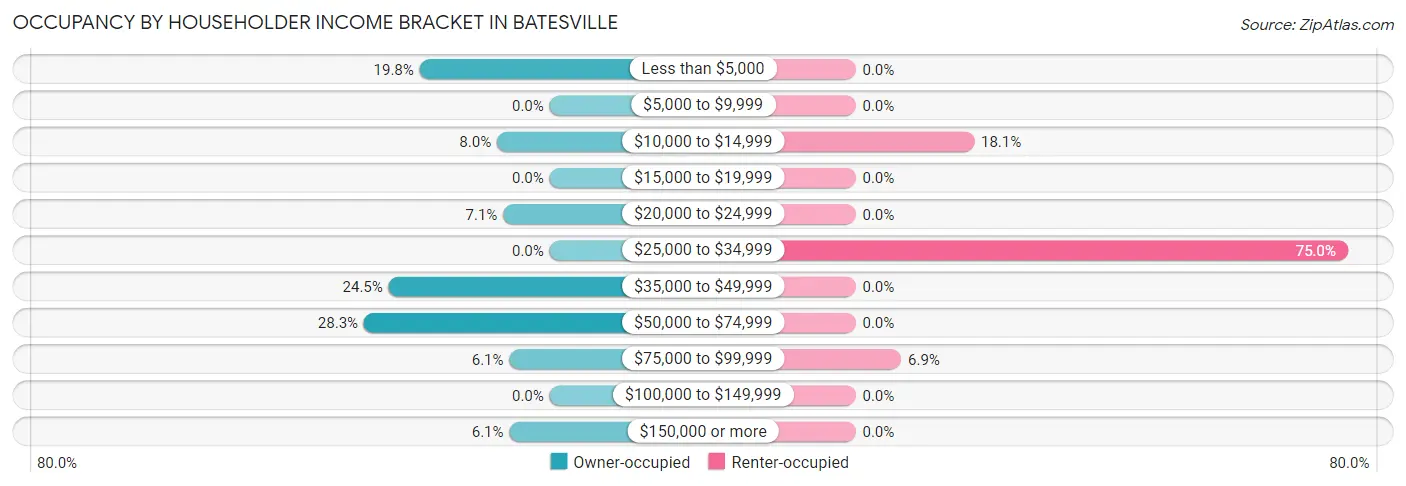
| Income Bracket | Owner-occupied | Renter-occupied |
| Less than $5,000 | 42 (19.8%) | 0 (0.0%) |
| $5,000 to $9,999 | 0 (0.0%) | 0 (0.0%) |
| $10,000 to $14,999 | 17 (8.0%) | 13 (18.1%) |
| $15,000 to $19,999 | 0 (0.0%) | 0 (0.0%) |
| $20,000 to $24,999 | 15 (7.1%) | 0 (0.0%) |
| $25,000 to $34,999 | 0 (0.0%) | 54 (75.0%) |
| $35,000 to $49,999 | 52 (24.5%) | 0 (0.0%) |
| $50,000 to $74,999 | 60 (28.3%) | 0 (0.0%) |
| $75,000 to $99,999 | 13 (6.1%) | 5 (6.9%) |
| $100,000 to $149,999 | 0 (0.0%) | 0 (0.0%) |
| $150,000 or more | 13 (6.1%) | 0 (0.0%) |
| Total | 212 (100.0%) | 72 (100.0%) |
Monthly Housing Cost Tiers in Batesville
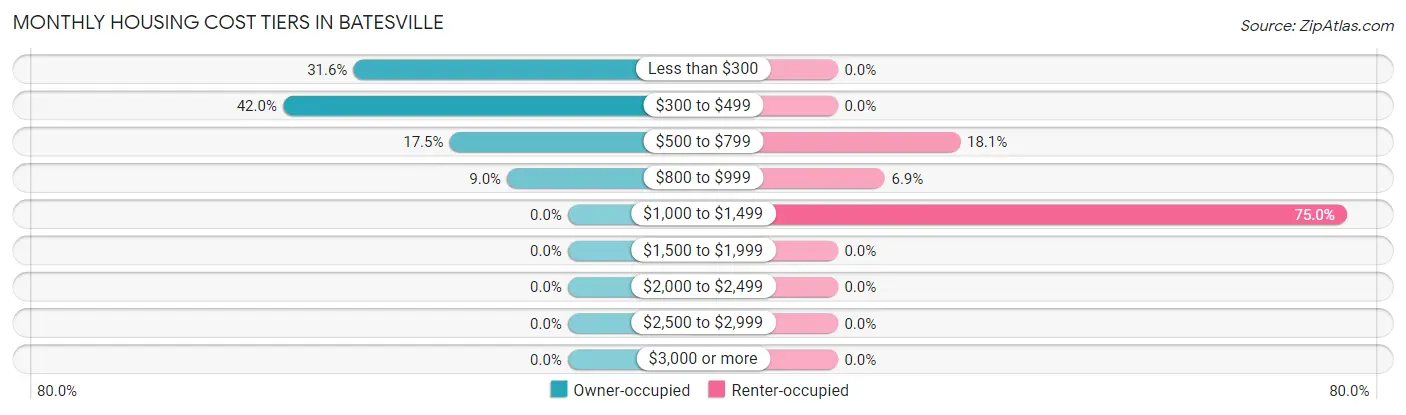
| Monthly Cost | Owner-occupied | Renter-occupied |
| Less than $300 | 67 (31.6%) | 0 (0.0%) |
| $300 to $499 | 89 (42.0%) | 0 (0.0%) |
| $500 to $799 | 37 (17.4%) | 13 (18.1%) |
| $800 to $999 | 19 (9.0%) | 5 (6.9%) |
| $1,000 to $1,499 | 0 (0.0%) | 54 (75.0%) |
| $1,500 to $1,999 | 0 (0.0%) | 0 (0.0%) |
| $2,000 to $2,499 | 0 (0.0%) | 0 (0.0%) |
| $2,500 to $2,999 | 0 (0.0%) | 0 (0.0%) |
| $3,000 or more | 0 (0.0%) | 0 (0.0%) |
| Total | 212 (100.0%) | 72 (100.0%) |
Physical Housing Characteristics in Batesville
Housing Structures in Batesville
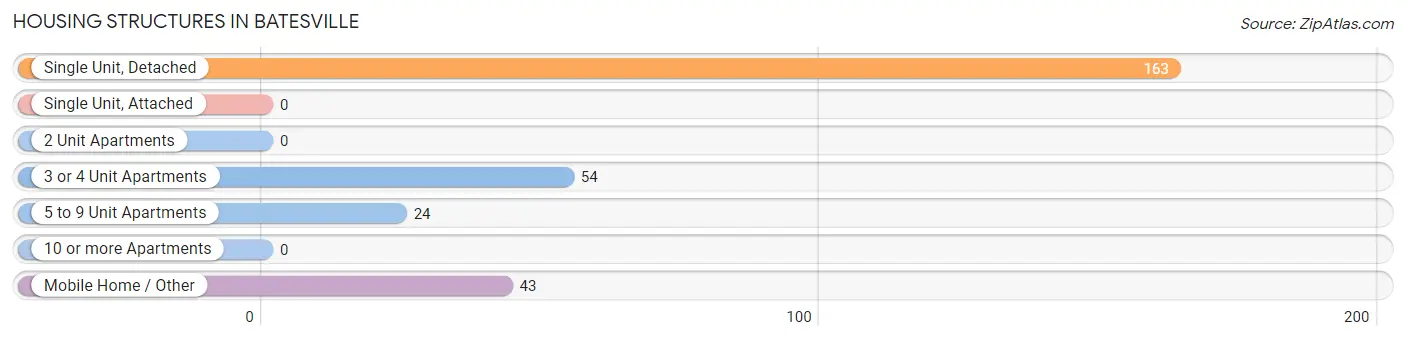
| Structure Type | # Housing Units | % Housing Units |
| Single Unit, Detached | 163 | 57.4% |
| Single Unit, Attached | 0 | 0.0% |
| 2 Unit Apartments | 0 | 0.0% |
| 3 or 4 Unit Apartments | 54 | 19.0% |
| 5 to 9 Unit Apartments | 24 | 8.5% |
| 10 or more Apartments | 0 | 0.0% |
| Mobile Home / Other | 43 | 15.1% |
| Total | 284 | 100.0% |
Housing Structures by Occupancy in Batesville
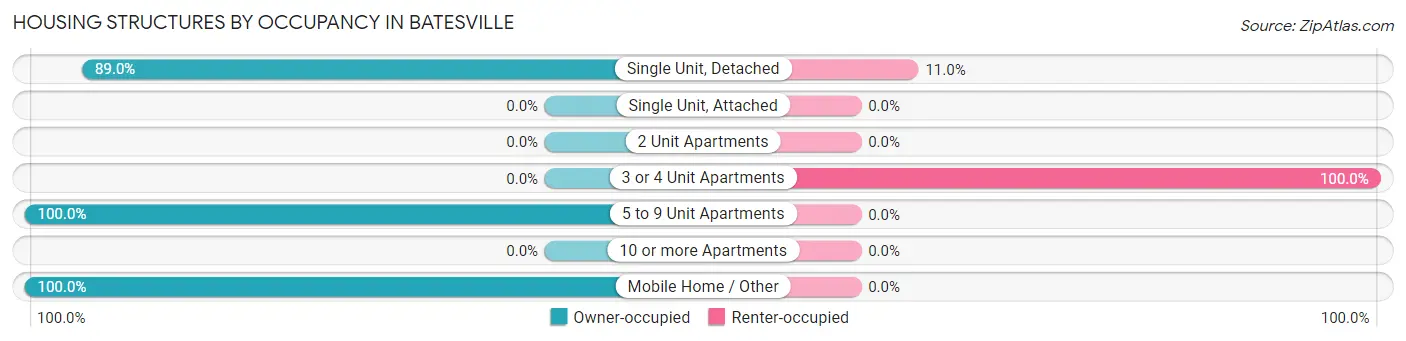
| Structure Type | Owner-occupied | Renter-occupied |
| Single Unit, Detached | 145 (89.0%) | 18 (11.0%) |
| Single Unit, Attached | 0 (0.0%) | 0 (0.0%) |
| 2 Unit Apartments | 0 (0.0%) | 0 (0.0%) |
| 3 or 4 Unit Apartments | 0 (0.0%) | 54 (100.0%) |
| 5 to 9 Unit Apartments | 24 (100.0%) | 0 (0.0%) |
| 10 or more Apartments | 0 (0.0%) | 0 (0.0%) |
| Mobile Home / Other | 43 (100.0%) | 0 (0.0%) |
| Total | 212 (74.7%) | 72 (25.4%) |
Housing Structures by Number of Rooms in Batesville
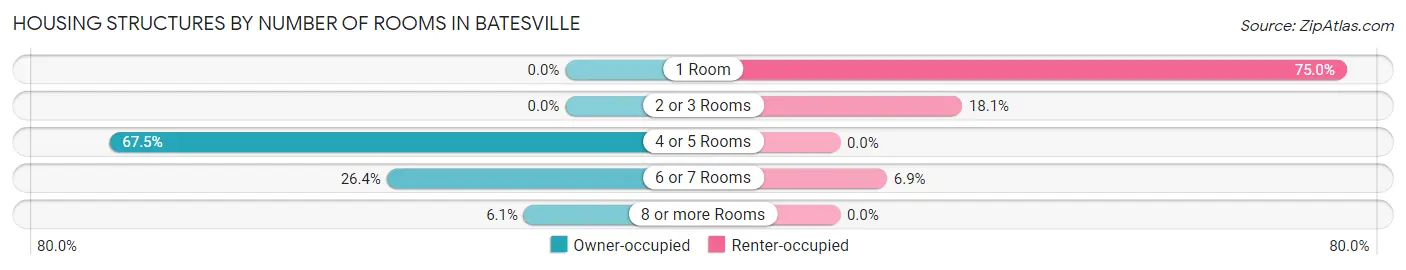
| Number of Rooms | Owner-occupied | Renter-occupied |
| 1 Room | 0 (0.0%) | 54 (75.0%) |
| 2 or 3 Rooms | 0 (0.0%) | 13 (18.1%) |
| 4 or 5 Rooms | 143 (67.4%) | 0 (0.0%) |
| 6 or 7 Rooms | 56 (26.4%) | 5 (6.9%) |
| 8 or more Rooms | 13 (6.1%) | 0 (0.0%) |
| Total | 212 (100.0%) | 72 (100.0%) |
Housing Structure by Heating Type in Batesville
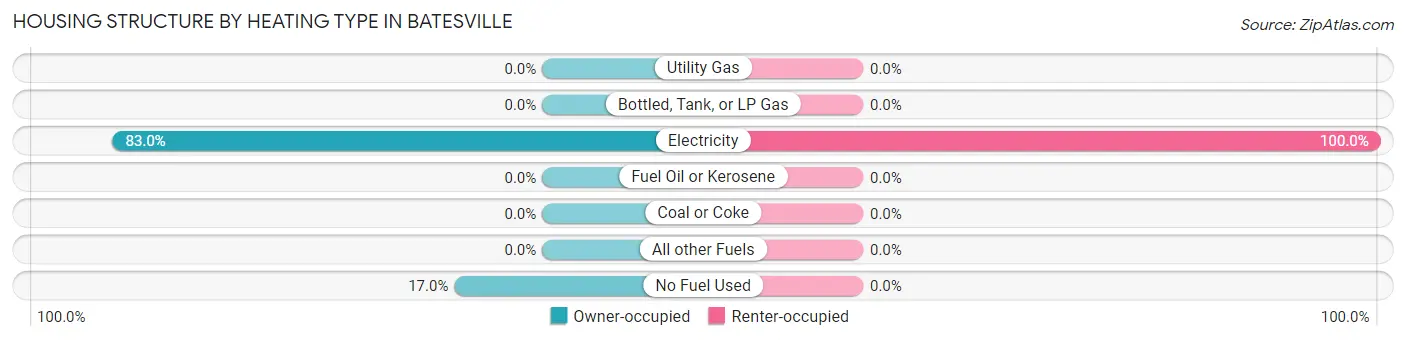
| Heating Type | Owner-occupied | Renter-occupied |
| Utility Gas | 0 (0.0%) | 0 (0.0%) |
| Bottled, Tank, or LP Gas | 0 (0.0%) | 0 (0.0%) |
| Electricity | 176 (83.0%) | 72 (100.0%) |
| Fuel Oil or Kerosene | 0 (0.0%) | 0 (0.0%) |
| Coal or Coke | 0 (0.0%) | 0 (0.0%) |
| All other Fuels | 0 (0.0%) | 0 (0.0%) |
| No Fuel Used | 36 (17.0%) | 0 (0.0%) |
| Total | 212 (100.0%) | 72 (100.0%) |
Household Vehicle Usage in Batesville
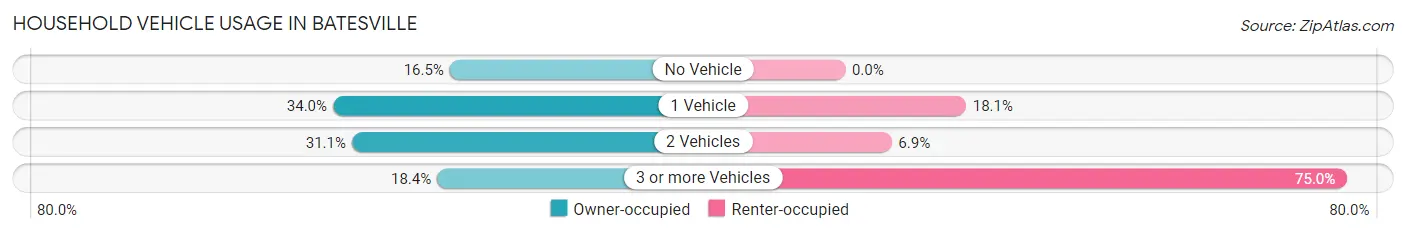
| Vehicles per Household | Owner-occupied | Renter-occupied |
| No Vehicle | 35 (16.5%) | 0 (0.0%) |
| 1 Vehicle | 72 (34.0%) | 13 (18.1%) |
| 2 Vehicles | 66 (31.1%) | 5 (6.9%) |
| 3 or more Vehicles | 39 (18.4%) | 54 (75.0%) |
| Total | 212 (100.0%) | 72 (100.0%) |
Real Estate & Mortgages in Batesville
Real Estate and Mortgage Overview in Batesville
| Characteristic | Without Mortgage | With Mortgage |
| Housing Units | 156 | 56 |
| Median Property Value | $35,700 | $0 |
| Median Household Income | $46,607 | $0 |
| Monthly Housing Costs | $312 | $0 |
| Real Estate Taxes | $612 | $0 |
Property Value by Mortgage Status in Batesville
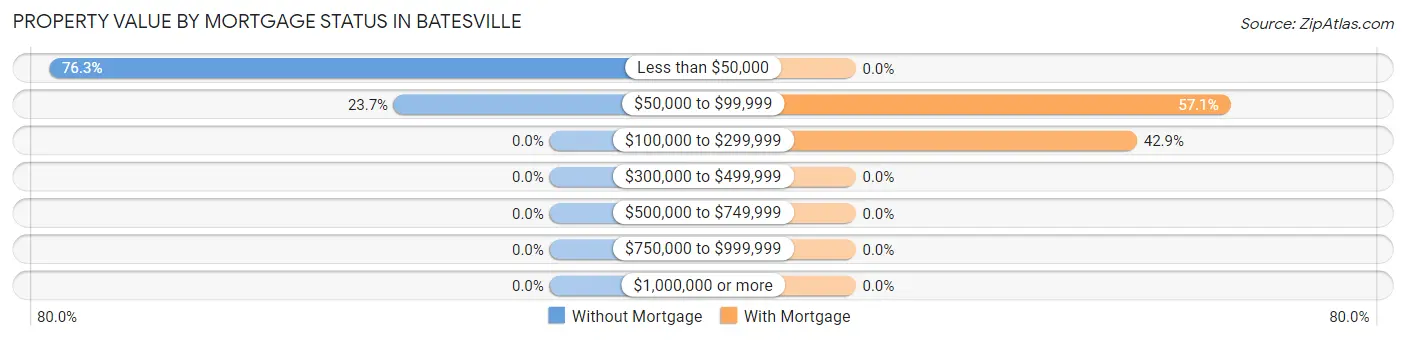
| Property Value | Without Mortgage | With Mortgage |
| Less than $50,000 | 119 (76.3%) | 0 (0.0%) |
| $50,000 to $99,999 | 37 (23.7%) | 32 (57.1%) |
| $100,000 to $299,999 | 0 (0.0%) | 24 (42.9%) |
| $300,000 to $499,999 | 0 (0.0%) | 0 (0.0%) |
| $500,000 to $749,999 | 0 (0.0%) | 0 (0.0%) |
| $750,000 to $999,999 | 0 (0.0%) | 0 (0.0%) |
| $1,000,000 or more | 0 (0.0%) | 0 (0.0%) |
| Total | 156 (100.0%) | 56 (100.0%) |
Household Income by Mortgage Status in Batesville
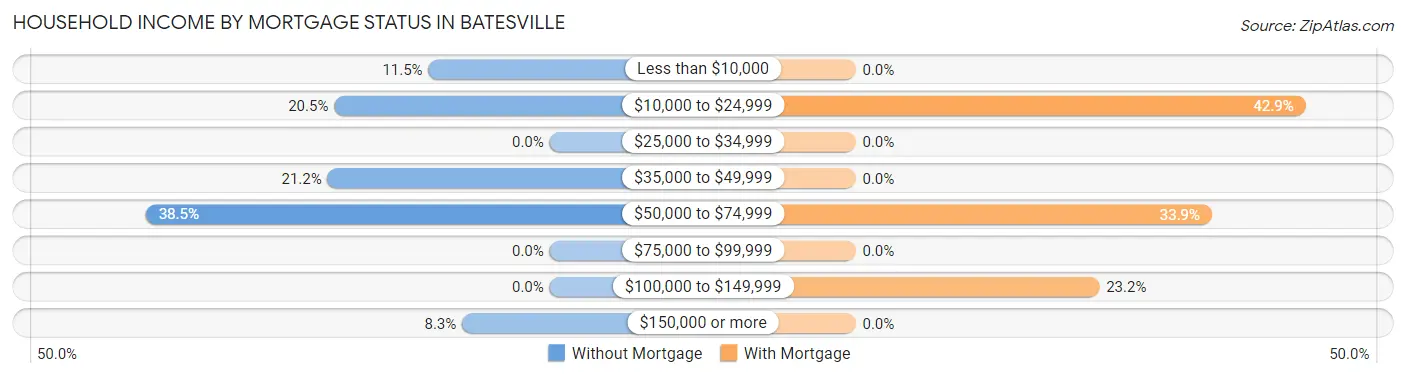
| Household Income | Without Mortgage | With Mortgage |
| Less than $10,000 | 18 (11.5%) | 0 (0.0%) |
| $10,000 to $24,999 | 32 (20.5%) | 24 (42.9%) |
| $25,000 to $34,999 | 0 (0.0%) | 0 (0.0%) |
| $35,000 to $49,999 | 33 (21.1%) | 0 (0.0%) |
| $50,000 to $74,999 | 60 (38.5%) | 19 (33.9%) |
| $75,000 to $99,999 | 0 (0.0%) | 0 (0.0%) |
| $100,000 to $149,999 | 0 (0.0%) | 13 (23.2%) |
| $150,000 or more | 13 (8.3%) | 0 (0.0%) |
| Total | 156 (100.0%) | 56 (100.0%) |
Property Value to Household Income Ratio in Batesville
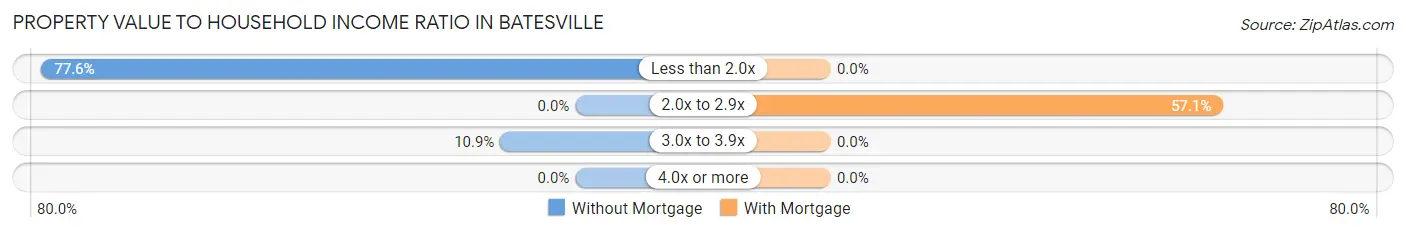
| Value-to-Income Ratio | Without Mortgage | With Mortgage |
| Less than 2.0x | 121 (77.6%) | 0 (0.0%) |
| 2.0x to 2.9x | 0 (0.0%) | 32 (57.1%) |
| 3.0x to 3.9x | 17 (10.9%) | 0 (0.0%) |
| 4.0x or more | 0 (0.0%) | 0 (0.0%) |
| Total | 156 (100.0%) | 56 (100.0%) |
Real Estate Taxes by Mortgage Status in Batesville
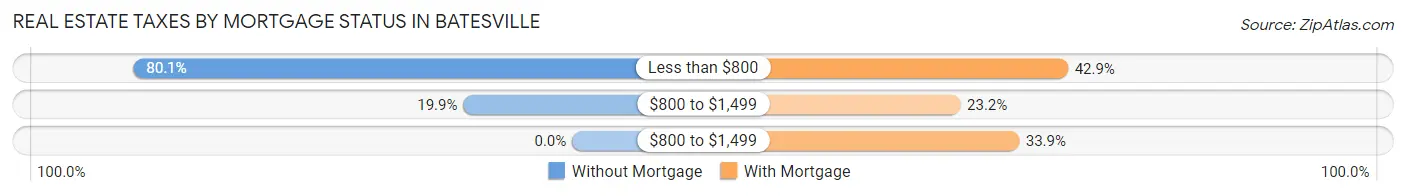
| Property Taxes | Without Mortgage | With Mortgage |
| Less than $800 | 125 (80.1%) | 24 (42.9%) |
| $800 to $1,499 | 31 (19.9%) | 13 (23.2%) |
| $800 to $1,499 | 0 (0.0%) | 19 (33.9%) |
| Total | 156 (100.0%) | 56 (100.0%) |
Health & Disability in Batesville
Health Insurance Coverage by Age in Batesville
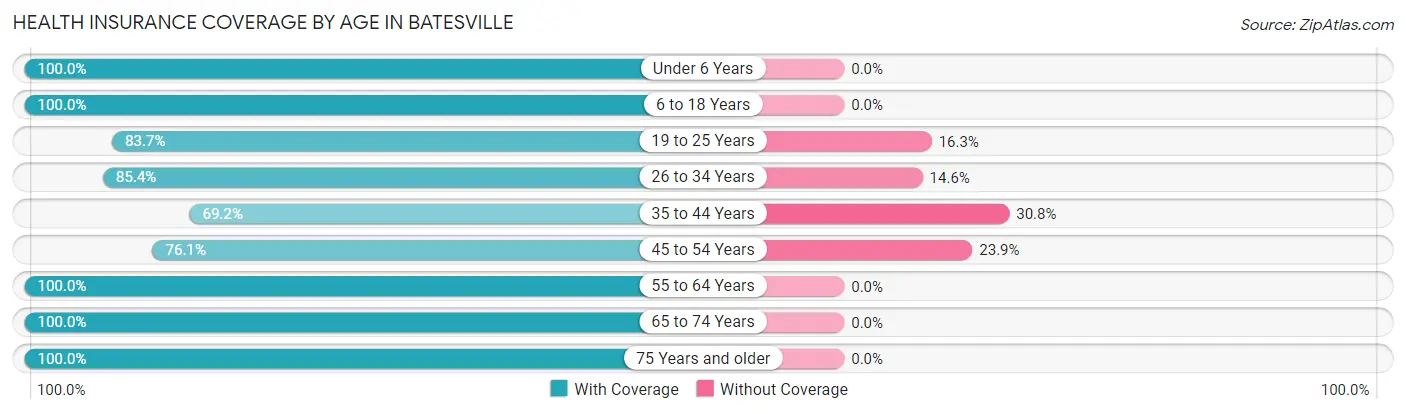
| Age Bracket | With Coverage | Without Coverage |
| Under 6 Years | 238 (100.0%) | 0 (0.0%) |
| 6 to 18 Years | 274 (100.0%) | 0 (0.0%) |
| 19 to 25 Years | 77 (83.7%) | 15 (16.3%) |
| 26 to 34 Years | 76 (85.4%) | 13 (14.6%) |
| 35 to 44 Years | 54 (69.2%) | 24 (30.8%) |
| 45 to 54 Years | 153 (76.1%) | 48 (23.9%) |
| 55 to 64 Years | 40 (100.0%) | 0 (0.0%) |
| 65 to 74 Years | 99 (100.0%) | 0 (0.0%) |
| 75 Years and older | 13 (100.0%) | 0 (0.0%) |
| Total | 1,024 (91.1%) | 100 (8.9%) |
Health Insurance Coverage by Citizenship Status in Batesville
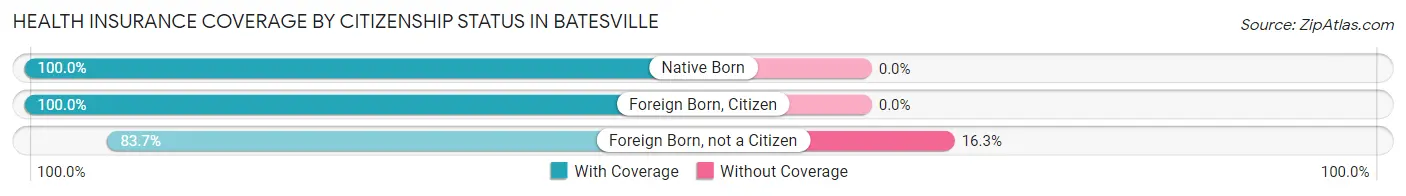
| Citizenship Status | With Coverage | Without Coverage |
| Native Born | 238 (100.0%) | 0 (0.0%) |
| Foreign Born, Citizen | 274 (100.0%) | 0 (0.0%) |
| Foreign Born, not a Citizen | 77 (83.7%) | 15 (16.3%) |
Health Insurance Coverage by Household Income in Batesville
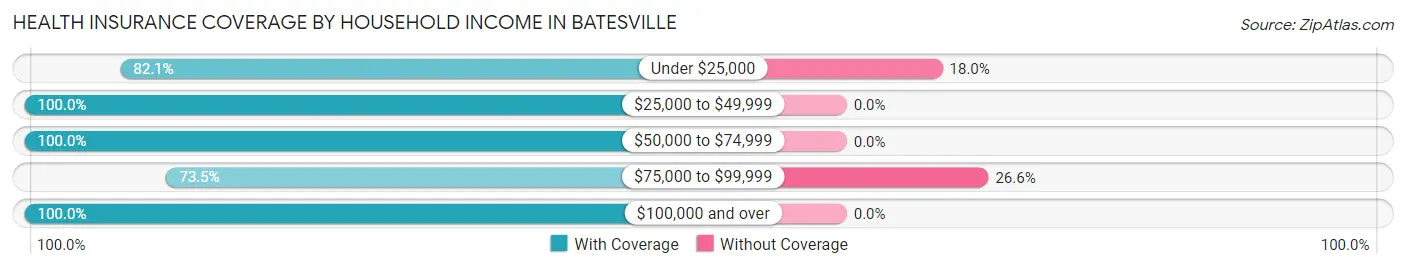
| Household Income | With Coverage | Without Coverage |
| Under $25,000 | 320 (82.1%) | 70 (17.9%) |
| $25,000 to $49,999 | 383 (100.0%) | 0 (0.0%) |
| $50,000 to $74,999 | 212 (100.0%) | 0 (0.0%) |
| $75,000 to $99,999 | 83 (73.5%) | 30 (26.6%) |
| $100,000 and over | 26 (100.0%) | 0 (0.0%) |
Public vs Private Health Insurance Coverage by Age in Batesville
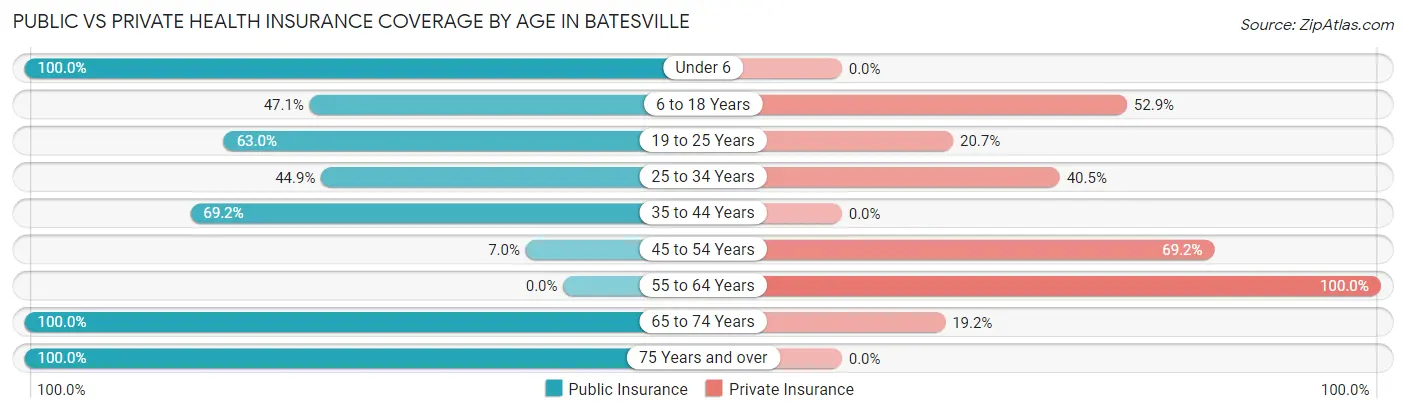
| Age Bracket | Public Insurance | Private Insurance |
| Under 6 | 238 (100.0%) | 0 (0.0%) |
| 6 to 18 Years | 129 (47.1%) | 145 (52.9%) |
| 19 to 25 Years | 58 (63.0%) | 19 (20.6%) |
| 25 to 34 Years | 40 (44.9%) | 36 (40.5%) |
| 35 to 44 Years | 54 (69.2%) | 0 (0.0%) |
| 45 to 54 Years | 14 (7.0%) | 139 (69.2%) |
| 55 to 64 Years | 0 (0.0%) | 40 (100.0%) |
| 65 to 74 Years | 99 (100.0%) | 19 (19.2%) |
| 75 Years and over | 13 (100.0%) | 0 (0.0%) |
| Total | 645 (57.4%) | 398 (35.4%) |
Disability Status by Sex by Age in Batesville
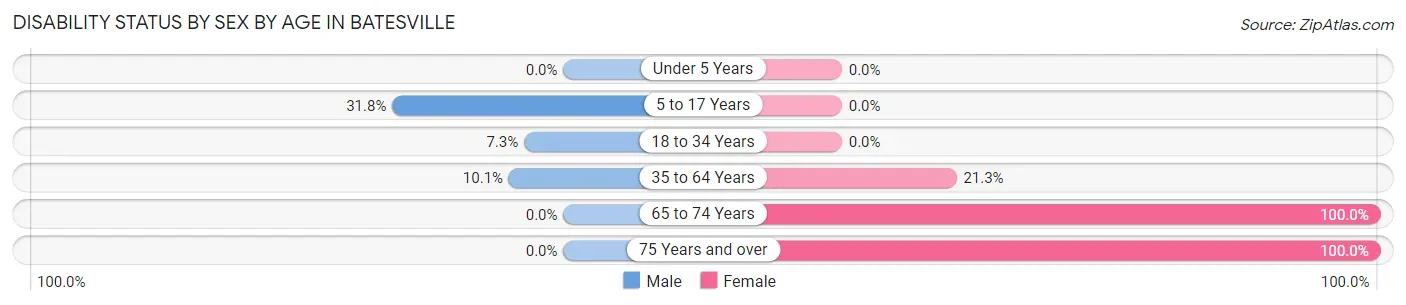
| Age Bracket | Male | Female |
| Under 5 Years | 0 (0.0%) | 0 (0.0%) |
| 5 to 17 Years | 81 (31.8%) | 0 (0.0%) |
| 18 to 34 Years | 10 (7.3%) | 0 (0.0%) |
| 35 to 64 Years | 18 (10.1%) | 30 (21.3%) |
| 65 to 74 Years | 0 (0.0%) | 63 (100.0%) |
| 75 Years and over | 0 (0.0%) | 13 (100.0%) |
Disability Class by Sex by Age in Batesville
Disability Class: Hearing Difficulty
| Age Bracket | Male | Female |
| Under 5 Years | 0 (0.0%) | 0 (0.0%) |
| 5 to 17 Years | 0 (0.0%) | 0 (0.0%) |
| 18 to 34 Years | 0 (0.0%) | 0 (0.0%) |
| 35 to 64 Years | 0 (0.0%) | 0 (0.0%) |
| 65 to 74 Years | 0 (0.0%) | 0 (0.0%) |
| 75 Years and over | 0 (0.0%) | 0 (0.0%) |
Disability Class: Vision Difficulty
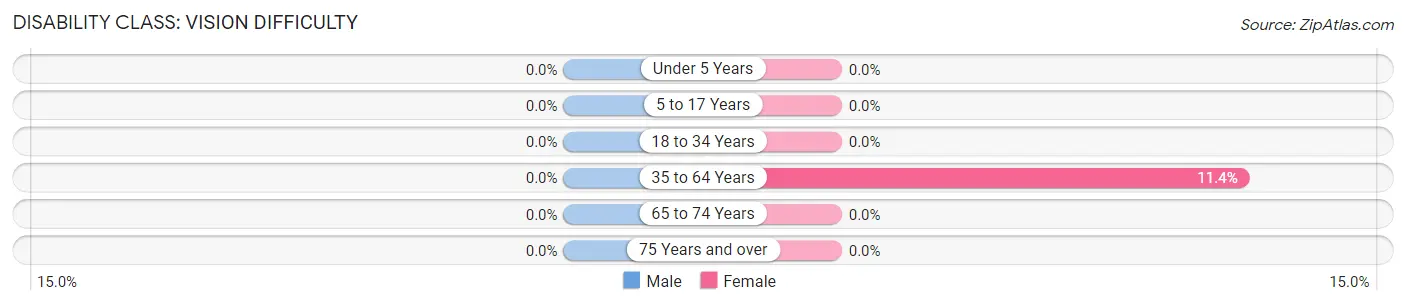
| Age Bracket | Male | Female |
| Under 5 Years | 0 (0.0%) | 0 (0.0%) |
| 5 to 17 Years | 0 (0.0%) | 0 (0.0%) |
| 18 to 34 Years | 0 (0.0%) | 0 (0.0%) |
| 35 to 64 Years | 0 (0.0%) | 16 (11.4%) |
| 65 to 74 Years | 0 (0.0%) | 0 (0.0%) |
| 75 Years and over | 0 (0.0%) | 0 (0.0%) |
Disability Class: Cognitive Difficulty
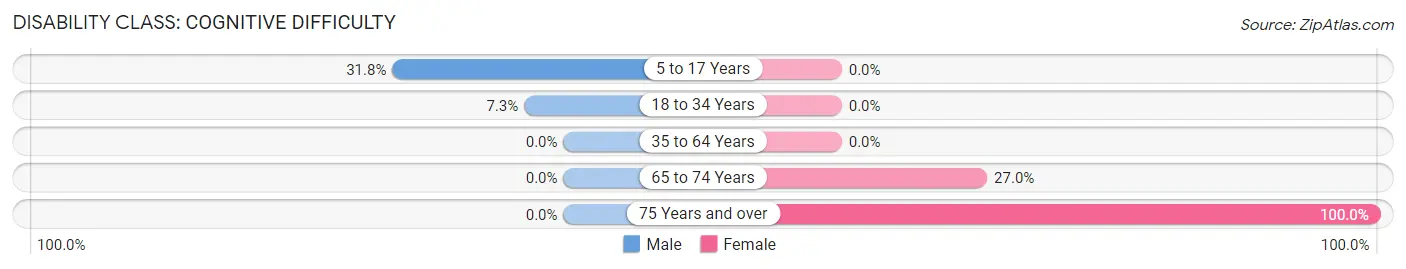
| Age Bracket | Male | Female |
| 5 to 17 Years | 81 (31.8%) | 0 (0.0%) |
| 18 to 34 Years | 10 (7.3%) | 0 (0.0%) |
| 35 to 64 Years | 0 (0.0%) | 0 (0.0%) |
| 65 to 74 Years | 0 (0.0%) | 17 (27.0%) |
| 75 Years and over | 0 (0.0%) | 13 (100.0%) |
Disability Class: Ambulatory Difficulty
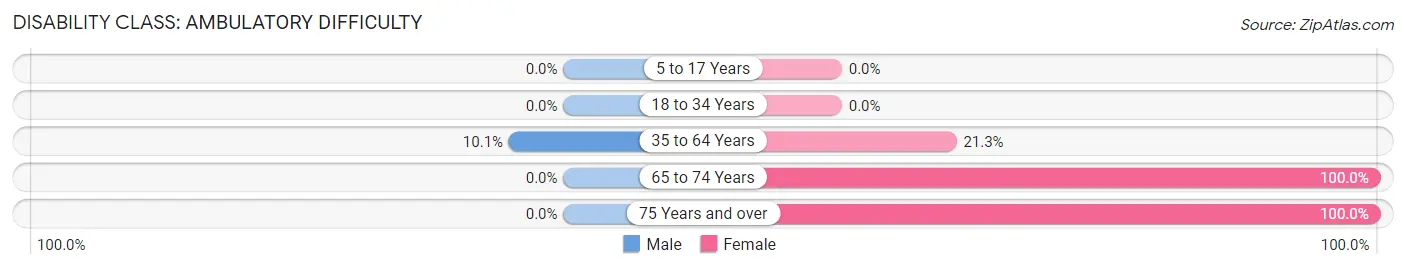
| Age Bracket | Male | Female |
| 5 to 17 Years | 0 (0.0%) | 0 (0.0%) |
| 18 to 34 Years | 0 (0.0%) | 0 (0.0%) |
| 35 to 64 Years | 18 (10.1%) | 30 (21.3%) |
| 65 to 74 Years | 0 (0.0%) | 63 (100.0%) |
| 75 Years and over | 0 (0.0%) | 13 (100.0%) |
Disability Class: Self-Care Difficulty
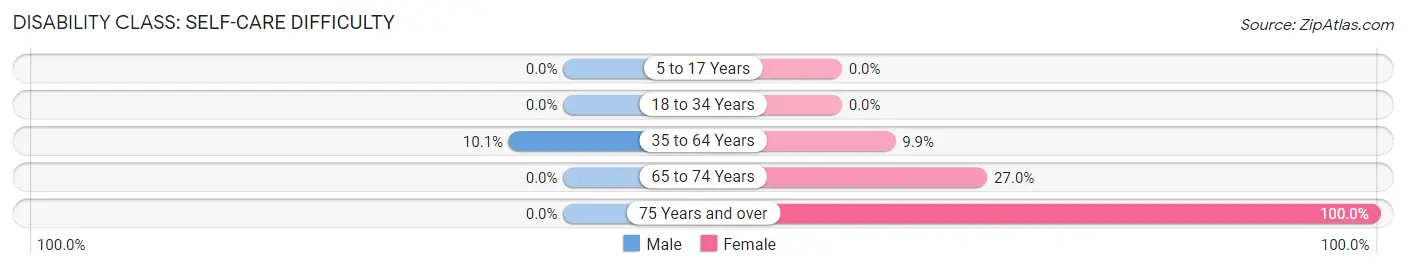
| Age Bracket | Male | Female |
| 5 to 17 Years | 0 (0.0%) | 0 (0.0%) |
| 18 to 34 Years | 0 (0.0%) | 0 (0.0%) |
| 35 to 64 Years | 18 (10.1%) | 14 (9.9%) |
| 65 to 74 Years | 0 (0.0%) | 17 (27.0%) |
| 75 Years and over | 0 (0.0%) | 13 (100.0%) |
Technology Access in Batesville
Computing Device Access in Batesville
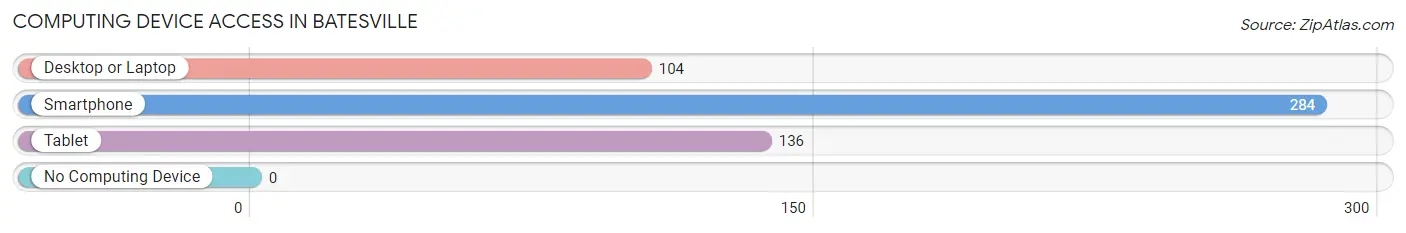
| Device Type | # Households | % Households |
| Desktop or Laptop | 104 | 36.6% |
| Smartphone | 284 | 100.0% |
| Tablet | 136 | 47.9% |
| No Computing Device | 0 | 0.0% |
| Total | 284 | 100.0% |
Internet Access in Batesville
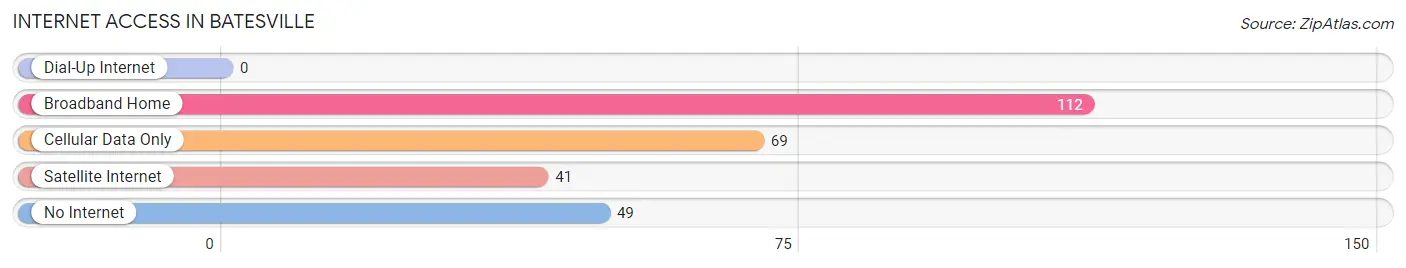
| Internet Type | # Households | % Households |
| Dial-Up Internet | 0 | 0.0% |
| Broadband Home | 112 | 39.4% |
| Cellular Data Only | 69 | 24.3% |
| Satellite Internet | 41 | 14.4% |
| No Internet | 49 | 17.2% |
| Total | 284 | 100.0% |
Batesville Summary
Batesville, Texas is a small town located in the southeastern corner of the state, near the border with Louisiana. It is part of the Beaumont-Port Arthur metropolitan area and is situated in the heart of the Piney Woods region. The town has a population of just over 1,000 people and is known for its rural charm and friendly atmosphere.
History
Batesville was founded in 1845 by a group of settlers from the nearby town of Liberty. The town was named after the first settler, William Bates, who had purchased the land from the local Native American tribes. The town quickly grew and by the late 19th century, it had become a thriving agricultural center. The town was also home to a number of businesses, including a cotton gin, a sawmill, and a gristmill.
In the early 20th century, the town began to decline as the local economy shifted away from agriculture. The Great Depression hit the town hard, and many of the businesses closed. However, the town was able to survive and eventually began to grow again in the 1950s and 1960s.
Geography
Batesville is located in the southeastern corner of Texas, near the border with Louisiana. It is part of the Beaumont-Port Arthur metropolitan area and is situated in the heart of the Piney Woods region. The town is located on the banks of the Sabine River, which provides a natural border between Texas and Louisiana.
The town is surrounded by a number of small towns and rural communities, including Liberty, Pineland, and Jasper. The nearest major city is Beaumont, which is located about 40 miles to the west.
Economy
The economy of Batesville is largely based on agriculture and timber. The town is home to a number of farms and ranches, which produce a variety of crops, including cotton, corn, soybeans, and hay. The town is also home to a number of timber companies, which harvest the local pine forests for lumber.
In addition to agriculture and timber, Batesville is also home to a number of small businesses, including restaurants, retail stores, and service providers. The town is also home to a number of manufacturing companies, which produce a variety of products, including furniture, clothing, and electronics.
Demographics
As of the 2010 census, the population of Batesville was 1,072. The town is predominantly white, with about 85% of the population identifying as such. The remaining 15% of the population is made up of African Americans, Hispanics, and other ethnicities.
The median household income in Batesville is $37,000, which is slightly lower than the state average. The town has a poverty rate of about 20%, which is slightly higher than the state average. The town also has a higher-than-average unemployment rate, which is currently at about 8%.
Conclusion
Batesville, Texas is a small town located in the southeastern corner of the state, near the border with Louisiana. It is part of the Beaumont-Port Arthur metropolitan area and is situated in the heart of the Piney Woods region. The town has a population of just over 1,000 people and is known for its rural charm and friendly atmosphere. The economy of Batesville is largely based on agriculture and timber, and the town is home to a number of small businesses. The population of Batesville is predominantly white, with about 85% of the population identifying as such. The median household income in Batesville is $37,000, which is slightly lower than the state average. The town has a poverty rate of about 20%, which is slightly higher than the state average.
Common Questions
What is Per Capita Income in Batesville?
Per Capita income in Batesville is $13,219.
What is the Median Family Income in Batesville?
Median Family Income in Batesville is $26,134.
What is the Median Household income in Batesville?
Median Household Income in Batesville is $35,132.
What is Inequality or Gini Index in Batesville?
Inequality or Gini Index in Batesville is 0.46.
What is the Total Population of Batesville?
Total Population of Batesville is 1,124.
What is the Total Male Population of Batesville?
Total Male Population of Batesville is 645.
What is the Total Female Population of Batesville?
Total Female Population of Batesville is 479.
What is the Ratio of Males per 100 Females in Batesville?
There are 134.66 Males per 100 Females in Batesville.
What is the Ratio of Females per 100 Males in Batesville?
There are 74.26 Females per 100 Males in Batesville.
What is the Median Population Age in Batesville?
Median Population Age in Batesville is 24.6 Years.
What is the Average Family Size in Batesville
Average Family Size in Batesville is 5.0 People.
What is the Average Household Size in Batesville
Average Household Size in Batesville is 4.0 People.
How Large is the Labor Force in Batesville?
There are 418 People in the Labor Forcein in Batesville.
What is the Percentage of People in the Labor Force in Batesville?
55.2% of People are in the Labor Force in Batesville.
What is the Unemployment Rate in Batesville?
Unemployment Rate in Batesville is 3.6%.