Bastrop, TX Map & Demographics
Bastrop Map
Bastrop Overview
$38,541
PER CAPITA INCOME
$104,286
AVG FAMILY INCOME
$59,087
AVG HOUSEHOLD INCOME
21.5%
WAGE / INCOME GAP [ % ]
78.5¢/ $1
WAGE / INCOME GAP [ $ ]
0.48
INEQUALITY / GINI INDEX
9,955
TOTAL POPULATION
4,507
MALE POPULATION
5,448
FEMALE POPULATION
82.73
MALES / 100 FEMALES
120.88
FEMALES / 100 MALES
40.7
MEDIAN AGE
3.0
AVG FAMILY SIZE
2.2
AVG HOUSEHOLD SIZE
5,506
LABOR FORCE [ PEOPLE ]
66.3%
PERCENT IN LABOR FORCE
4.6%
UNEMPLOYMENT RATE
Bastrop Zip Codes
Bastrop Area Codes
Income in Bastrop
Income Overview in Bastrop
Per Capita Income in Bastrop is $38,541, while median incomes of families and households are $104,286 and $59,087 respectively.
| Characteristic | Number | Measure |
| Per Capita Income | 9,955 | $38,541 |
| Median Family Income | 2,272 | $104,286 |
| Mean Family Income | 2,272 | $125,608 |
| Median Household Income | 4,156 | $59,087 |
| Mean Household Income | 4,156 | $93,426 |
| Income Deficit | 2,272 | $0 |
| Wage / Income Gap (%) | 9,955 | 21.50% |
| Wage / Income Gap ($) | 9,955 | 78.50¢ per $1 |
| Gini / Inequality Index | 9,955 | 0.48 |
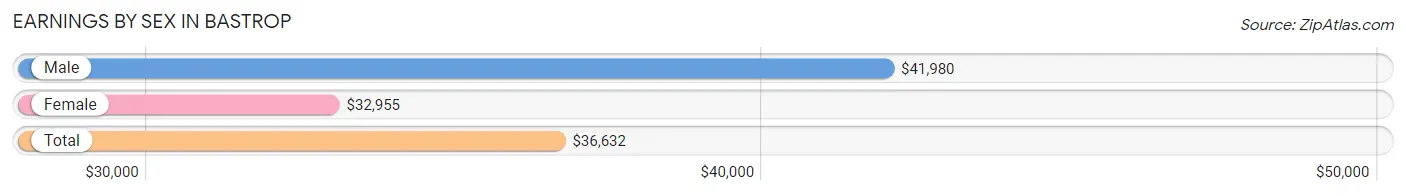
Earnings by Sex in Bastrop
Average Earnings in Bastrop are $36,632, $41,980 for men and $32,955 for women, a difference of 21.5%.
| Sex | Number | Average Earnings |
| Male | 2,827 (46.9%) | $41,980 |
| Female | 3,199 (53.1%) | $32,955 |
| Total | 6,026 (100.0%) | $36,632 |
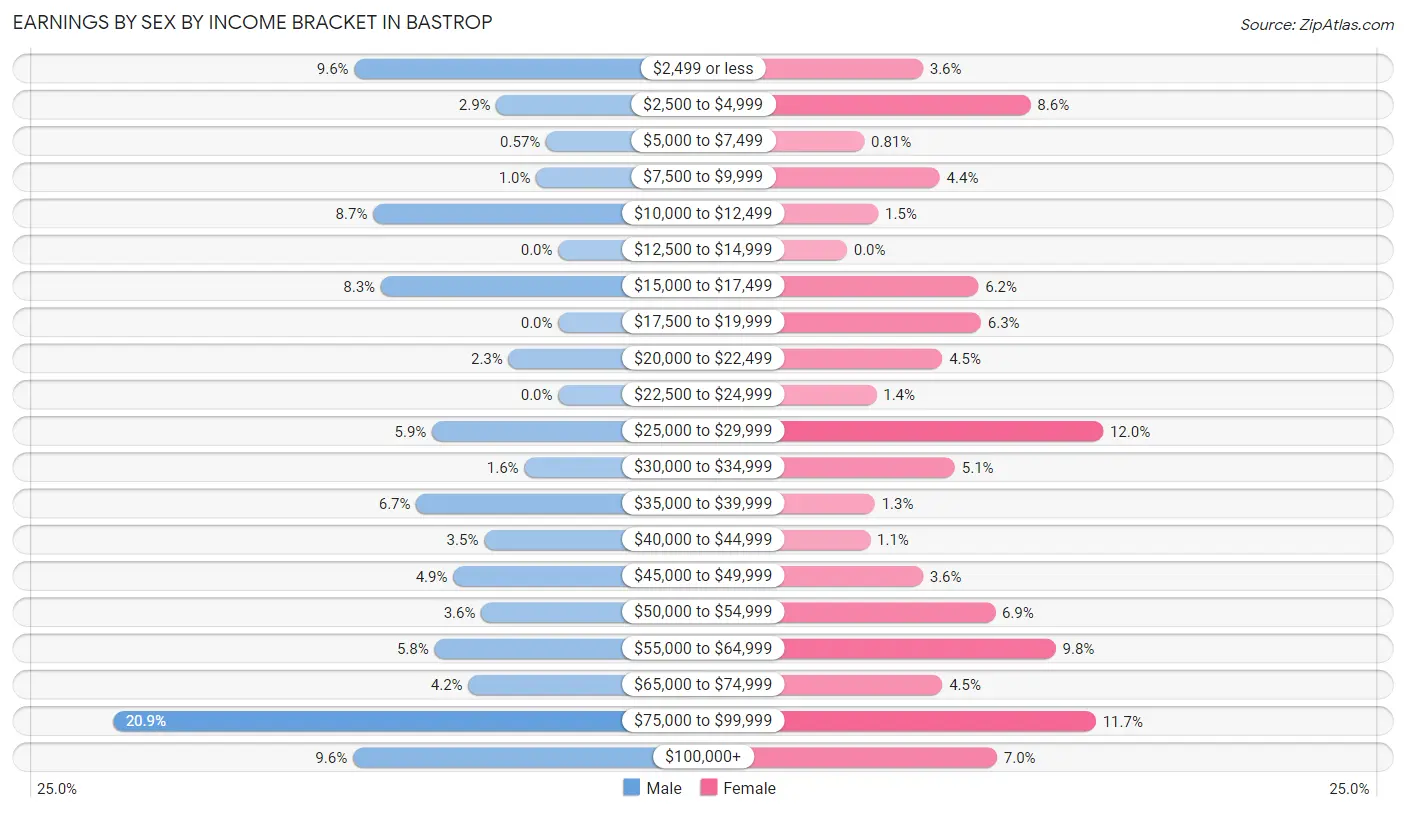
Earnings by Sex by Income Bracket in Bastrop
The most common earnings brackets in Bastrop are $75,000 to $99,999 for men (590 | 20.9%) and $25,000 to $29,999 for women (384 | 12.0%).
| Income | Male | Female |
| $2,499 or less | 270 (9.6%) | 114 (3.6%) |
| $2,500 to $4,999 | 82 (2.9%) | 275 (8.6%) |
| $5,000 to $7,499 | 16 (0.6%) | 26 (0.8%) |
| $7,500 to $9,999 | 29 (1.0%) | 139 (4.3%) |
| $10,000 to $12,499 | 245 (8.7%) | 47 (1.5%) |
| $12,500 to $14,999 | 0 (0.0%) | 0 (0.0%) |
| $15,000 to $17,499 | 235 (8.3%) | 197 (6.2%) |
| $17,500 to $19,999 | 0 (0.0%) | 201 (6.3%) |
| $20,000 to $22,499 | 66 (2.3%) | 143 (4.5%) |
| $22,500 to $24,999 | 0 (0.0%) | 44 (1.4%) |
| $25,000 to $29,999 | 167 (5.9%) | 384 (12.0%) |
| $30,000 to $34,999 | 45 (1.6%) | 162 (5.1%) |
| $35,000 to $39,999 | 188 (6.7%) | 42 (1.3%) |
| $40,000 to $44,999 | 98 (3.5%) | 35 (1.1%) |
| $45,000 to $49,999 | 139 (4.9%) | 114 (3.6%) |
| $50,000 to $54,999 | 102 (3.6%) | 222 (6.9%) |
| $55,000 to $64,999 | 164 (5.8%) | 313 (9.8%) |
| $65,000 to $74,999 | 119 (4.2%) | 143 (4.5%) |
| $75,000 to $99,999 | 590 (20.9%) | 373 (11.7%) |
| $100,000+ | 272 (9.6%) | 225 (7.0%) |
| Total | 2,827 (100.0%) | 3,199 (100.0%) |
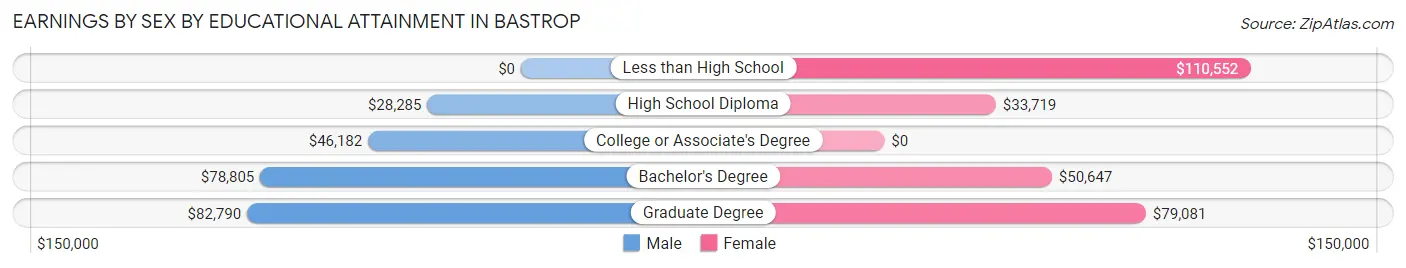
Earnings by Sex by Educational Attainment in Bastrop
Average earnings in Bastrop are $52,672 for men and $45,698 for women, a difference of 13.2%. Men with an educational attainment of graduate degree enjoy the highest average annual earnings of $82,790, while those with high school diploma education earn the least with $28,285. Women with an educational attainment of less than high school earn the most with the average annual earnings of $110,552, while those with high school diploma education have the smallest earnings of $33,719.
| Educational Attainment | Male Income | Female Income |
| Less than High School | - | - |
| High School Diploma | $28,285 | $33,719 |
| College or Associate's Degree | $46,182 | $0 |
| Bachelor's Degree | $78,805 | $50,647 |
| Graduate Degree | $82,790 | $79,081 |
| Total | $52,672 | $45,698 |
Family Income in Bastrop
Family Income Brackets in Bastrop
According to the Bastrop family income data, there are 536 families falling into the $100,000 to $149,999 income range, which is the most common income bracket and makes up 23.6% of all families.
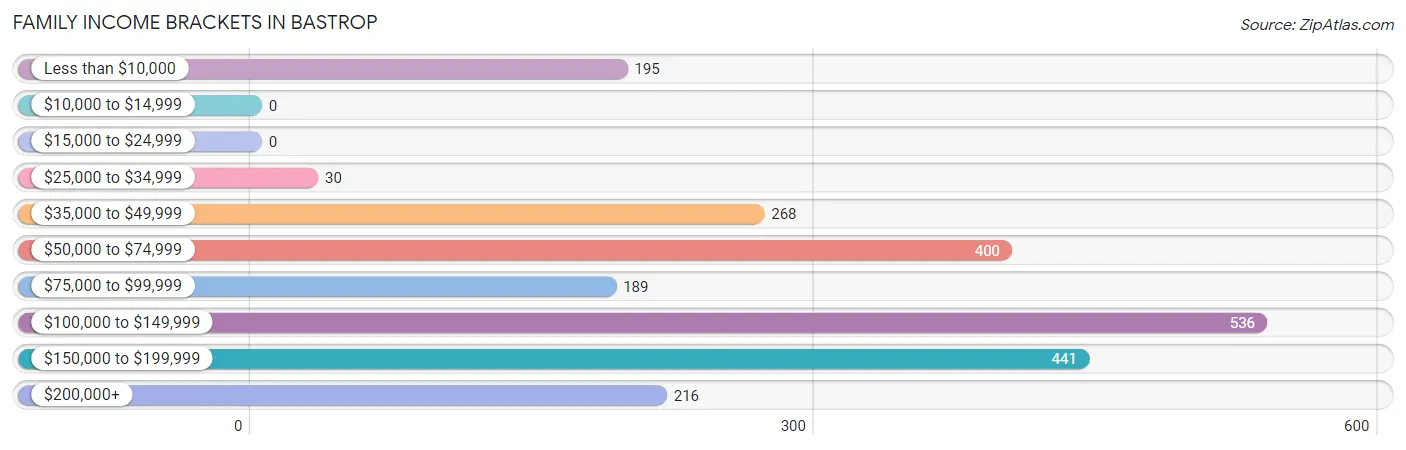
| Income Bracket | # Families | % Families |
| Less than $10,000 | 195 | 8.6% |
| $10,000 to $14,999 | 0 | 0.0% |
| $15,000 to $24,999 | 0 | 0.0% |
| $25,000 to $34,999 | 30 | 1.3% |
| $35,000 to $49,999 | 268 | 11.8% |
| $50,000 to $74,999 | 400 | 17.6% |
| $75,000 to $99,999 | 189 | 8.3% |
| $100,000 to $149,999 | 536 | 23.6% |
| $150,000 to $199,999 | 441 | 19.4% |
| $200,000+ | 216 | 9.5% |
Family Income by Famaliy Size in Bastrop
5-person families (128 | 5.6%) account for the highest median family income in Bastrop with $138,550 per family, while 3-person families (746 | 32.8%) have the highest median income of $43,388 per family member.
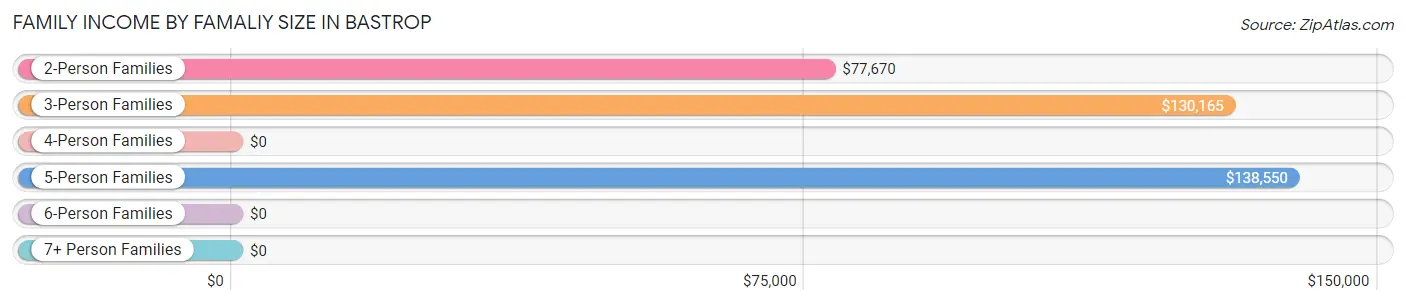
| Income Bracket | # Families | Median Income |
| 2-Person Families | 928 (40.8%) | $77,670 |
| 3-Person Families | 746 (32.8%) | $130,165 |
| 4-Person Families | 405 (17.8%) | $0 |
| 5-Person Families | 128 (5.6%) | $138,550 |
| 6-Person Families | 65 (2.9%) | $0 |
| 7+ Person Families | 0 (0.0%) | $0 |
| Total | 2,272 (100.0%) | $104,286 |
Family Income by Number of Earners in Bastrop
The median family income in Bastrop is $104,286, with families comprising 3+ earners (350) having the highest median family income of $156,492, while families with no earners (157) have the lowest median family income of $40,529, accounting for 15.4% and 6.9% of families, respectively.
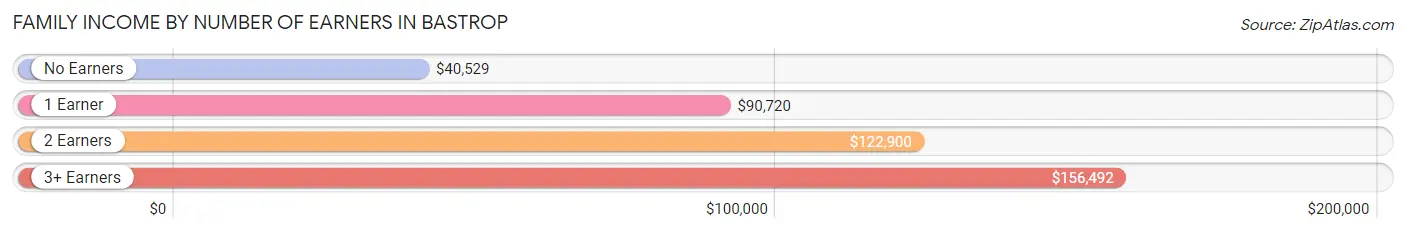
| Number of Earners | # Families | Median Income |
| No Earners | 157 (6.9%) | $40,529 |
| 1 Earner | 481 (21.2%) | $90,720 |
| 2 Earners | 1,284 (56.5%) | $122,900 |
| 3+ Earners | 350 (15.4%) | $156,492 |
| Total | 2,272 (100.0%) | $104,286 |
Household Income in Bastrop
Household Income Brackets in Bastrop
With 781 households falling in the category, the $100,000 to $149,999 income range is the most frequent in Bastrop, accounting for 18.8% of all households. In contrast, only 104 households (2.5%) fall into the $10,000 to $14,999 income bracket, making it the least populous group.
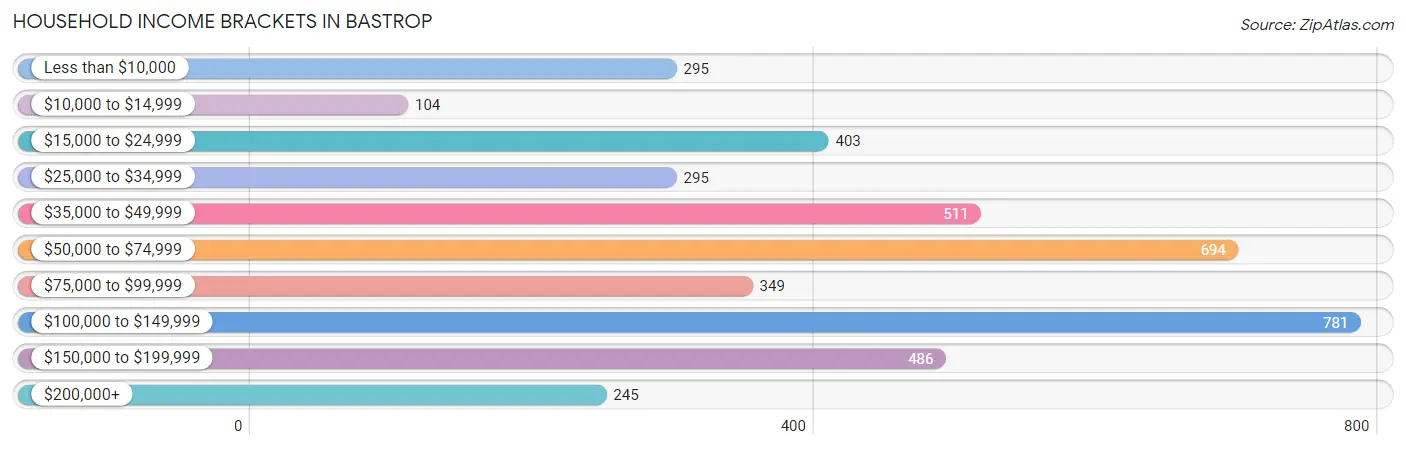
| Income Bracket | # Households | % Households |
| Less than $10,000 | 295 | 7.1% |
| $10,000 to $14,999 | 104 | 2.5% |
| $15,000 to $24,999 | 403 | 9.7% |
| $25,000 to $34,999 | 295 | 7.1% |
| $35,000 to $49,999 | 511 | 12.3% |
| $50,000 to $74,999 | 694 | 16.7% |
| $75,000 to $99,999 | 349 | 8.4% |
| $100,000 to $149,999 | 781 | 18.8% |
| $150,000 to $199,999 | 486 | 11.7% |
| $200,000+ | 245 | 5.9% |
Household Income by Householder Age in Bastrop
The median household income in Bastrop is $59,087, with the highest median household income of $83,565 found in the 45 to 64 years age bracket for the primary householder. A total of 1,579 households (38.0%) fall into this category. Meanwhile, the 65+ years age bracket for the primary householder has the lowest median household income of $38,692, with 1,015 households (24.4%) in this group.
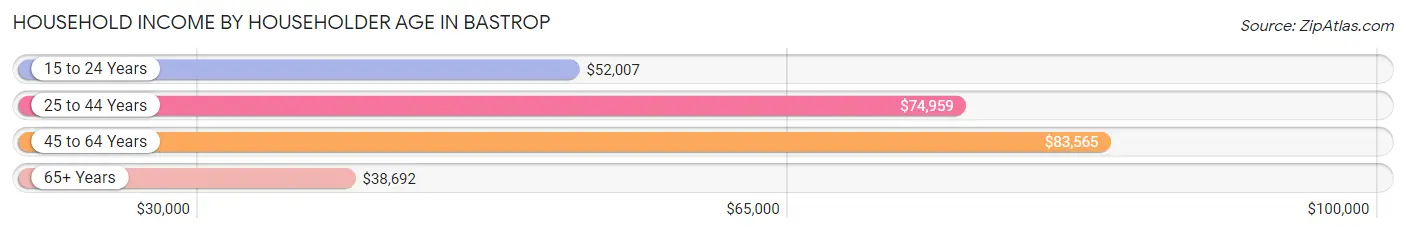
| Income Bracket | # Households | Median Income |
| 15 to 24 Years | 227 (5.5%) | $52,007 |
| 25 to 44 Years | 1,335 (32.1%) | $74,959 |
| 45 to 64 Years | 1,579 (38.0%) | $83,565 |
| 65+ Years | 1,015 (24.4%) | $38,692 |
| Total | 4,156 (100.0%) | $59,087 |
Poverty in Bastrop
Income Below Poverty by Sex and Age in Bastrop
With 11.6% poverty level for males and 11.4% for females among the residents of Bastrop, 16 and 17 year old males and 6 to 11 year old females are the most vulnerable to poverty, with 28 males (73.7%) and 105 females (42.0%) in their respective age groups living below the poverty level.
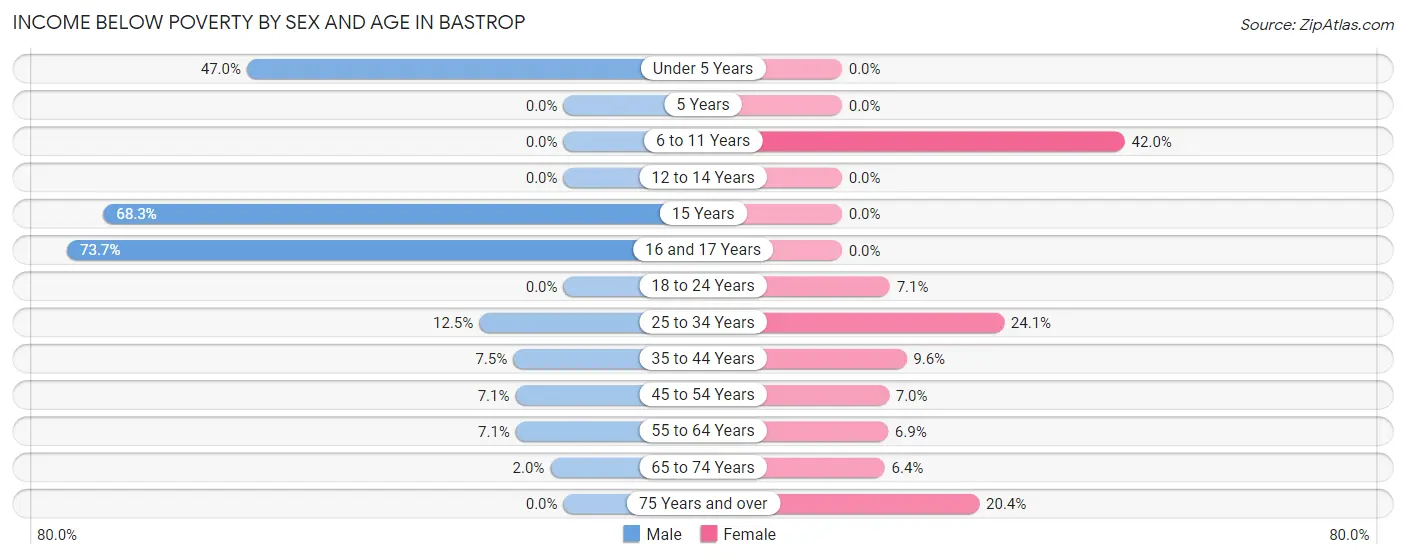
| Age Bracket | Male | Female |
| Under 5 Years | 189 (47.0%) | 0 (0.0%) |
| 5 Years | 0 (0.0%) | 0 (0.0%) |
| 6 to 11 Years | 0 (0.0%) | 105 (42.0%) |
| 12 to 14 Years | 0 (0.0%) | 0 (0.0%) |
| 15 Years | 28 (68.3%) | 0 (0.0%) |
| 16 and 17 Years | 28 (73.7%) | 0 (0.0%) |
| 18 to 24 Years | 0 (0.0%) | 44 (7.1%) |
| 25 to 34 Years | 109 (12.5%) | 156 (24.1%) |
| 35 to 44 Years | 29 (7.5%) | 59 (9.6%) |
| 45 to 54 Years | 59 (7.1%) | 60 (7.0%) |
| 55 to 64 Years | 31 (7.1%) | 45 (6.9%) |
| 65 to 74 Years | 5 (1.9%) | 28 (6.4%) |
| 75 Years and over | 0 (0.0%) | 105 (20.4%) |
| Total | 478 (11.6%) | 602 (11.4%) |
Income Above Poverty by Sex and Age in Bastrop
According to the poverty statistics in Bastrop, males aged 5 years and females aged under 5 years are the age groups that are most secure financially, with 100.0% of males and 100.0% of females in these age groups living above the poverty line.
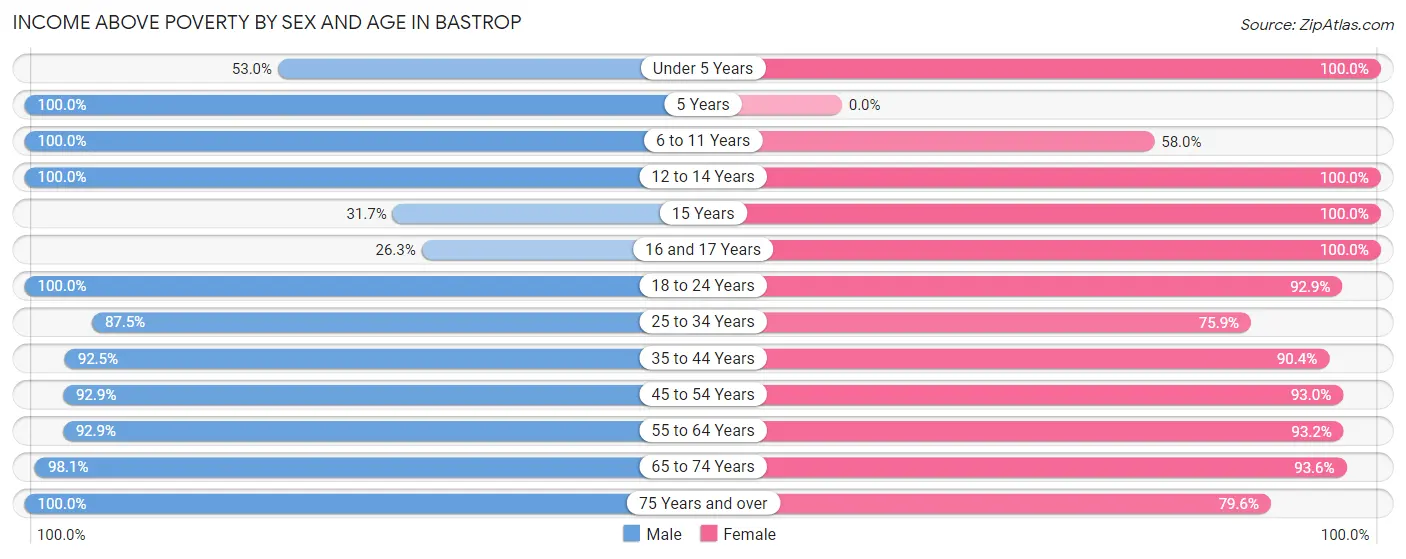
| Age Bracket | Male | Female |
| Under 5 Years | 213 (53.0%) | 438 (100.0%) |
| 5 Years | 30 (100.0%) | 0 (0.0%) |
| 6 to 11 Years | 277 (100.0%) | 145 (58.0%) |
| 12 to 14 Years | 54 (100.0%) | 140 (100.0%) |
| 15 Years | 13 (31.7%) | 19 (100.0%) |
| 16 and 17 Years | 10 (26.3%) | 62 (100.0%) |
| 18 to 24 Years | 397 (100.0%) | 574 (92.9%) |
| 25 to 34 Years | 762 (87.5%) | 492 (75.9%) |
| 35 to 44 Years | 359 (92.5%) | 557 (90.4%) |
| 45 to 54 Years | 768 (92.9%) | 800 (93.0%) |
| 55 to 64 Years | 407 (92.9%) | 612 (93.1%) |
| 65 to 74 Years | 252 (98.1%) | 412 (93.6%) |
| 75 Years and over | 98 (100.0%) | 410 (79.6%) |
| Total | 3,640 (88.4%) | 4,661 (88.6%) |
Income Below Poverty Among Married-Couple Families in Bastrop
The poverty statistics for married-couple families in Bastrop show that 8.5% or 135 of the total 1,590 families live below the poverty line. Families with 1 or 2 children have the highest poverty rate of 17.1%, comprising of 109 families. On the other hand, families with 3 or 4 children have the lowest poverty rate of 0.0%, which includes 0 families.
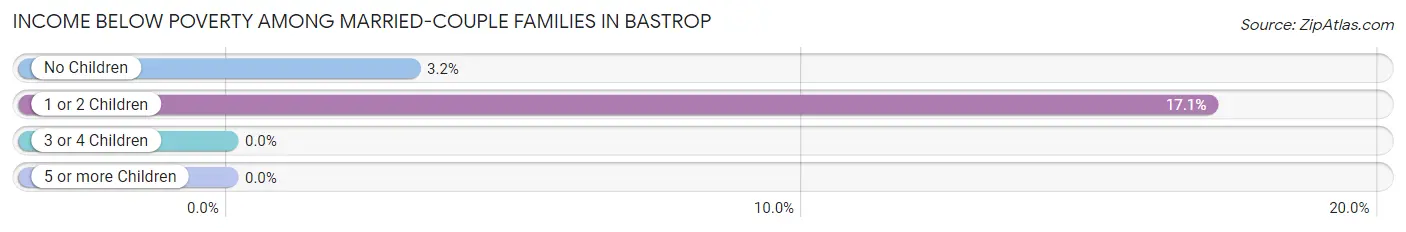
| Children | Above Poverty | Below Poverty |
| No Children | 794 (96.8%) | 26 (3.2%) |
| 1 or 2 Children | 530 (82.9%) | 109 (17.1%) |
| 3 or 4 Children | 131 (100.0%) | 0 (0.0%) |
| 5 or more Children | 0 (0.0%) | 0 (0.0%) |
| Total | 1,455 (91.5%) | 135 (8.5%) |
Income Below Poverty Among Single-Parent Households in Bastrop
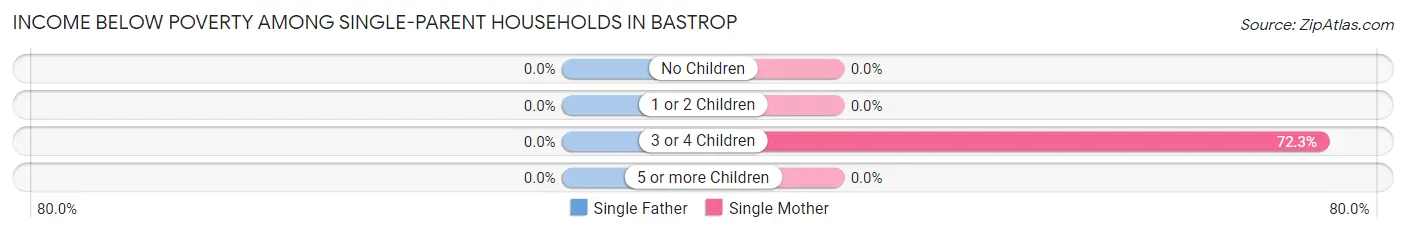
| Children | Single Father | Single Mother |
| No Children | 0 (0.0%) | 0 (0.0%) |
| 1 or 2 Children | 0 (0.0%) | 0 (0.0%) |
| 3 or 4 Children | 0 (0.0%) | 60 (72.3%) |
| 5 or more Children | 0 (0.0%) | 0 (0.0%) |
| Total | 0 (0.0%) | 60 (11.3%) |
Income Below Poverty Among Married-Couple vs Single-Parent Households in Bastrop
The poverty data for Bastrop shows that 135 of the married-couple family households (8.5%) and 60 of the single-parent households (8.8%) are living below the poverty level. Within the married-couple family households, those with 1 or 2 children have the highest poverty rate, with 109 households (17.1%) falling below the poverty line. Among the single-parent households, those with 3 or 4 children have the highest poverty rate, with 60 household (72.3%) living below poverty.
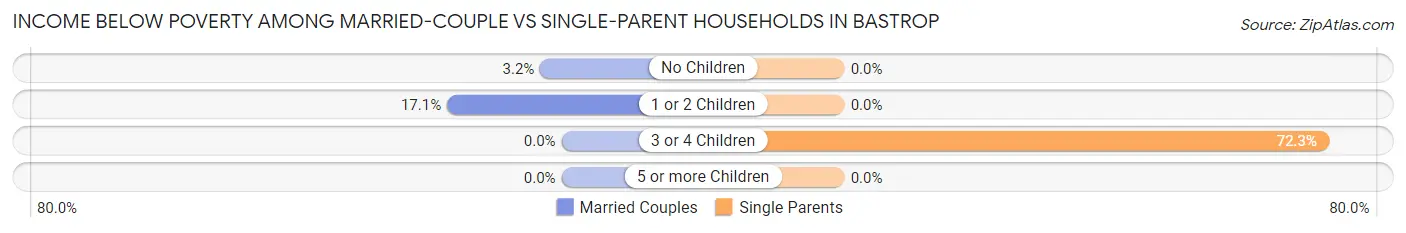
| Children | Married-Couple Families | Single-Parent Households |
| No Children | 26 (3.2%) | 0 (0.0%) |
| 1 or 2 Children | 109 (17.1%) | 0 (0.0%) |
| 3 or 4 Children | 0 (0.0%) | 60 (72.3%) |
| 5 or more Children | 0 (0.0%) | 0 (0.0%) |
| Total | 135 (8.5%) | 60 (8.8%) |
Race in Bastrop
The most populous races in Bastrop are White / Caucasian (7,027 | 70.6%), Hispanic or Latino (3,005 | 30.2%), and Two or more Races (1,312 | 13.2%).
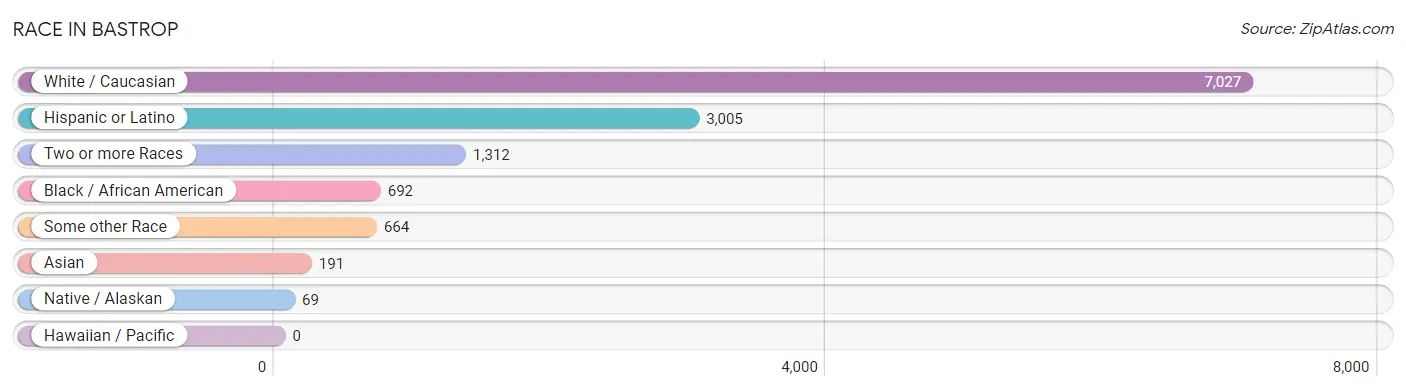
| Race | # Population | % Population |
| Asian | 191 | 1.9% |
| Black / African American | 692 | 7.0% |
| Hawaiian / Pacific | 0 | 0.0% |
| Hispanic or Latino | 3,005 | 30.2% |
| Native / Alaskan | 69 | 0.7% |
| White / Caucasian | 7,027 | 70.6% |
| Two or more Races | 1,312 | 13.2% |
| Some other Race | 664 | 6.7% |
| Total | 9,955 | 100.0% |
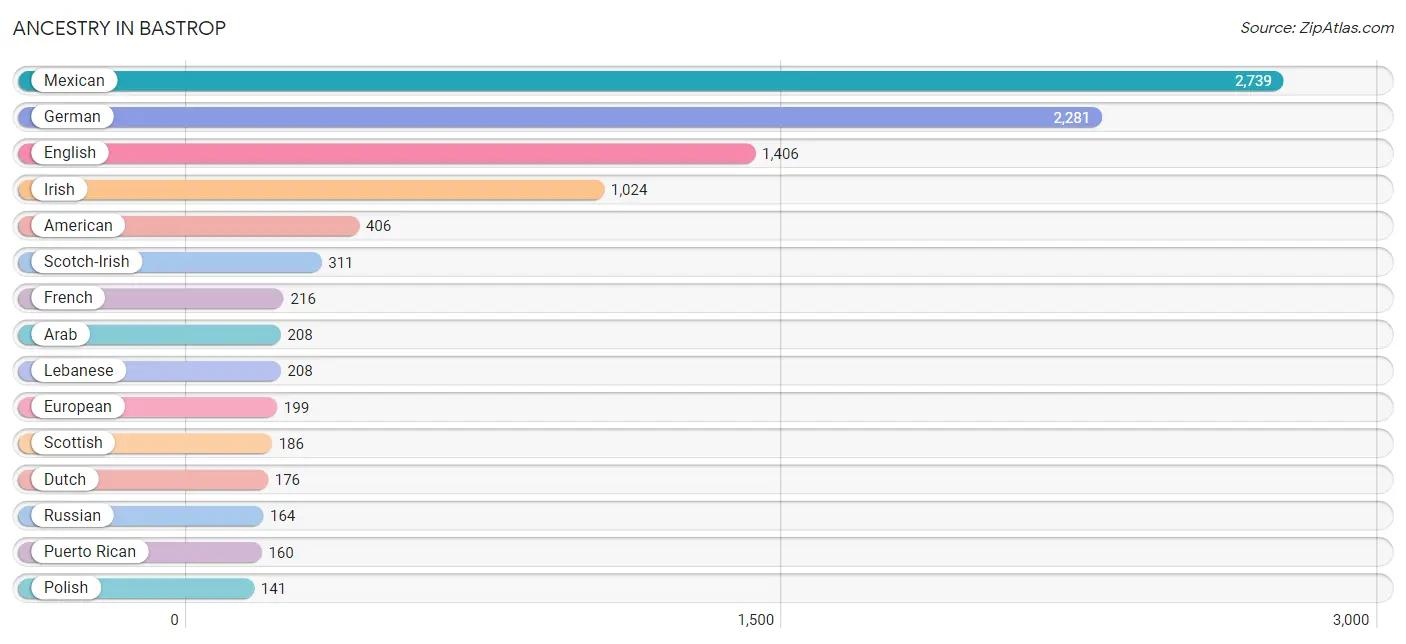
Ancestry in Bastrop
The most populous ancestries reported in Bastrop are Mexican (2,739 | 27.5%), German (2,281 | 22.9%), English (1,406 | 14.1%), Irish (1,024 | 10.3%), and American (406 | 4.1%), together accounting for 78.9% of all Bastrop residents.
| Ancestry | # Population | % Population |
| American | 406 | 4.1% |
| Arab | 208 | 2.1% |
| Austrian | 26 | 0.3% |
| Bhutanese | 42 | 0.4% |
| British | 29 | 0.3% |
| Central American Indian | 62 | 0.6% |
| Cherokee | 53 | 0.5% |
| Chippewa | 22 | 0.2% |
| Choctaw | 24 | 0.2% |
| Czech | 82 | 0.8% |
| Danish | 18 | 0.2% |
| Dominican | 8 | 0.1% |
| Dutch | 176 | 1.8% |
| English | 1,406 | 14.1% |
| European | 199 | 2.0% |
| French | 216 | 2.2% |
| French American Indian | 78 | 0.8% |
| German | 2,281 | 22.9% |
| Irish | 1,024 | 10.3% |
| Italian | 77 | 0.8% |
| Korean | 139 | 1.4% |
| Lebanese | 208 | 2.1% |
| Mexican | 2,739 | 27.5% |
| Native Hawaiian | 42 | 0.4% |
| Norwegian | 61 | 0.6% |
| Polish | 141 | 1.4% |
| Puerto Rican | 160 | 1.6% |
| Russian | 164 | 1.7% |
| Scotch-Irish | 311 | 3.1% |
| Scottish | 186 | 1.9% |
| South African | 38 | 0.4% |
| Sri Lankan | 70 | 0.7% |
| Subsaharan African | 38 | 0.4% |
| Swedish | 54 | 0.5% |
| Swiss | 27 | 0.3% |
| Thai | 10 | 0.1% |
| Welsh | 33 | 0.3% | View All 37 Rows |
Immigrants in Bastrop
The most numerous immigrant groups reported in Bastrop came from Central America (254 | 2.5%), Latin America (254 | 2.5%), Mexico (226 | 2.3%), Asia (191 | 1.9%), and South Eastern Asia (181 | 1.8%), together accounting for 11.1% of all Bastrop residents.
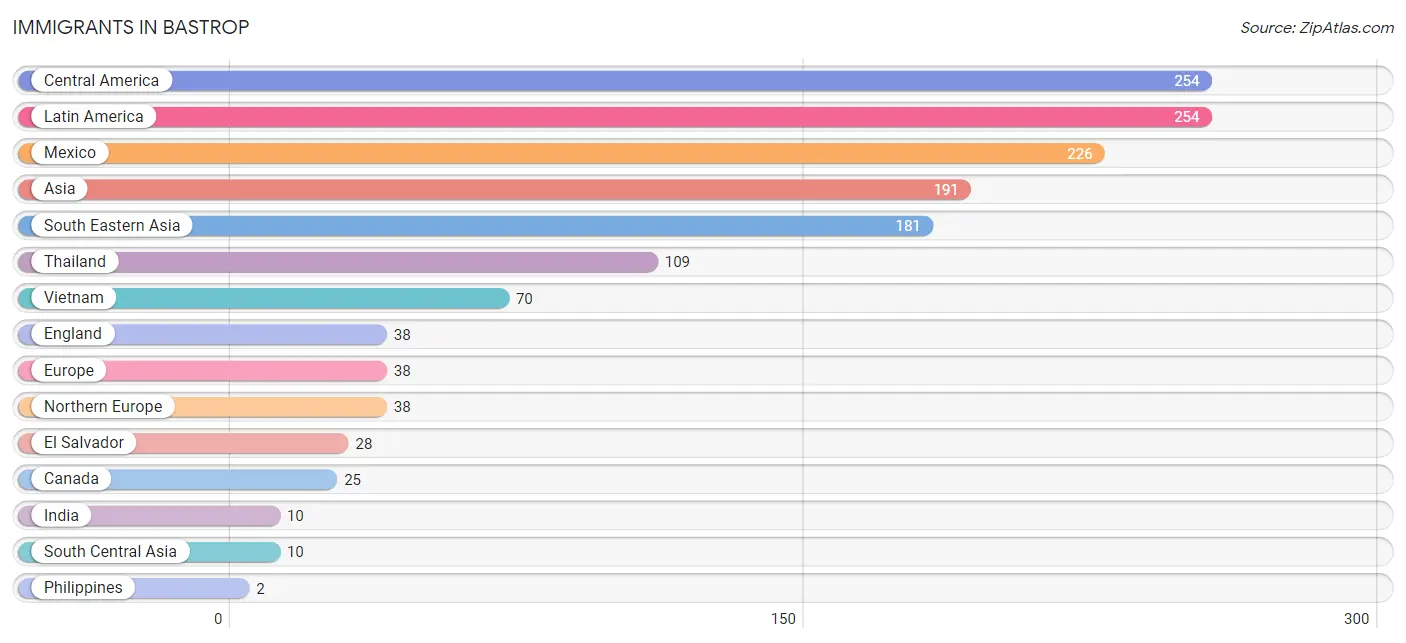
| Immigration Origin | # Population | % Population |
| Asia | 191 | 1.9% |
| Canada | 25 | 0.3% |
| Central America | 254 | 2.5% |
| El Salvador | 28 | 0.3% |
| England | 38 | 0.4% |
| Europe | 38 | 0.4% |
| India | 10 | 0.1% |
| Latin America | 254 | 2.5% |
| Mexico | 226 | 2.3% |
| Northern Europe | 38 | 0.4% |
| Philippines | 2 | 0.0% |
| South Central Asia | 10 | 0.1% |
| South Eastern Asia | 181 | 1.8% |
| Thailand | 109 | 1.1% |
| Vietnam | 70 | 0.7% | View All 15 Rows |
Sex and Age in Bastrop
Sex and Age in Bastrop
The most populous age groups in Bastrop are 50 to 54 Years (656 | 14.6%) for men and 40 to 44 Years (499 | 9.2%) for women.
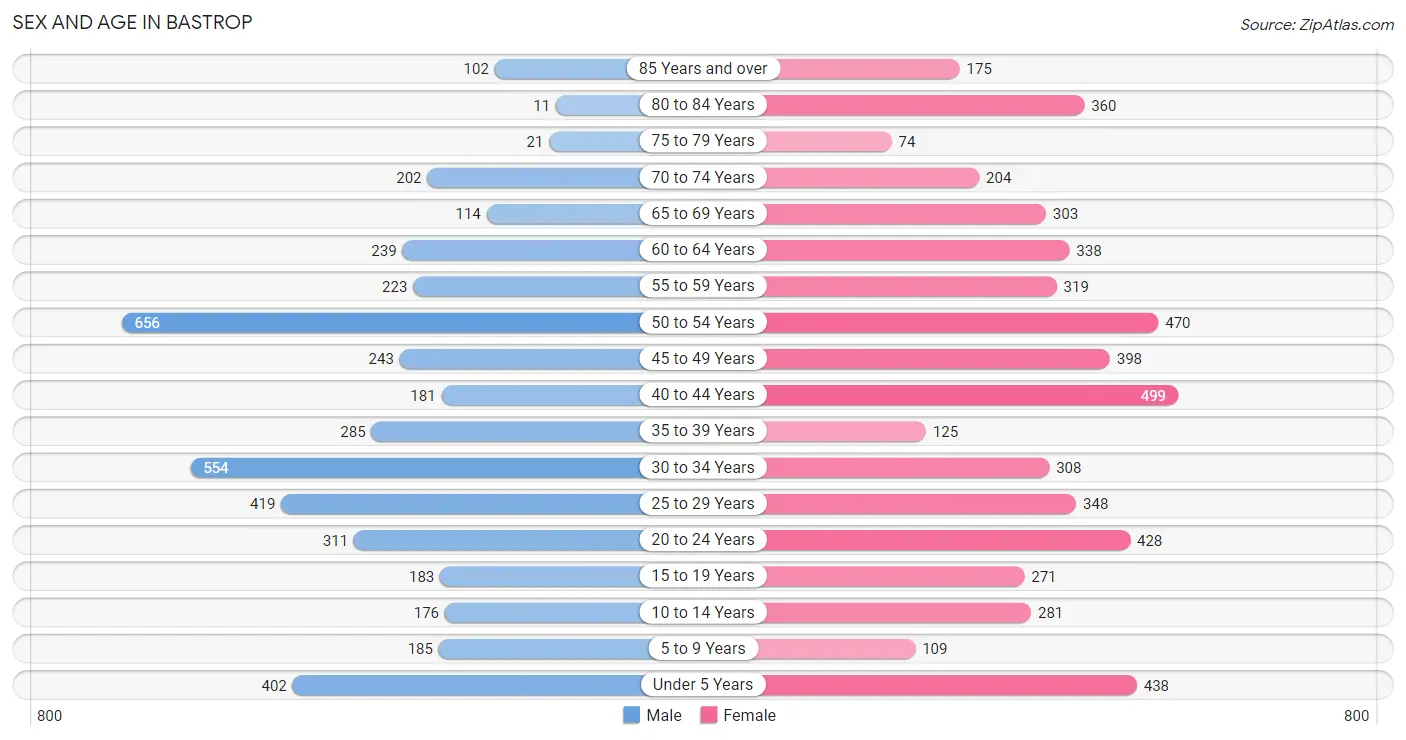
| Age Bracket | Male | Female |
| Under 5 Years | 402 (8.9%) | 438 (8.0%) |
| 5 to 9 Years | 185 (4.1%) | 109 (2.0%) |
| 10 to 14 Years | 176 (3.9%) | 281 (5.2%) |
| 15 to 19 Years | 183 (4.1%) | 271 (5.0%) |
| 20 to 24 Years | 311 (6.9%) | 428 (7.9%) |
| 25 to 29 Years | 419 (9.3%) | 348 (6.4%) |
| 30 to 34 Years | 554 (12.3%) | 308 (5.7%) |
| 35 to 39 Years | 285 (6.3%) | 125 (2.3%) |
| 40 to 44 Years | 181 (4.0%) | 499 (9.2%) |
| 45 to 49 Years | 243 (5.4%) | 398 (7.3%) |
| 50 to 54 Years | 656 (14.6%) | 470 (8.6%) |
| 55 to 59 Years | 223 (5.0%) | 319 (5.9%) |
| 60 to 64 Years | 239 (5.3%) | 338 (6.2%) |
| 65 to 69 Years | 114 (2.5%) | 303 (5.6%) |
| 70 to 74 Years | 202 (4.5%) | 204 (3.7%) |
| 75 to 79 Years | 21 (0.5%) | 74 (1.4%) |
| 80 to 84 Years | 11 (0.2%) | 360 (6.6%) |
| 85 Years and over | 102 (2.3%) | 175 (3.2%) |
| Total | 4,507 (100.0%) | 5,448 (100.0%) |
Families and Households in Bastrop
Median Family Size in Bastrop
The median family size in Bastrop is 3.01 persons per family, with married-couple families (1,590 | 70.0%) accounting for the largest median family size of 3.09 persons per family. On the other hand, single male/father families (153 | 6.7%) represent the smallest median family size with 2.49 persons per family.
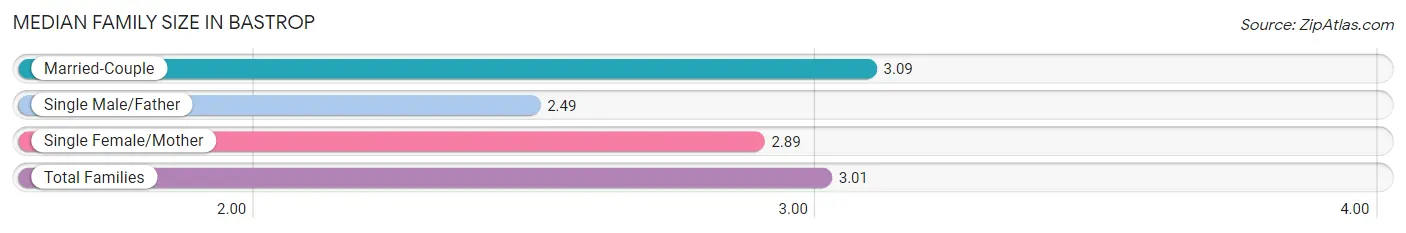
| Family Type | # Families | Family Size |
| Married-Couple | 1,590 (70.0%) | 3.09 |
| Single Male/Father | 153 (6.7%) | 2.49 |
| Single Female/Mother | 529 (23.3%) | 2.89 |
| Total Families | 2,272 (100.0%) | 3.01 |
Median Household Size in Bastrop
The median household size in Bastrop is 2.25 persons per household, with married-couple households (1,590 | 38.3%) accounting for the largest median household size of 3.13 persons per household. non-family households (1,884 | 45.3%) represent the smallest median household size with 1.26 persons per household.
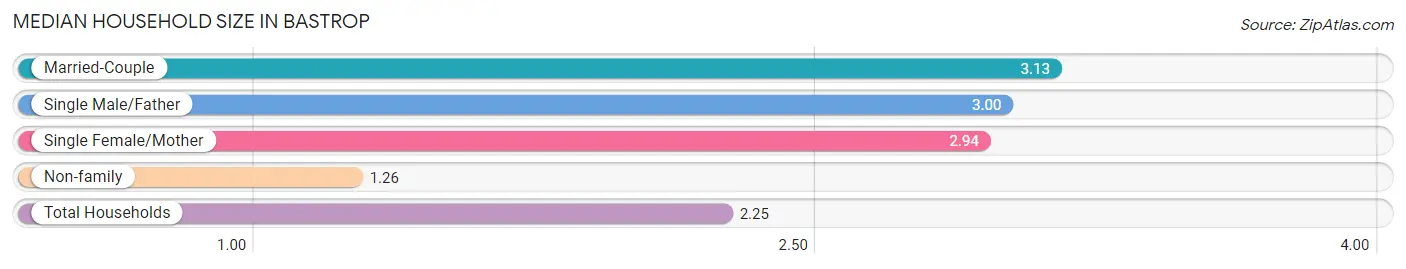
| Household Type | # Households | Household Size |
| Married-Couple | 1,590 (38.3%) | 3.13 |
| Single Male/Father | 153 (3.7%) | 3.00 |
| Single Female/Mother | 529 (12.7%) | 2.94 |
| Non-family | 1,884 (45.3%) | 1.26 |
| Total Households | 4,156 (100.0%) | 2.25 |
Household Size by Marriage Status in Bastrop
Out of a total of 4,156 households in Bastrop, 2,272 (54.7%) are family households, while 1,884 (45.3%) are nonfamily households. The most numerous type of family households are 2-person households, comprising 915, and the most common type of nonfamily households are 1-person households, comprising 1,507.
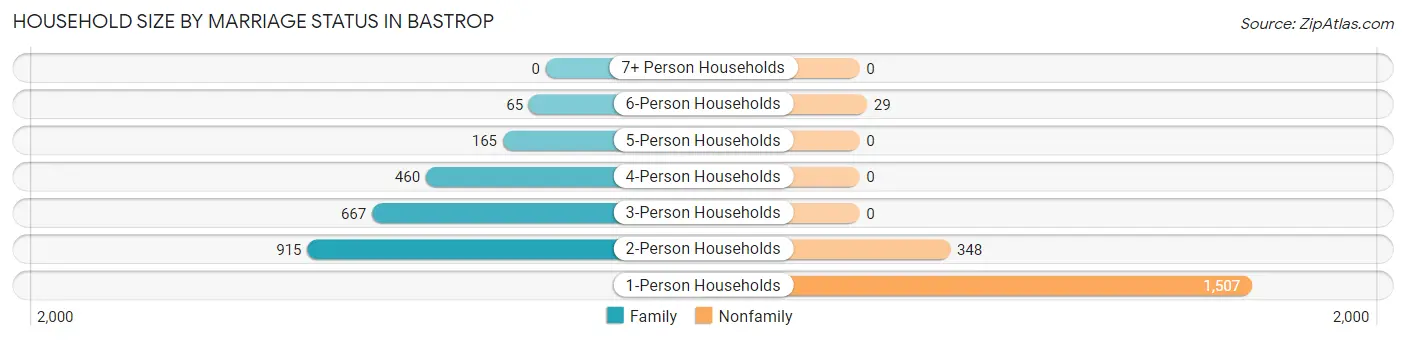
| Household Size | Family Households | Nonfamily Households |
| 1-Person Households | - | 1,507 (36.3%) |
| 2-Person Households | 915 (22.0%) | 348 (8.4%) |
| 3-Person Households | 667 (16.1%) | 0 (0.0%) |
| 4-Person Households | 460 (11.1%) | 0 (0.0%) |
| 5-Person Households | 165 (4.0%) | 0 (0.0%) |
| 6-Person Households | 65 (1.6%) | 29 (0.7%) |
| 7+ Person Households | 0 (0.0%) | 0 (0.0%) |
| Total | 2,272 (54.7%) | 1,884 (45.3%) |
Female Fertility in Bastrop
Fertility by Age in Bastrop
Average fertility rate in Bastrop is 30.0 births per 1,000 women. Women in the age bracket of 35 to 50 years have the highest fertility rate with 59.0 births per 1,000 women. Women in the age bracket of 35 to 50 years acount for 100.0% of all women with births.
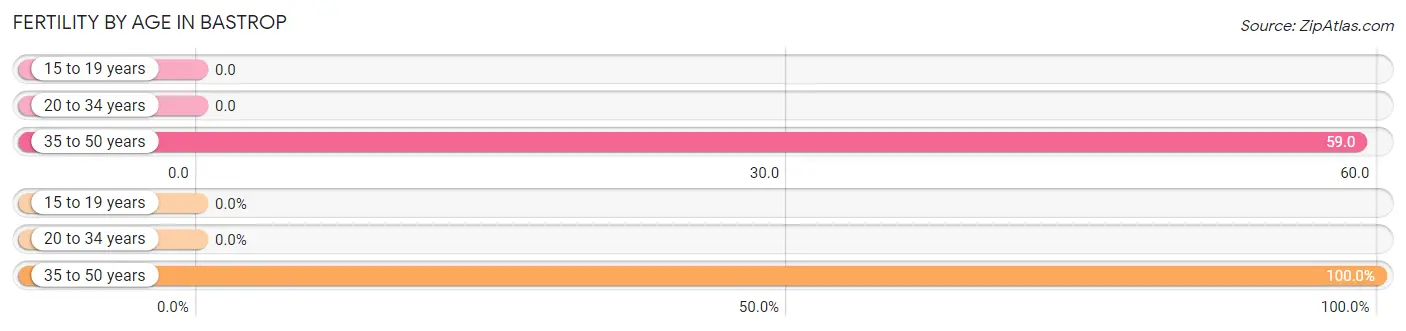
| Age Bracket | Women with Births | Births / 1,000 Women |
| 15 to 19 years | 0 (0.0%) | 0.0 |
| 20 to 34 years | 0 (0.0%) | 0.0 |
| 35 to 50 years | 81 (100.0%) | 59.0 |
| Total | 81 (100.0%) | 30.0 |
Fertility by Age by Marriage Status in Bastrop
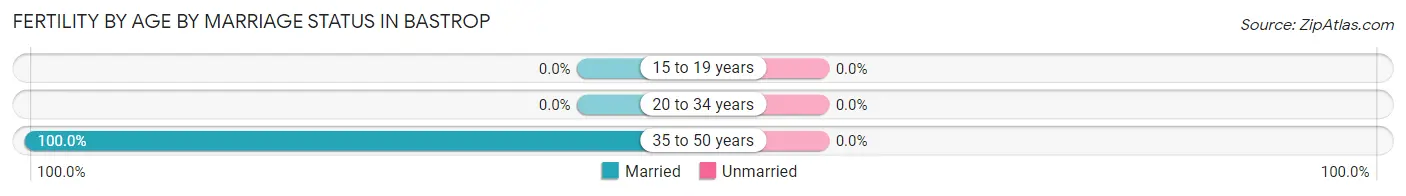
| Age Bracket | Married | Unmarried |
| 15 to 19 years | 0 (0.0%) | 0 (0.0%) |
| 20 to 34 years | 0 (0.0%) | 0 (0.0%) |
| 35 to 50 years | 81 (100.0%) | 0 (0.0%) |
| Total | 81 (100.0%) | 0 (0.0%) |
Fertility by Education in Bastrop
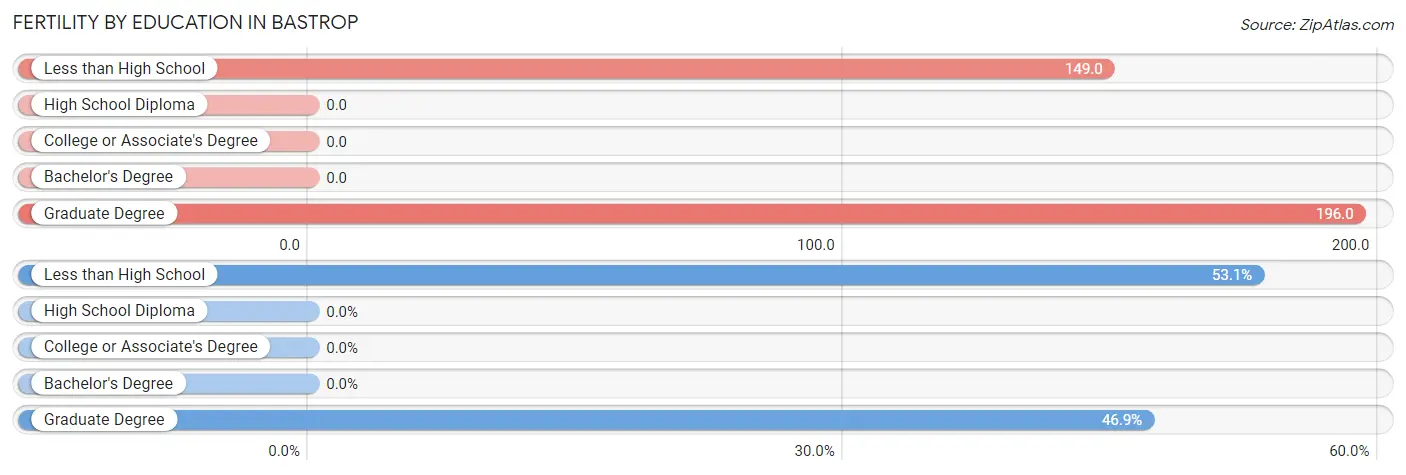
| Educational Attainment | Women with Births | Births / 1,000 Women |
| Less than High School | 43 (53.1%) | 149.0 |
| High School Diploma | 0 (0.0%) | 0.0 |
| College or Associate's Degree | 0 (0.0%) | 0.0 |
| Bachelor's Degree | 0 (0.0%) | 0.0 |
| Graduate Degree | 38 (46.9%) | 196.0 |
| Total | 81 (100.0%) | 30.0 |
Fertility by Education by Marriage Status in Bastrop
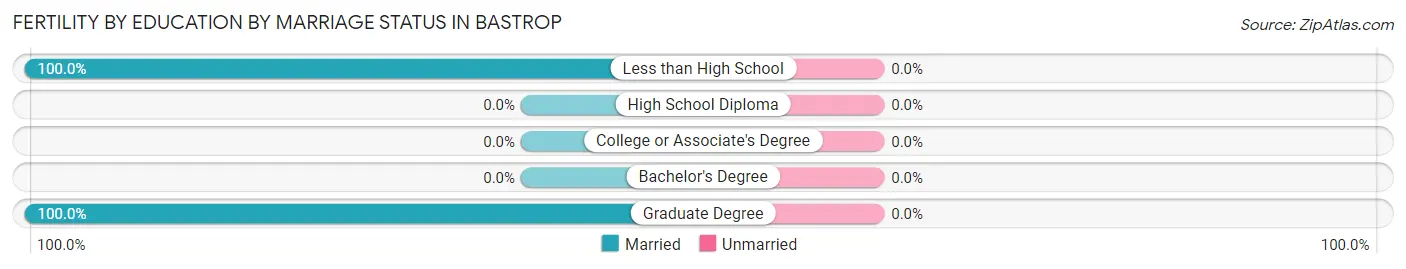
| Educational Attainment | Married | Unmarried |
| Less than High School | 43 (100.0%) | 0 (0.0%) |
| High School Diploma | 0 (0.0%) | 0 (0.0%) |
| College or Associate's Degree | 0 (0.0%) | 0 (0.0%) |
| Bachelor's Degree | 0 (0.0%) | 0 (0.0%) |
| Graduate Degree | 38 (100.0%) | 0 (0.0%) |
| Total | 81 (100.0%) | 0 (0.0%) |
Employment Characteristics in Bastrop
Employment by Class of Employer in Bastrop
Among the 5,250 employed individuals in Bastrop, private company employees (3,161 | 60.2%), local government employees (646 | 12.3%), and state government employees (624 | 11.9%) make up the most common classes of employment.
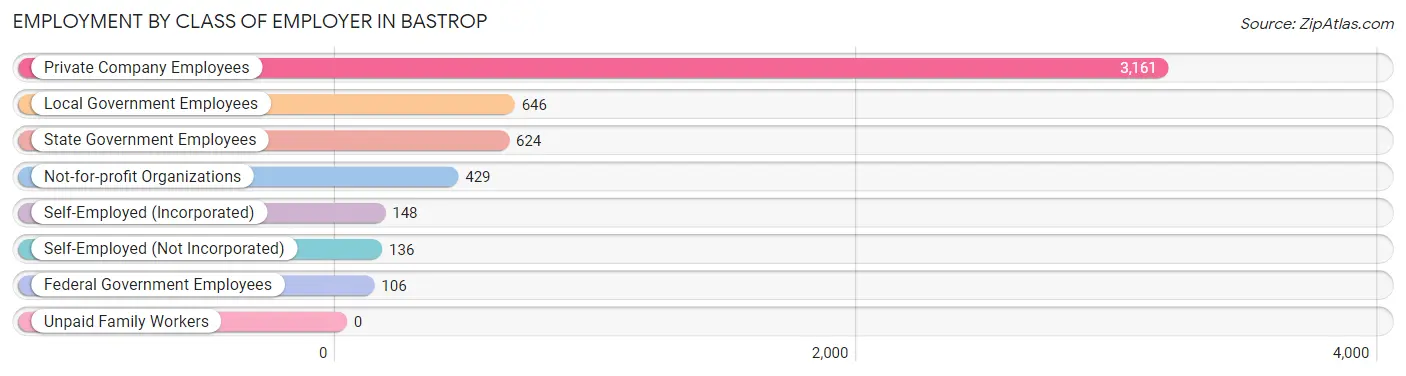
| Employer Class | # Employees | % Employees |
| Private Company Employees | 3,161 | 60.2% |
| Self-Employed (Incorporated) | 148 | 2.8% |
| Self-Employed (Not Incorporated) | 136 | 2.6% |
| Not-for-profit Organizations | 429 | 8.2% |
| Local Government Employees | 646 | 12.3% |
| State Government Employees | 624 | 11.9% |
| Federal Government Employees | 106 | 2.0% |
| Unpaid Family Workers | 0 | 0.0% |
| Total | 5,250 | 100.0% |
Employment Status by Age in Bastrop
According to the labor force statistics for Bastrop, out of the total population over 16 years of age (8,304), 66.3% or 5,506 individuals are in the labor force, with 4.6% or 253 of them unemployed. The age group with the highest labor force participation rate is 55 to 59 years, with 90.4% or 490 individuals in the labor force. Within the labor force, the 20 to 24 years age range has the highest percentage of unemployed individuals, with 10.1% or 58 of them being unemployed.
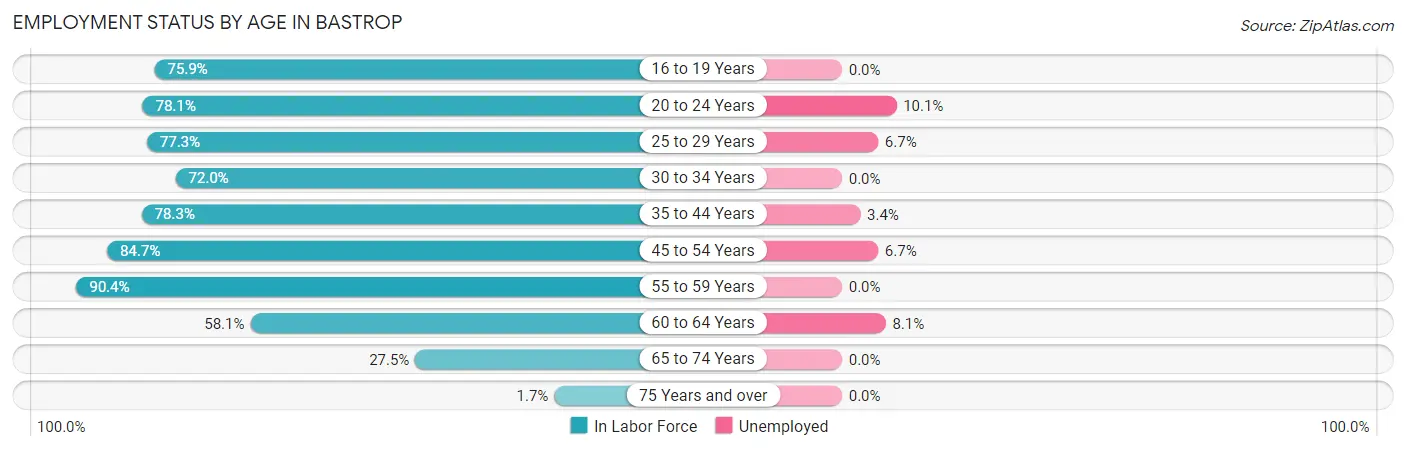
| Age Bracket | In Labor Force | Unemployed |
| 16 to 19 Years | 299 (75.9%) | 0 (0.0%) |
| 20 to 24 Years | 577 (78.1%) | 58 (10.1%) |
| 25 to 29 Years | 593 (77.3%) | 40 (6.7%) |
| 30 to 34 Years | 621 (72.0%) | 0 (0.0%) |
| 35 to 44 Years | 853 (78.3%) | 29 (3.4%) |
| 45 to 54 Years | 1,497 (84.7%) | 100 (6.7%) |
| 55 to 59 Years | 490 (90.4%) | 0 (0.0%) |
| 60 to 64 Years | 335 (58.1%) | 27 (8.1%) |
| 65 to 74 Years | 226 (27.5%) | 0 (0.0%) |
| 75 Years and over | 13 (1.7%) | 0 (0.0%) |
| Total | 5,506 (66.3%) | 253 (4.6%) |
Employment Status by Educational Attainment in Bastrop
According to labor force statistics for Bastrop, 78.3% of individuals (4,389) out of the total population between 25 and 64 years of age (5,605) are in the labor force, with 4.5% or 198 of them being unemployed. The group with the highest labor force participation rate are those with the educational attainment of bachelor's degree or higher, with 92.0% or 1,602 individuals in the labor force. Within the labor force, individuals with bachelor's degree or higher education have the highest percentage of unemployment, with 8.6% or 138 of them being unemployed.
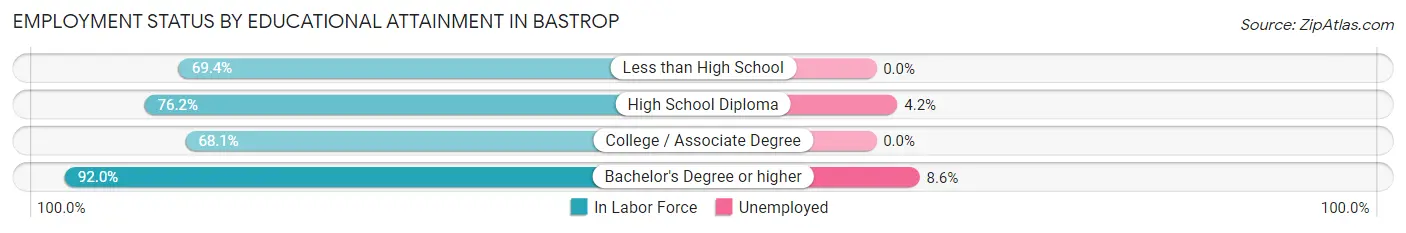
| Educational Attainment | In Labor Force | Unemployed |
| Less than High School | 456 (69.4%) | 0 (0.0%) |
| High School Diploma | 1,391 (76.2%) | 77 (4.2%) |
| College / Associate Degree | 940 (68.1%) | 0 (0.0%) |
| Bachelor's Degree or higher | 1,602 (92.0%) | 150 (8.6%) |
| Total | 4,389 (78.3%) | 252 (4.5%) |
Employment Occupations by Sex in Bastrop
Management, Business, Science and Arts Occupations
The most common Management, Business, Science and Arts occupations in Bastrop are Community & Social Service (853 | 16.3%), Management (769 | 14.6%), Education Instruction & Library (504 | 9.6%), Health Diagnosing & Treating (267 | 5.1%), and Computers, Engineering & Science (174 | 3.3%).

Management, Business, Science and Arts Occupations by Sex
Within the Management, Business, Science and Arts occupations in Bastrop, the most male-oriented occupations are Life, Physical & Social Science (100.0%), Computers & Mathematics (86.4%), and Computers, Engineering & Science (81.0%), while the most female-oriented occupations are Legal Services & Support (100.0%), Arts, Media & Entertainment (100.0%), and Health Diagnosing & Treating (92.1%).
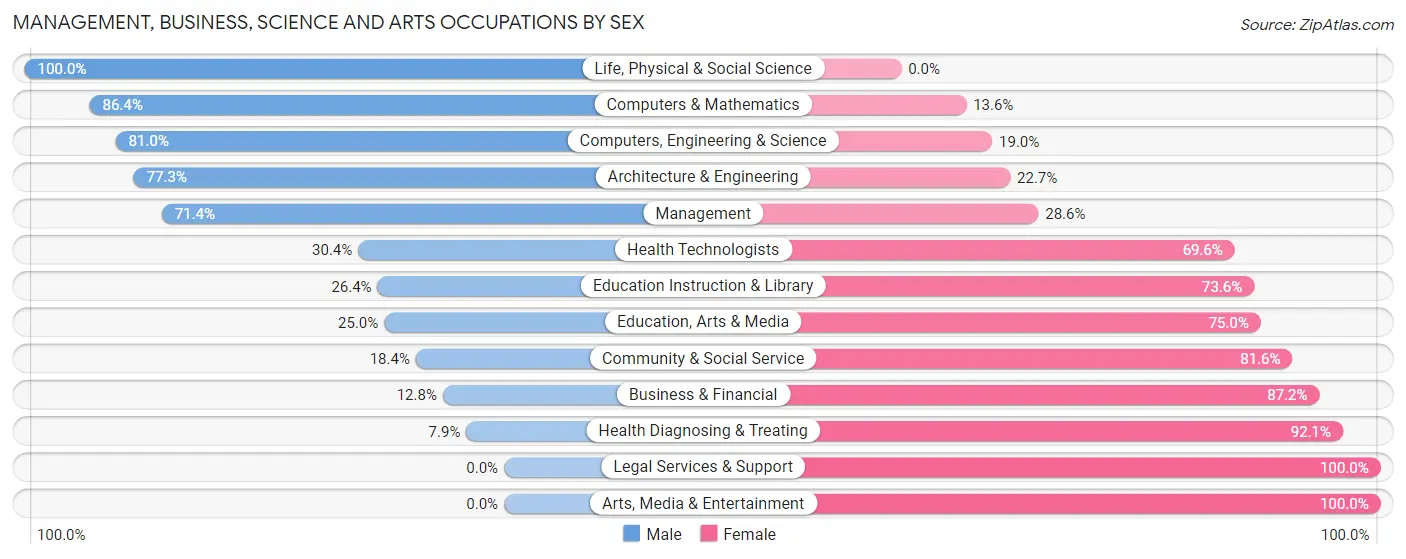
| Occupation | Male | Female |
| Management | 549 (71.4%) | 220 (28.6%) |
| Business & Financial | 18 (12.8%) | 123 (87.2%) |
| Computers, Engineering & Science | 141 (81.0%) | 33 (19.0%) |
| Computers & Mathematics | 51 (86.4%) | 8 (13.6%) |
| Architecture & Engineering | 85 (77.3%) | 25 (22.7%) |
| Life, Physical & Social Science | 5 (100.0%) | 0 (0.0%) |
| Community & Social Service | 157 (18.4%) | 696 (81.6%) |
| Education, Arts & Media | 24 (25.0%) | 72 (75.0%) |
| Legal Services & Support | 0 (0.0%) | 152 (100.0%) |
| Education Instruction & Library | 133 (26.4%) | 371 (73.6%) |
| Arts, Media & Entertainment | 0 (0.0%) | 101 (100.0%) |
| Health Diagnosing & Treating | 21 (7.9%) | 246 (92.1%) |
| Health Technologists | 21 (30.4%) | 48 (69.6%) |
| Total (Category) | 886 (40.2%) | 1,318 (59.8%) |
| Total (Overall) | 2,388 (45.5%) | 2,862 (54.5%) |
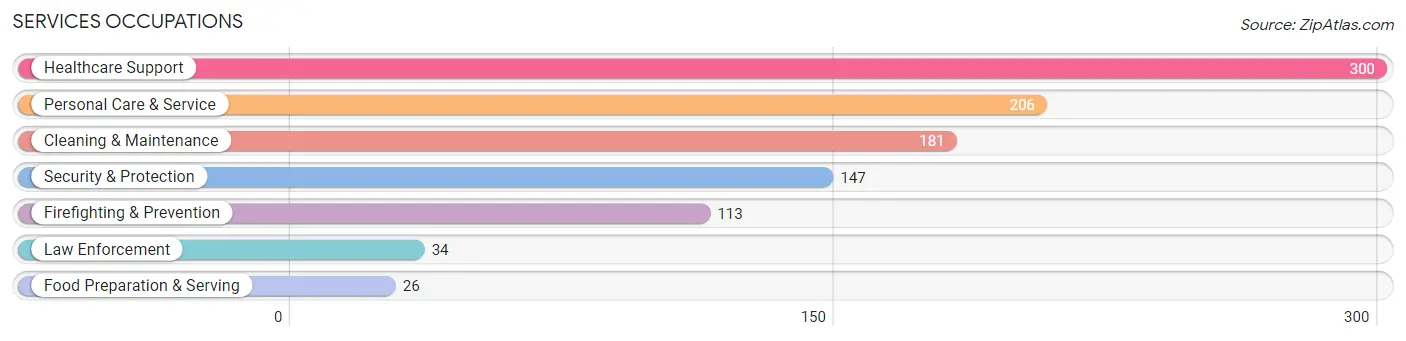
Services Occupations
The most common Services occupations in Bastrop are Healthcare Support (300 | 5.7%), Personal Care & Service (206 | 3.9%), Cleaning & Maintenance (181 | 3.5%), Security & Protection (147 | 2.8%), and Firefighting & Prevention (113 | 2.1%).
Services Occupations by Sex
Within the Services occupations in Bastrop, the most male-oriented occupations are Law Enforcement (100.0%), Cleaning & Maintenance (93.9%), and Healthcare Support (40.0%), while the most female-oriented occupations are Firefighting & Prevention (100.0%), Food Preparation & Serving (100.0%), and Personal Care & Service (85.4%).
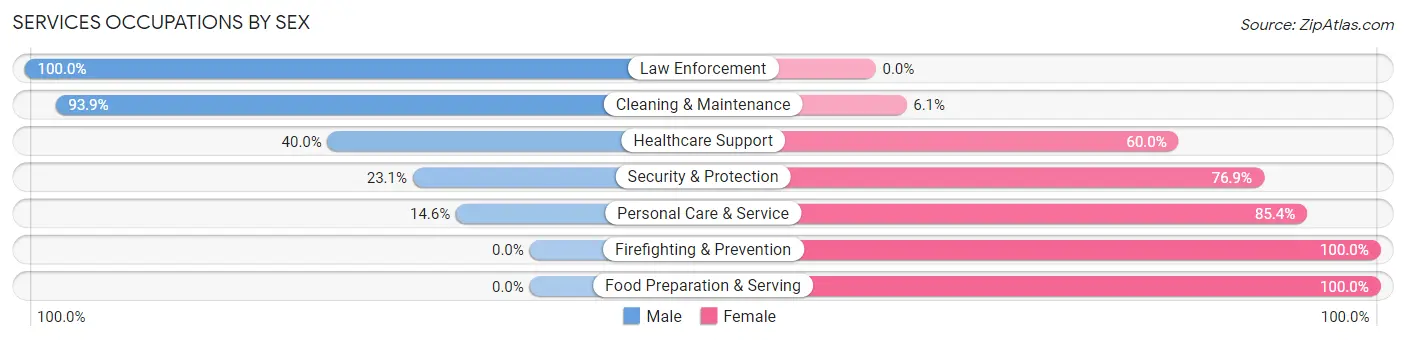
| Occupation | Male | Female |
| Healthcare Support | 120 (40.0%) | 180 (60.0%) |
| Security & Protection | 34 (23.1%) | 113 (76.9%) |
| Firefighting & Prevention | 0 (0.0%) | 113 (100.0%) |
| Law Enforcement | 34 (100.0%) | 0 (0.0%) |
| Food Preparation & Serving | 0 (0.0%) | 26 (100.0%) |
| Cleaning & Maintenance | 170 (93.9%) | 11 (6.1%) |
| Personal Care & Service | 30 (14.6%) | 176 (85.4%) |
| Total (Category) | 354 (41.2%) | 506 (58.8%) |
| Total (Overall) | 2,388 (45.5%) | 2,862 (54.5%) |
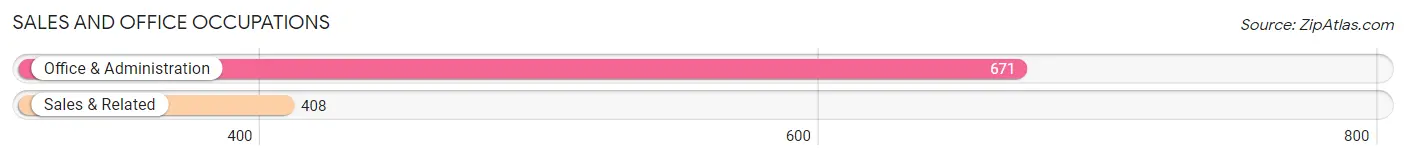
Sales and Office Occupations
The most common Sales and Office occupations in Bastrop are Office & Administration (671 | 12.8%), and Sales & Related (408 | 7.8%).
Sales and Office Occupations by Sex
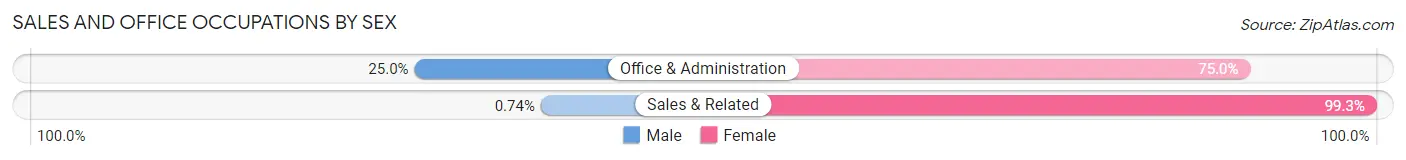
| Occupation | Male | Female |
| Sales & Related | 3 (0.7%) | 405 (99.3%) |
| Office & Administration | 168 (25.0%) | 503 (75.0%) |
| Total (Category) | 171 (15.9%) | 908 (84.2%) |
| Total (Overall) | 2,388 (45.5%) | 2,862 (54.5%) |
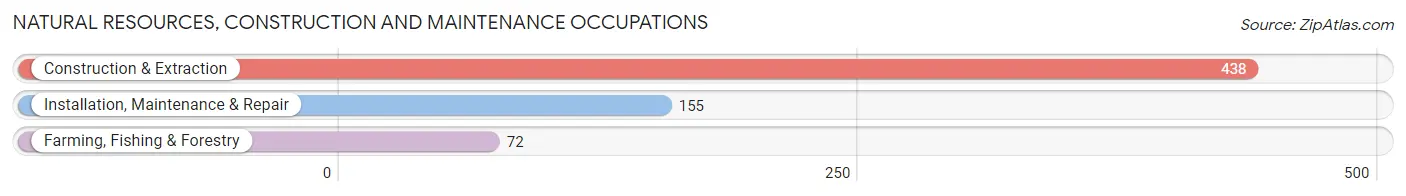
Natural Resources, Construction and Maintenance Occupations
The most common Natural Resources, Construction and Maintenance occupations in Bastrop are Construction & Extraction (438 | 8.3%), Installation, Maintenance & Repair (155 | 2.9%), and Farming, Fishing & Forestry (72 | 1.4%).
Natural Resources, Construction and Maintenance Occupations by Sex
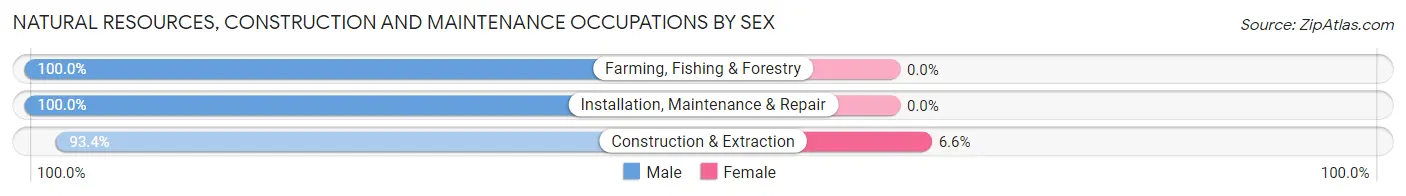
| Occupation | Male | Female |
| Farming, Fishing & Forestry | 72 (100.0%) | 0 (0.0%) |
| Construction & Extraction | 409 (93.4%) | 29 (6.6%) |
| Installation, Maintenance & Repair | 155 (100.0%) | 0 (0.0%) |
| Total (Category) | 636 (95.6%) | 29 (4.4%) |
| Total (Overall) | 2,388 (45.5%) | 2,862 (54.5%) |
Production, Transportation and Moving Occupations
The most common Production, Transportation and Moving occupations in Bastrop are Transportation (235 | 4.5%), Material Moving (118 | 2.2%), and Production (89 | 1.7%).
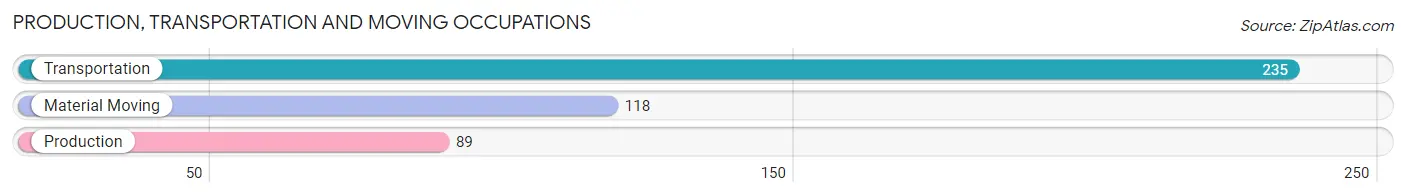
Production, Transportation and Moving Occupations by Sex
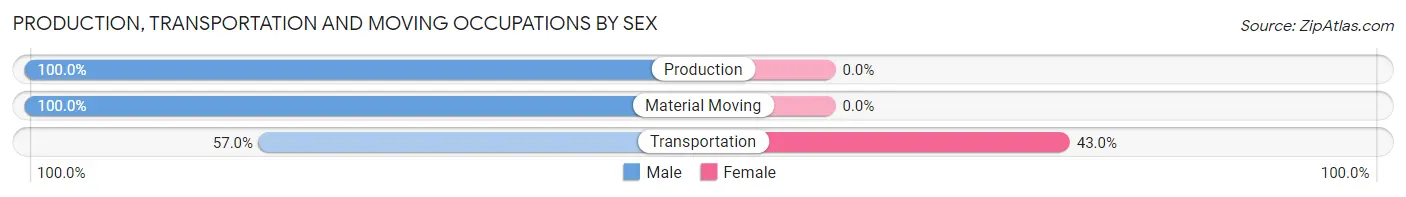
| Occupation | Male | Female |
| Production | 89 (100.0%) | 0 (0.0%) |
| Transportation | 134 (57.0%) | 101 (43.0%) |
| Material Moving | 118 (100.0%) | 0 (0.0%) |
| Total (Category) | 341 (77.1%) | 101 (22.9%) |
| Total (Overall) | 2,388 (45.5%) | 2,862 (54.5%) |
Employment Industries by Sex in Bastrop
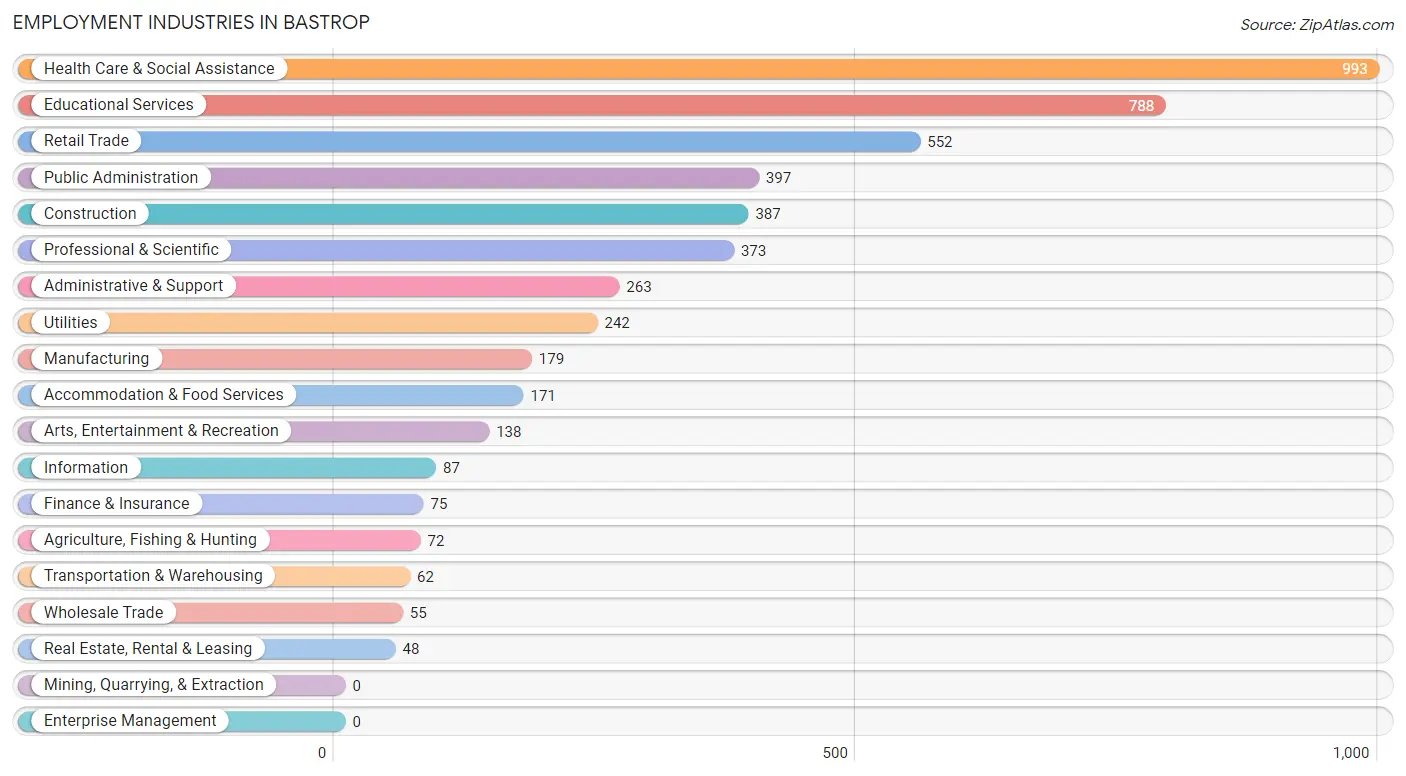
Employment Industries in Bastrop
The major employment industries in Bastrop include Health Care & Social Assistance (993 | 18.9%), Educational Services (788 | 15.0%), Retail Trade (552 | 10.5%), Public Administration (397 | 7.6%), and Construction (387 | 7.4%).
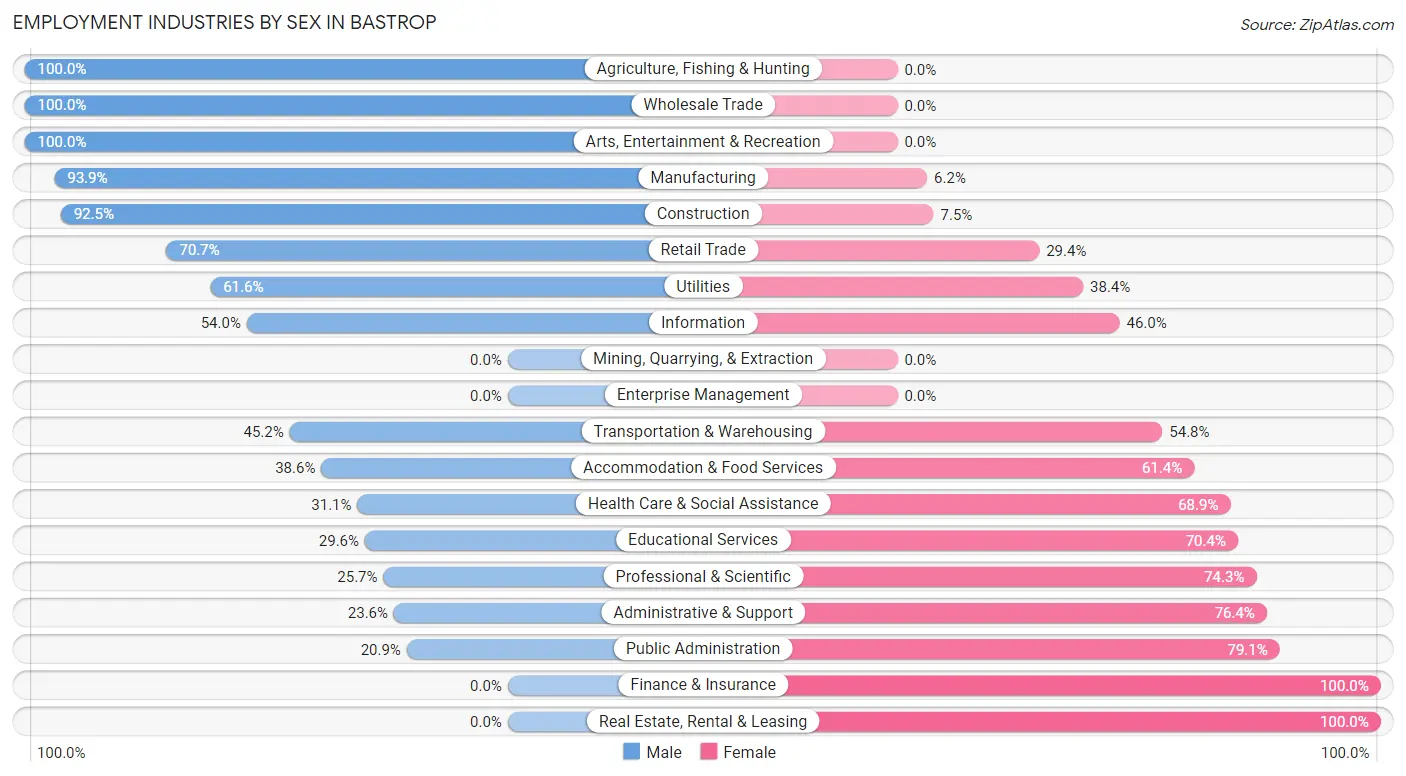
Employment Industries by Sex in Bastrop
The Bastrop industries that see more men than women are Agriculture, Fishing & Hunting (100.0%), Wholesale Trade (100.0%), and Arts, Entertainment & Recreation (100.0%), whereas the industries that tend to have a higher number of women are Finance & Insurance (100.0%), Real Estate, Rental & Leasing (100.0%), and Public Administration (79.1%).
| Industry | Male | Female |
| Agriculture, Fishing & Hunting | 72 (100.0%) | 0 (0.0%) |
| Mining, Quarrying, & Extraction | 0 (0.0%) | 0 (0.0%) |
| Construction | 358 (92.5%) | 29 (7.5%) |
| Manufacturing | 168 (93.9%) | 11 (6.1%) |
| Wholesale Trade | 55 (100.0%) | 0 (0.0%) |
| Retail Trade | 390 (70.7%) | 162 (29.3%) |
| Transportation & Warehousing | 28 (45.2%) | 34 (54.8%) |
| Utilities | 149 (61.6%) | 93 (38.4%) |
| Information | 47 (54.0%) | 40 (46.0%) |
| Finance & Insurance | 0 (0.0%) | 75 (100.0%) |
| Real Estate, Rental & Leasing | 0 (0.0%) | 48 (100.0%) |
| Professional & Scientific | 96 (25.7%) | 277 (74.3%) |
| Enterprise Management | 0 (0.0%) | 0 (0.0%) |
| Administrative & Support | 62 (23.6%) | 201 (76.4%) |
| Educational Services | 233 (29.6%) | 555 (70.4%) |
| Health Care & Social Assistance | 309 (31.1%) | 684 (68.9%) |
| Arts, Entertainment & Recreation | 138 (100.0%) | 0 (0.0%) |
| Accommodation & Food Services | 66 (38.6%) | 105 (61.4%) |
| Public Administration | 83 (20.9%) | 314 (79.1%) |
| Total | 2,388 (45.5%) | 2,862 (54.5%) |
Education in Bastrop
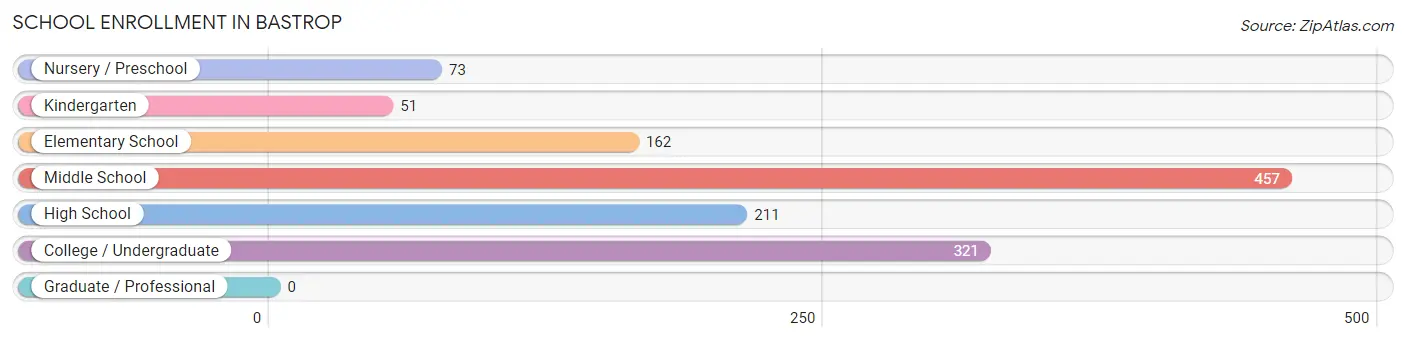
School Enrollment in Bastrop
The most common levels of schooling among the 1,275 students in Bastrop are middle school (457 | 35.8%), college / undergraduate (321 | 25.2%), and high school (211 | 16.6%).
| School Level | # Students | % Students |
| Nursery / Preschool | 73 | 5.7% |
| Kindergarten | 51 | 4.0% |
| Elementary School | 162 | 12.7% |
| Middle School | 457 | 35.8% |
| High School | 211 | 16.6% |
| College / Undergraduate | 321 | 25.2% |
| Graduate / Professional | 0 | 0.0% |
| Total | 1,275 | 100.0% |
School Enrollment by Age by Funding Source in Bastrop
Out of a total of 1,275 students who are enrolled in schools in Bastrop, 280 (22.0%) attend a private institution, while the remaining 994 (78.0%) are enrolled in public schools. The age group of 3 to 4 year olds has the highest likelihood of being enrolled in private schools, with 73 (100.0% in the age bracket) enrolled. Conversely, the age group of 20 to 24 year olds has the lowest likelihood of being enrolled in a private school, with 104 (100.0% in the age bracket) attending a public institution.
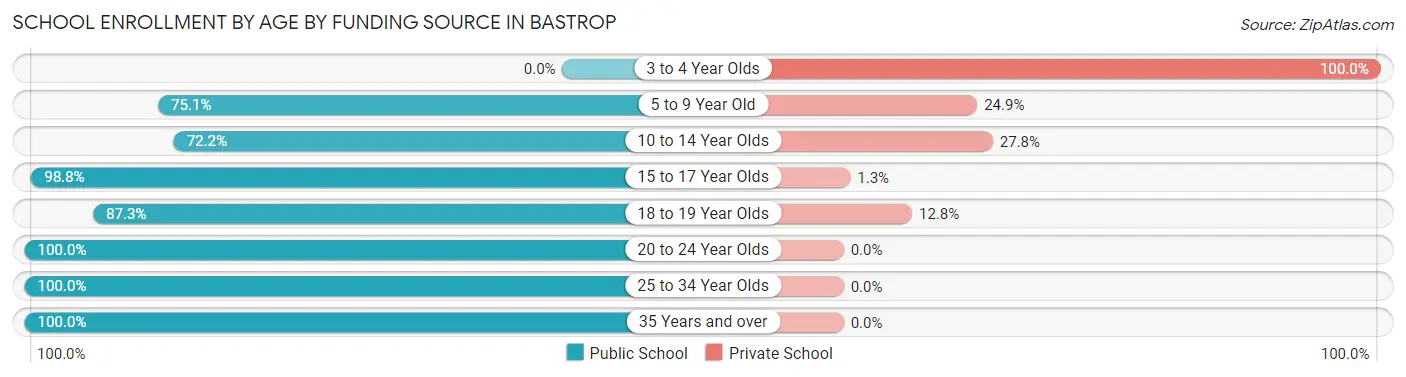
| Age Bracket | Public School | Private School |
| 3 to 4 Year Olds | 0 (0.0%) | 73 (100.0%) |
| 5 to 9 Year Old | 160 (75.1%) | 53 (24.9%) |
| 10 to 14 Year Olds | 330 (72.2%) | 127 (27.8%) |
| 15 to 17 Year Olds | 158 (98.8%) | 2 (1.3%) |
| 18 to 19 Year Olds | 178 (87.3%) | 26 (12.8%) |
| 20 to 24 Year Olds | 104 (100.0%) | 0 (0.0%) |
| 25 to 34 Year Olds | 25 (100.0%) | 0 (0.0%) |
| 35 Years and over | 39 (100.0%) | 0 (0.0%) |
| Total | 994 (78.0%) | 280 (22.0%) |
Educational Attainment by Field of Study in Bastrop
Social sciences (527 | 22.8%), business (341 | 14.8%), education (232 | 10.0%), communications (186 | 8.1%), and arts & humanities (184 | 8.0%) are the most common fields of study among 2,311 individuals in Bastrop who have obtained a bachelor's degree or higher.
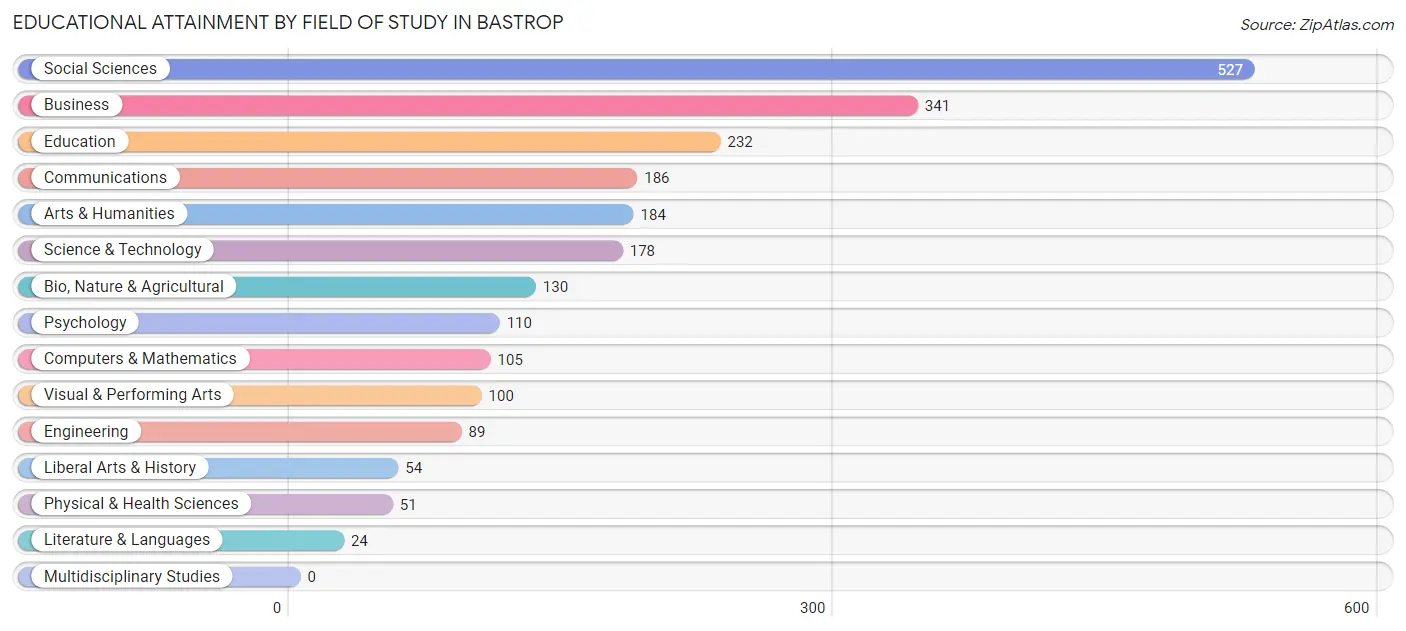
| Field of Study | # Graduates | % Graduates |
| Computers & Mathematics | 105 | 4.5% |
| Bio, Nature & Agricultural | 130 | 5.6% |
| Physical & Health Sciences | 51 | 2.2% |
| Psychology | 110 | 4.8% |
| Social Sciences | 527 | 22.8% |
| Engineering | 89 | 3.8% |
| Multidisciplinary Studies | 0 | 0.0% |
| Science & Technology | 178 | 7.7% |
| Business | 341 | 14.8% |
| Education | 232 | 10.0% |
| Literature & Languages | 24 | 1.0% |
| Liberal Arts & History | 54 | 2.3% |
| Visual & Performing Arts | 100 | 4.3% |
| Communications | 186 | 8.1% |
| Arts & Humanities | 184 | 8.0% |
| Total | 2,311 | 100.0% |
Transportation & Commute in Bastrop
Vehicle Availability by Sex in Bastrop
The most prevalent vehicle ownership categories in Bastrop are males with 2 vehicles (1,114, accounting for 46.7%) and females with 2 vehicles (1,072, making up 38.9%).
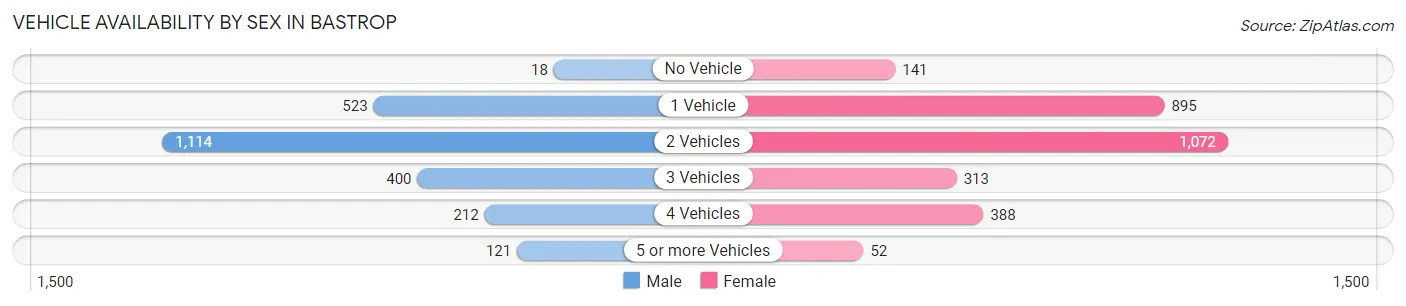
| Vehicles Available | Male | Female |
| No Vehicle | 18 (0.7%) | 141 (4.9%) |
| 1 Vehicle | 523 (21.9%) | 895 (31.3%) |
| 2 Vehicles | 1,114 (46.7%) | 1,072 (37.5%) |
| 3 Vehicles | 400 (16.8%) | 313 (10.9%) |
| 4 Vehicles | 212 (8.9%) | 388 (13.6%) |
| 5 or more Vehicles | 121 (5.1%) | 52 (1.8%) |
| Total | 2,388 (100.0%) | 2,861 (100.0%) |
Commute Time in Bastrop
The most frequently occuring commute durations in Bastrop are 5 to 9 minutes (1,001 commuters, 20.7%), 45 to 59 minutes (731 commuters, 15.1%), and 10 to 14 minutes (687 commuters, 14.2%).
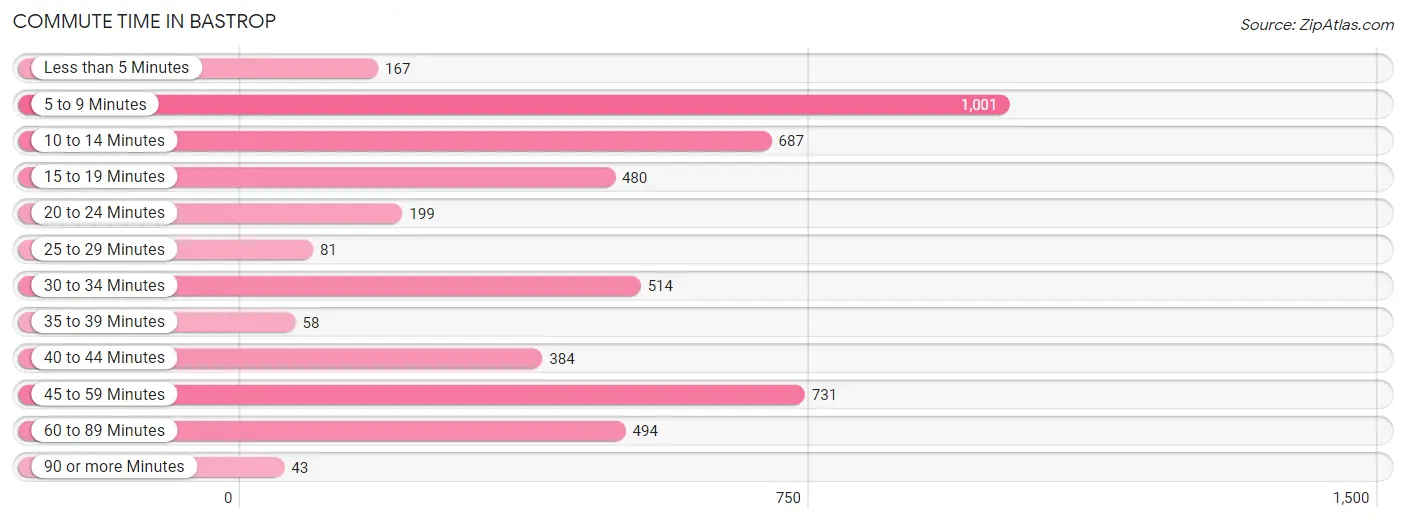
| Commute Time | # Commuters | % Commuters |
| Less than 5 Minutes | 167 | 3.5% |
| 5 to 9 Minutes | 1,001 | 20.7% |
| 10 to 14 Minutes | 687 | 14.2% |
| 15 to 19 Minutes | 480 | 9.9% |
| 20 to 24 Minutes | 199 | 4.1% |
| 25 to 29 Minutes | 81 | 1.7% |
| 30 to 34 Minutes | 514 | 10.6% |
| 35 to 39 Minutes | 58 | 1.2% |
| 40 to 44 Minutes | 384 | 7.9% |
| 45 to 59 Minutes | 731 | 15.1% |
| 60 to 89 Minutes | 494 | 10.2% |
| 90 or more Minutes | 43 | 0.9% |
Commute Time by Sex in Bastrop
The most common commute times in Bastrop are 30 to 34 minutes (473 commuters, 20.6%) for males and 5 to 9 minutes (706 commuters, 27.7%) for females.
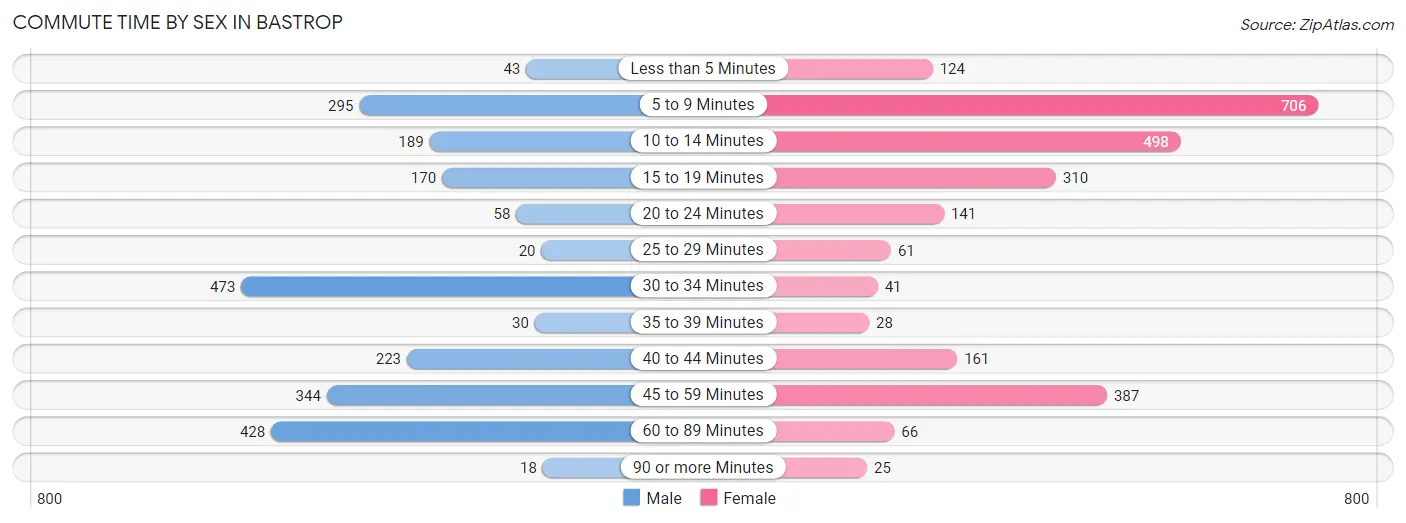
| Commute Time | Male | Female |
| Less than 5 Minutes | 43 (1.9%) | 124 (4.9%) |
| 5 to 9 Minutes | 295 (12.9%) | 706 (27.7%) |
| 10 to 14 Minutes | 189 (8.3%) | 498 (19.5%) |
| 15 to 19 Minutes | 170 (7.4%) | 310 (12.2%) |
| 20 to 24 Minutes | 58 (2.5%) | 141 (5.5%) |
| 25 to 29 Minutes | 20 (0.9%) | 61 (2.4%) |
| 30 to 34 Minutes | 473 (20.6%) | 41 (1.6%) |
| 35 to 39 Minutes | 30 (1.3%) | 28 (1.1%) |
| 40 to 44 Minutes | 223 (9.7%) | 161 (6.3%) |
| 45 to 59 Minutes | 344 (15.0%) | 387 (15.2%) |
| 60 to 89 Minutes | 428 (18.7%) | 66 (2.6%) |
| 90 or more Minutes | 18 (0.8%) | 25 (1.0%) |
Time of Departure to Work by Sex in Bastrop
The most frequent times of departure to work in Bastrop are 5:00 AM to 5:29 AM (430, 18.8%) for males and 6:00 AM to 6:29 AM (557, 21.9%) for females.
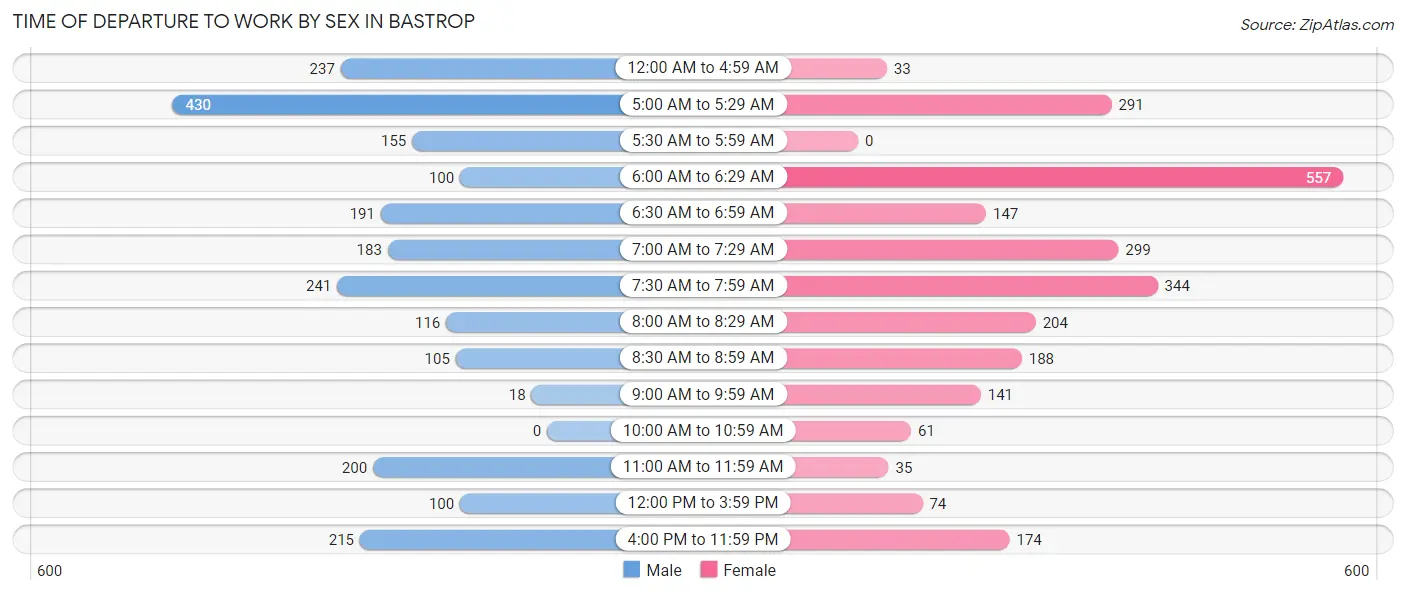
| Time of Departure | Male | Female |
| 12:00 AM to 4:59 AM | 237 (10.3%) | 33 (1.3%) |
| 5:00 AM to 5:29 AM | 430 (18.8%) | 291 (11.4%) |
| 5:30 AM to 5:59 AM | 155 (6.8%) | 0 (0.0%) |
| 6:00 AM to 6:29 AM | 100 (4.4%) | 557 (21.9%) |
| 6:30 AM to 6:59 AM | 191 (8.3%) | 147 (5.8%) |
| 7:00 AM to 7:29 AM | 183 (8.0%) | 299 (11.7%) |
| 7:30 AM to 7:59 AM | 241 (10.5%) | 344 (13.5%) |
| 8:00 AM to 8:29 AM | 116 (5.1%) | 204 (8.0%) |
| 8:30 AM to 8:59 AM | 105 (4.6%) | 188 (7.4%) |
| 9:00 AM to 9:59 AM | 18 (0.8%) | 141 (5.5%) |
| 10:00 AM to 10:59 AM | 0 (0.0%) | 61 (2.4%) |
| 11:00 AM to 11:59 AM | 200 (8.7%) | 35 (1.4%) |
| 12:00 PM to 3:59 PM | 100 (4.4%) | 74 (2.9%) |
| 4:00 PM to 11:59 PM | 215 (9.4%) | 174 (6.8%) |
| Total | 2,291 (100.0%) | 2,548 (100.0%) |
Housing Occupancy in Bastrop
Occupancy by Ownership in Bastrop
Of the total 4,156 dwellings in Bastrop, owner-occupied units account for 2,256 (54.3%), while renter-occupied units make up 1,900 (45.7%).
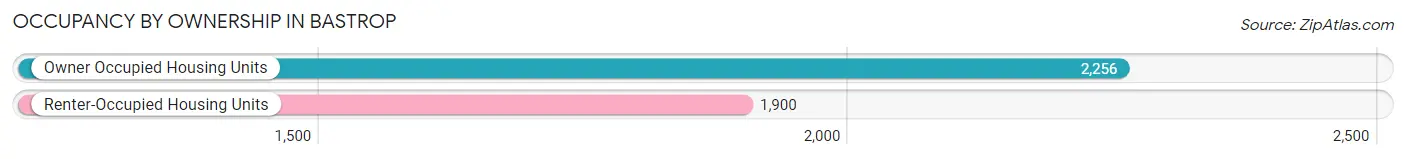
| Occupancy | # Housing Units | % Housing Units |
| Owner Occupied Housing Units | 2,256 | 54.3% |
| Renter-Occupied Housing Units | 1,900 | 45.7% |
| Total Occupied Housing Units | 4,156 | 100.0% |
Occupancy by Household Size in Bastrop
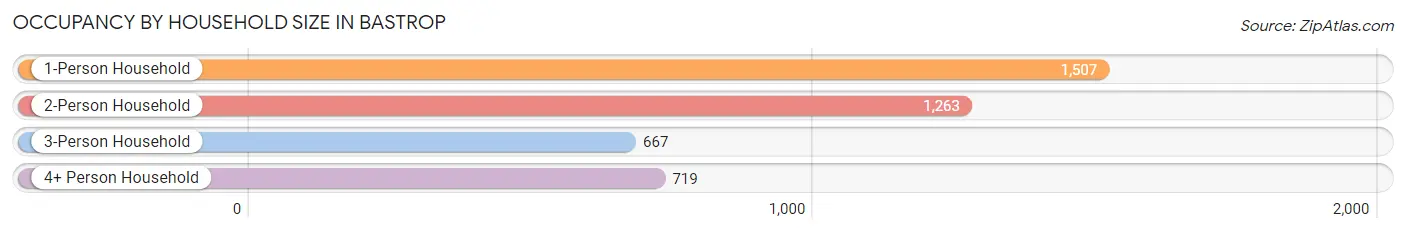
| Household Size | # Housing Units | % Housing Units |
| 1-Person Household | 1,507 | 36.3% |
| 2-Person Household | 1,263 | 30.4% |
| 3-Person Household | 667 | 16.1% |
| 4+ Person Household | 719 | 17.3% |
| Total Housing Units | 4,156 | 100.0% |
Occupancy by Ownership by Household Size in Bastrop
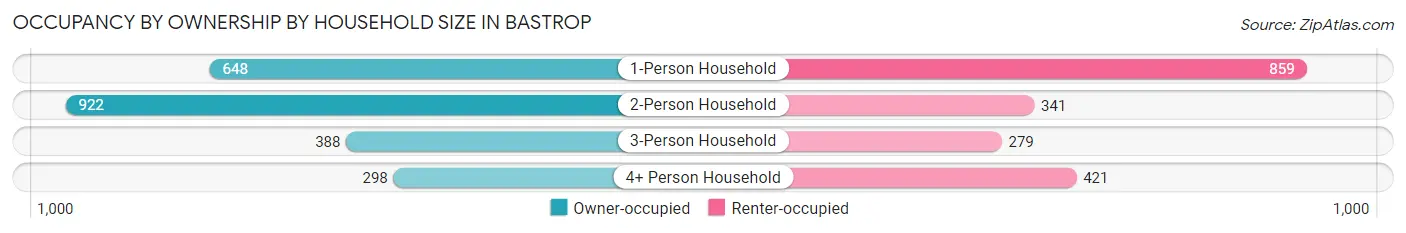
| Household Size | Owner-occupied | Renter-occupied |
| 1-Person Household | 648 (43.0%) | 859 (57.0%) |
| 2-Person Household | 922 (73.0%) | 341 (27.0%) |
| 3-Person Household | 388 (58.2%) | 279 (41.8%) |
| 4+ Person Household | 298 (41.4%) | 421 (58.6%) |
| Total Housing Units | 2,256 (54.3%) | 1,900 (45.7%) |
Occupancy by Educational Attainment in Bastrop
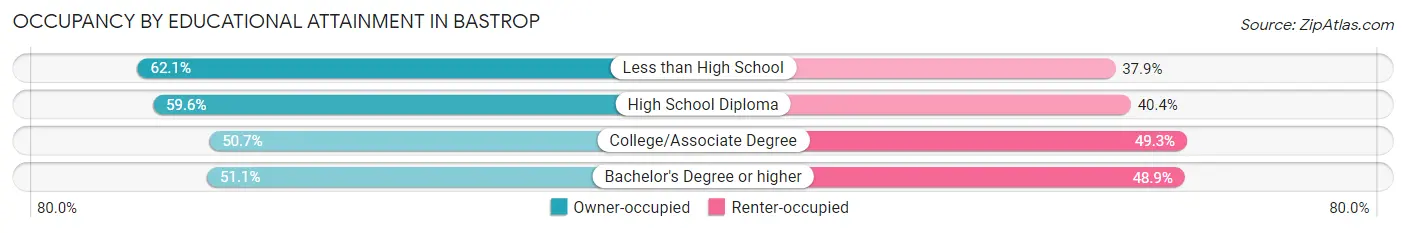
| Household Size | Owner-occupied | Renter-occupied |
| Less than High School | 221 (62.1%) | 135 (37.9%) |
| High School Diploma | 684 (59.6%) | 463 (40.4%) |
| College/Associate Degree | 533 (50.7%) | 518 (49.3%) |
| Bachelor's Degree or higher | 818 (51.1%) | 784 (48.9%) |
Occupancy by Age of Householder in Bastrop
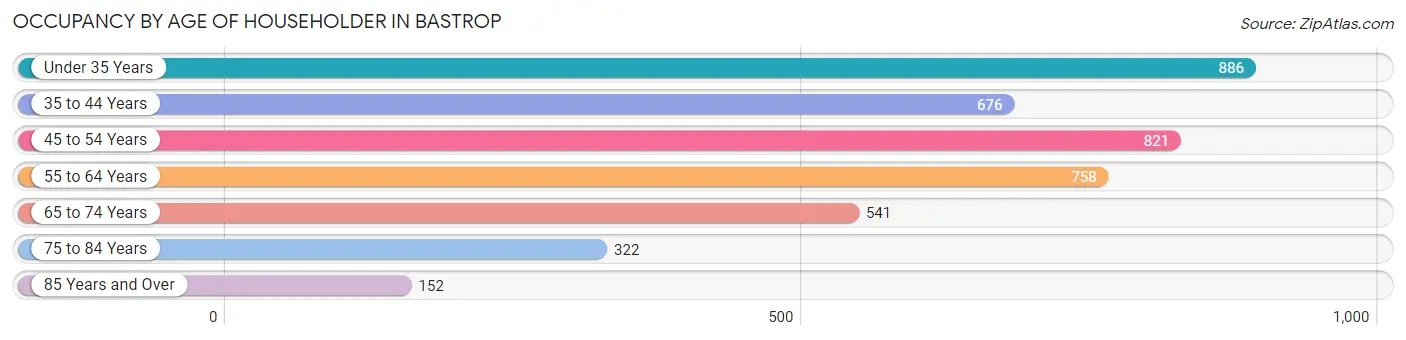
| Age Bracket | # Households | % Households |
| Under 35 Years | 886 | 21.3% |
| 35 to 44 Years | 676 | 16.3% |
| 45 to 54 Years | 821 | 19.8% |
| 55 to 64 Years | 758 | 18.2% |
| 65 to 74 Years | 541 | 13.0% |
| 75 to 84 Years | 322 | 7.7% |
| 85 Years and Over | 152 | 3.7% |
| Total | 4,156 | 100.0% |
Housing Finances in Bastrop
Median Income by Occupancy in Bastrop
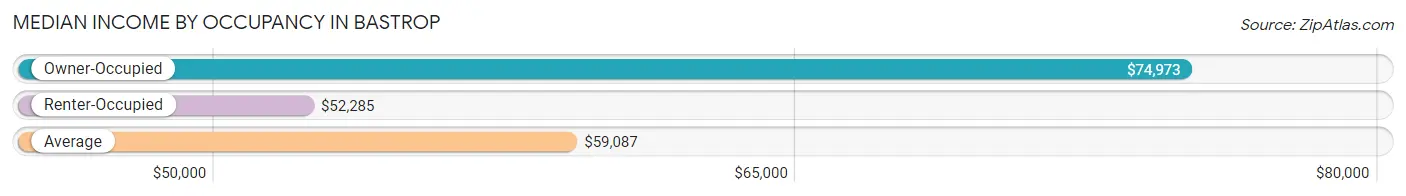
| Occupancy Type | # Households | Median Income |
| Owner-Occupied | 2,256 (54.3%) | $74,973 |
| Renter-Occupied | 1,900 (45.7%) | $52,285 |
| Average | 4,156 (100.0%) | $59,087 |
Occupancy by Householder Income Bracket in Bastrop
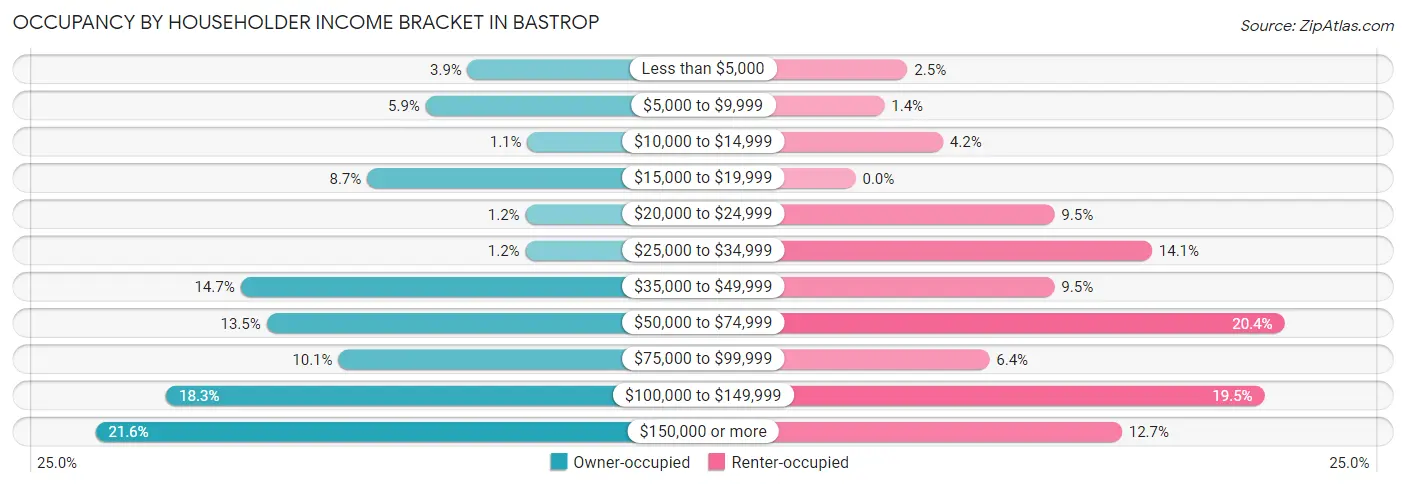
| Income Bracket | Owner-occupied | Renter-occupied |
| Less than $5,000 | 88 (3.9%) | 47 (2.5%) |
| $5,000 to $9,999 | 133 (5.9%) | 26 (1.4%) |
| $10,000 to $14,999 | 24 (1.1%) | 79 (4.2%) |
| $15,000 to $19,999 | 196 (8.7%) | 0 (0.0%) |
| $20,000 to $24,999 | 26 (1.1%) | 180 (9.5%) |
| $25,000 to $34,999 | 26 (1.1%) | 268 (14.1%) |
| $35,000 to $49,999 | 332 (14.7%) | 180 (9.5%) |
| $50,000 to $74,999 | 304 (13.5%) | 388 (20.4%) |
| $75,000 to $99,999 | 227 (10.1%) | 121 (6.4%) |
| $100,000 to $149,999 | 412 (18.3%) | 370 (19.5%) |
| $150,000 or more | 488 (21.6%) | 241 (12.7%) |
| Total | 2,256 (100.0%) | 1,900 (100.0%) |
Monthly Housing Cost Tiers in Bastrop
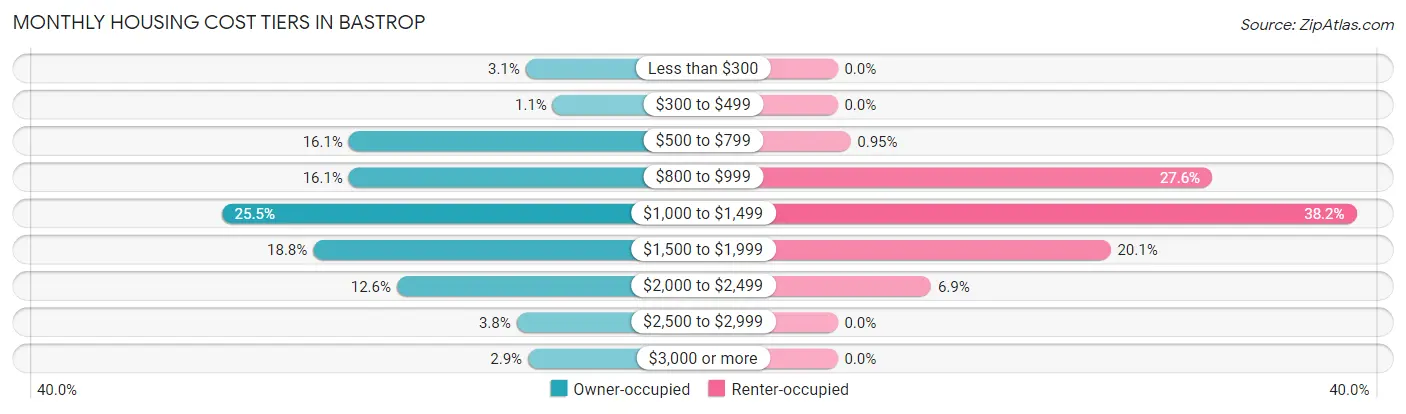
| Monthly Cost | Owner-occupied | Renter-occupied |
| Less than $300 | 70 (3.1%) | 0 (0.0%) |
| $300 to $499 | 25 (1.1%) | 0 (0.0%) |
| $500 to $799 | 364 (16.1%) | 18 (0.9%) |
| $800 to $999 | 364 (16.1%) | 524 (27.6%) |
| $1,000 to $1,499 | 575 (25.5%) | 726 (38.2%) |
| $1,500 to $1,999 | 423 (18.8%) | 382 (20.1%) |
| $2,000 to $2,499 | 284 (12.6%) | 131 (6.9%) |
| $2,500 to $2,999 | 85 (3.8%) | 0 (0.0%) |
| $3,000 or more | 66 (2.9%) | 0 (0.0%) |
| Total | 2,256 (100.0%) | 1,900 (100.0%) |
Physical Housing Characteristics in Bastrop
Housing Structures in Bastrop
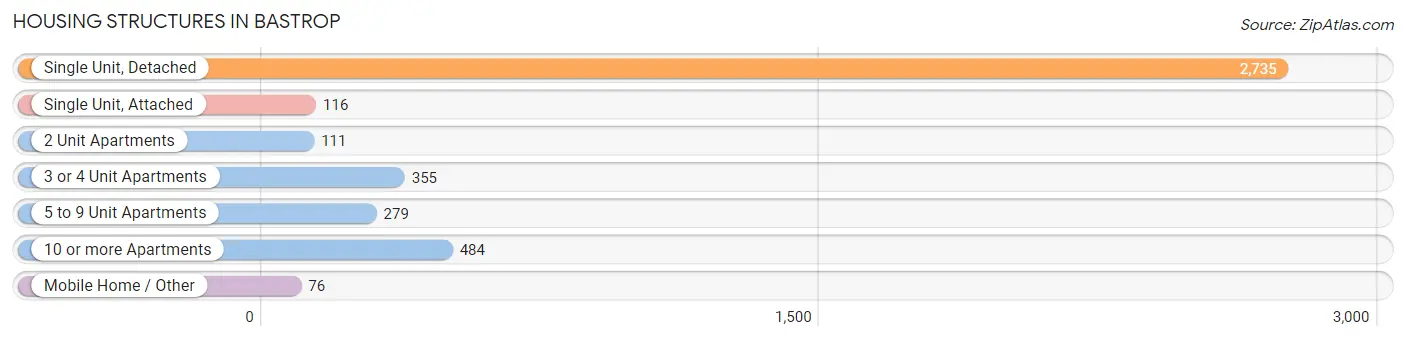
| Structure Type | # Housing Units | % Housing Units |
| Single Unit, Detached | 2,735 | 65.8% |
| Single Unit, Attached | 116 | 2.8% |
| 2 Unit Apartments | 111 | 2.7% |
| 3 or 4 Unit Apartments | 355 | 8.5% |
| 5 to 9 Unit Apartments | 279 | 6.7% |
| 10 or more Apartments | 484 | 11.7% |
| Mobile Home / Other | 76 | 1.8% |
| Total | 4,156 | 100.0% |
Housing Structures by Occupancy in Bastrop
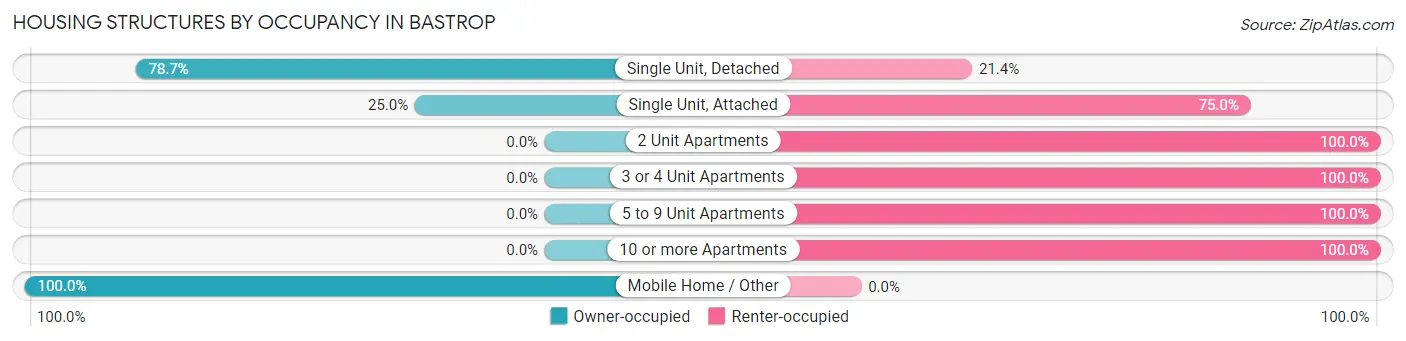
| Structure Type | Owner-occupied | Renter-occupied |
| Single Unit, Detached | 2,151 (78.6%) | 584 (21.3%) |
| Single Unit, Attached | 29 (25.0%) | 87 (75.0%) |
| 2 Unit Apartments | 0 (0.0%) | 111 (100.0%) |
| 3 or 4 Unit Apartments | 0 (0.0%) | 355 (100.0%) |
| 5 to 9 Unit Apartments | 0 (0.0%) | 279 (100.0%) |
| 10 or more Apartments | 0 (0.0%) | 484 (100.0%) |
| Mobile Home / Other | 76 (100.0%) | 0 (0.0%) |
| Total | 2,256 (54.3%) | 1,900 (45.7%) |
Housing Structures by Number of Rooms in Bastrop
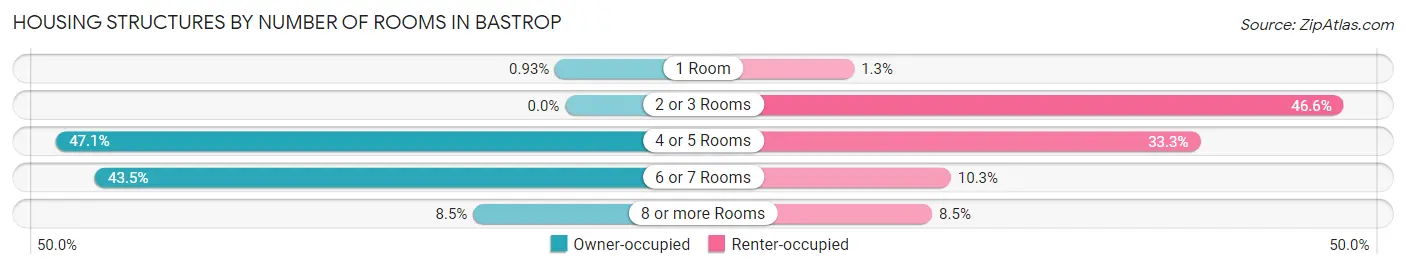
| Number of Rooms | Owner-occupied | Renter-occupied |
| 1 Room | 21 (0.9%) | 25 (1.3%) |
| 2 or 3 Rooms | 0 (0.0%) | 885 (46.6%) |
| 4 or 5 Rooms | 1,062 (47.1%) | 633 (33.3%) |
| 6 or 7 Rooms | 981 (43.5%) | 195 (10.3%) |
| 8 or more Rooms | 192 (8.5%) | 162 (8.5%) |
| Total | 2,256 (100.0%) | 1,900 (100.0%) |
Housing Structure by Heating Type in Bastrop
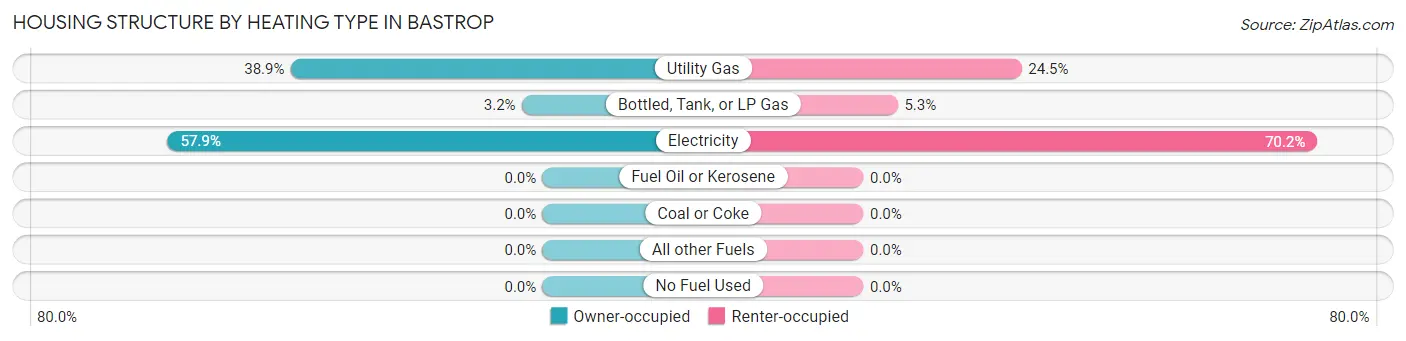
| Heating Type | Owner-occupied | Renter-occupied |
| Utility Gas | 878 (38.9%) | 465 (24.5%) |
| Bottled, Tank, or LP Gas | 72 (3.2%) | 101 (5.3%) |
| Electricity | 1,306 (57.9%) | 1,334 (70.2%) |
| Fuel Oil or Kerosene | 0 (0.0%) | 0 (0.0%) |
| Coal or Coke | 0 (0.0%) | 0 (0.0%) |
| All other Fuels | 0 (0.0%) | 0 (0.0%) |
| No Fuel Used | 0 (0.0%) | 0 (0.0%) |
| Total | 2,256 (100.0%) | 1,900 (100.0%) |
Household Vehicle Usage in Bastrop
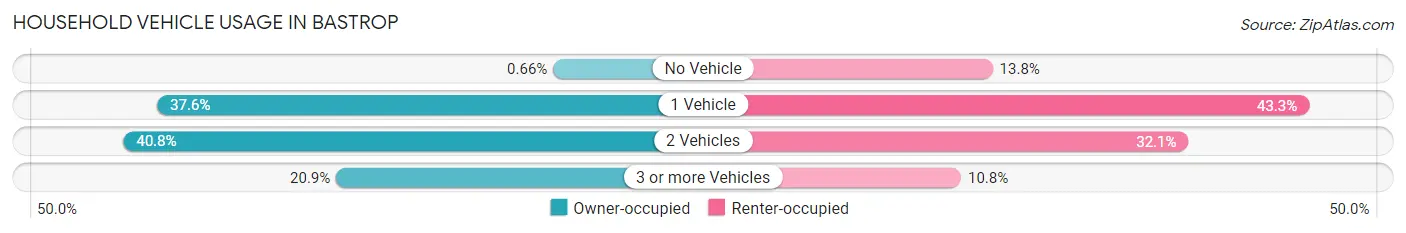
| Vehicles per Household | Owner-occupied | Renter-occupied |
| No Vehicle | 15 (0.7%) | 262 (13.8%) |
| 1 Vehicle | 849 (37.6%) | 823 (43.3%) |
| 2 Vehicles | 920 (40.8%) | 609 (32.1%) |
| 3 or more Vehicles | 472 (20.9%) | 206 (10.8%) |
| Total | 2,256 (100.0%) | 1,900 (100.0%) |
Real Estate & Mortgages in Bastrop
Real Estate and Mortgage Overview in Bastrop
| Characteristic | Without Mortgage | With Mortgage |
| Housing Units | 649 | 1,607 |
| Median Property Value | $237,900 | $245,100 |
| Median Household Income | $68,145 | $381 |
| Monthly Housing Costs | $711 | $66 |
| Real Estate Taxes | $4,850 | $50 |
Property Value by Mortgage Status in Bastrop
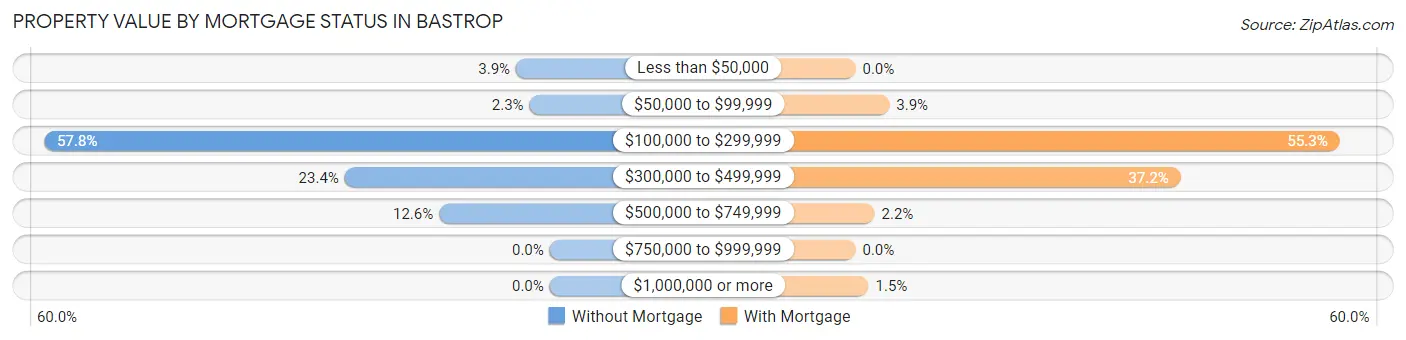
| Property Value | Without Mortgage | With Mortgage |
| Less than $50,000 | 25 (3.8%) | 0 (0.0%) |
| $50,000 to $99,999 | 15 (2.3%) | 62 (3.9%) |
| $100,000 to $299,999 | 375 (57.8%) | 889 (55.3%) |
| $300,000 to $499,999 | 152 (23.4%) | 597 (37.1%) |
| $500,000 to $749,999 | 82 (12.6%) | 35 (2.2%) |
| $750,000 to $999,999 | 0 (0.0%) | 0 (0.0%) |
| $1,000,000 or more | 0 (0.0%) | 24 (1.5%) |
| Total | 649 (100.0%) | 1,607 (100.0%) |
Household Income by Mortgage Status in Bastrop
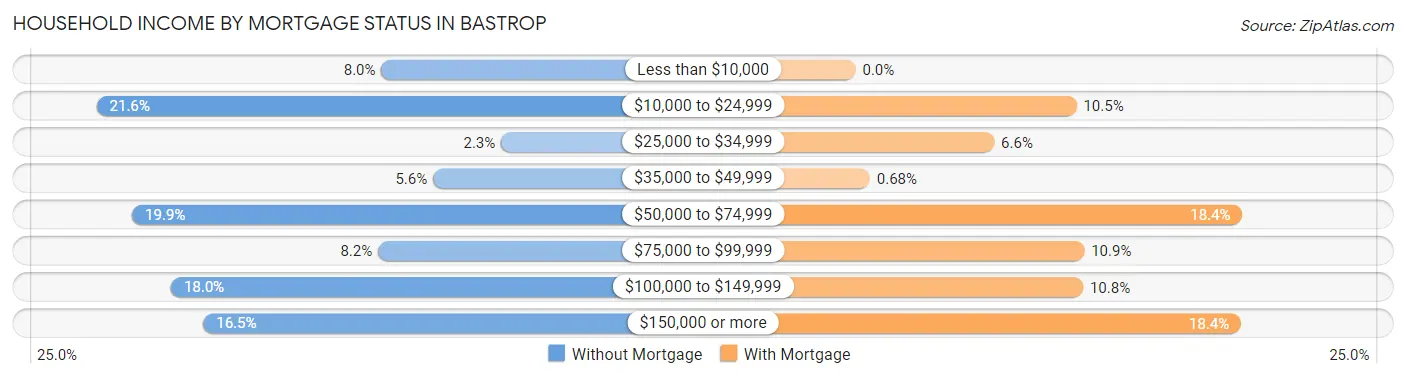
| Household Income | Without Mortgage | With Mortgage |
| Less than $10,000 | 52 (8.0%) | 0 (0.0%) |
| $10,000 to $24,999 | 140 (21.6%) | 169 (10.5%) |
| $25,000 to $34,999 | 15 (2.3%) | 106 (6.6%) |
| $35,000 to $49,999 | 36 (5.6%) | 11 (0.7%) |
| $50,000 to $74,999 | 129 (19.9%) | 296 (18.4%) |
| $75,000 to $99,999 | 53 (8.2%) | 175 (10.9%) |
| $100,000 to $149,999 | 117 (18.0%) | 174 (10.8%) |
| $150,000 or more | 107 (16.5%) | 295 (18.4%) |
| Total | 649 (100.0%) | 1,607 (100.0%) |
Property Value to Household Income Ratio in Bastrop
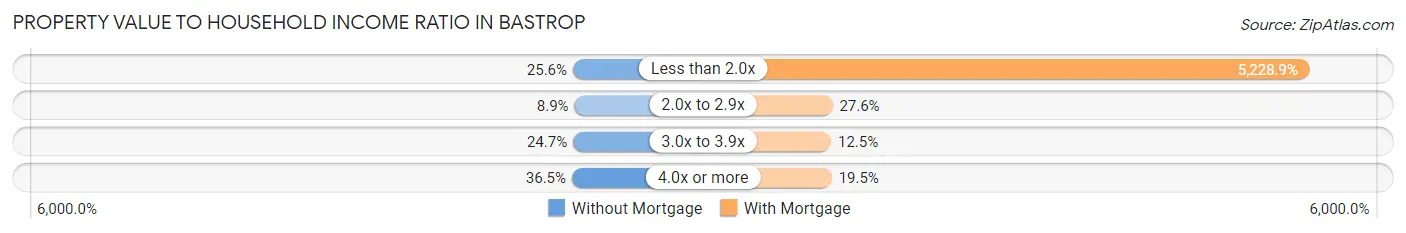
| Value-to-Income Ratio | Without Mortgage | With Mortgage |
| Less than 2.0x | 166 (25.6%) | 84,028 (5,228.9%) |
| 2.0x to 2.9x | 58 (8.9%) | 443 (27.6%) |
| 3.0x to 3.9x | 160 (24.6%) | 200 (12.4%) |
| 4.0x or more | 237 (36.5%) | 313 (19.5%) |
| Total | 649 (100.0%) | 1,607 (100.0%) |
Real Estate Taxes by Mortgage Status in Bastrop
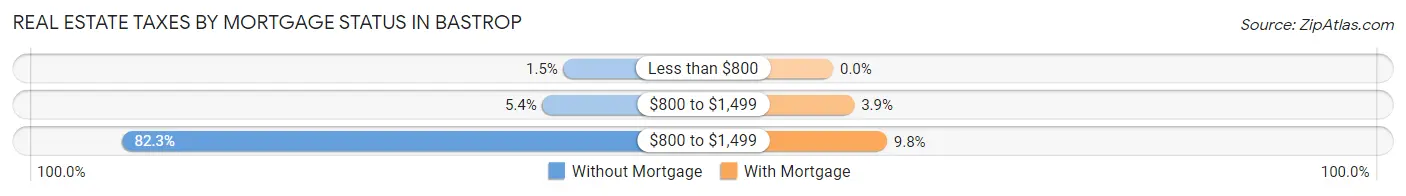
| Property Taxes | Without Mortgage | With Mortgage |
| Less than $800 | 10 (1.5%) | 0 (0.0%) |
| $800 to $1,499 | 35 (5.4%) | 62 (3.9%) |
| $800 to $1,499 | 534 (82.3%) | 158 (9.8%) |
| Total | 649 (100.0%) | 1,607 (100.0%) |
Health & Disability in Bastrop
Health Insurance Coverage by Age in Bastrop
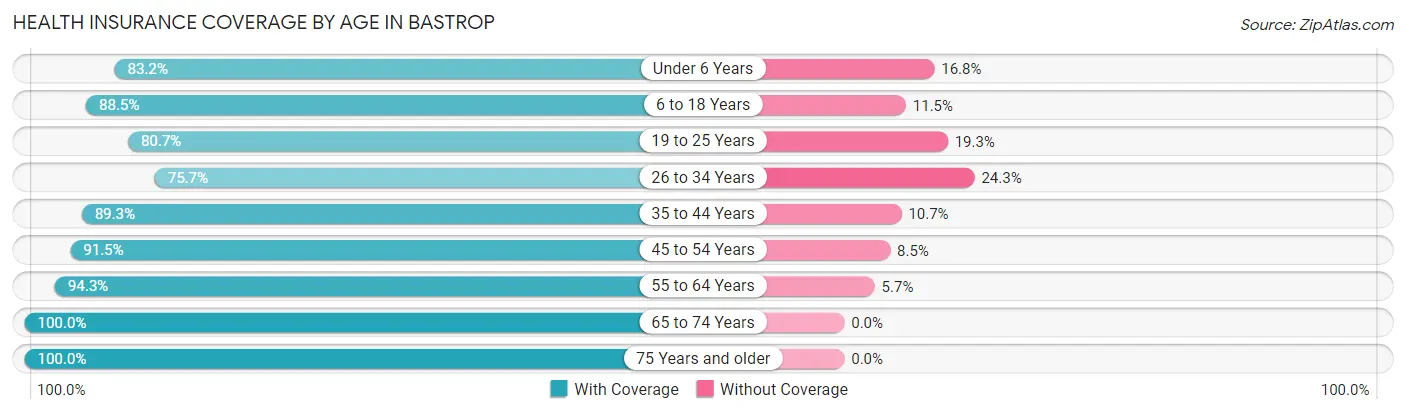
| Age Bracket | With Coverage | Without Coverage |
| Under 6 Years | 724 (83.2%) | 146 (16.8%) |
| 6 to 18 Years | 948 (88.5%) | 123 (11.5%) |
| 19 to 25 Years | 745 (80.7%) | 178 (19.3%) |
| 26 to 34 Years | 1,076 (75.7%) | 345 (24.3%) |
| 35 to 44 Years | 897 (89.3%) | 107 (10.7%) |
| 45 to 54 Years | 1,543 (91.5%) | 144 (8.5%) |
| 55 to 64 Years | 1,033 (94.3%) | 62 (5.7%) |
| 65 to 74 Years | 697 (100.0%) | 0 (0.0%) |
| 75 Years and older | 613 (100.0%) | 0 (0.0%) |
| Total | 8,276 (88.2%) | 1,105 (11.8%) |
Health Insurance Coverage by Citizenship Status in Bastrop
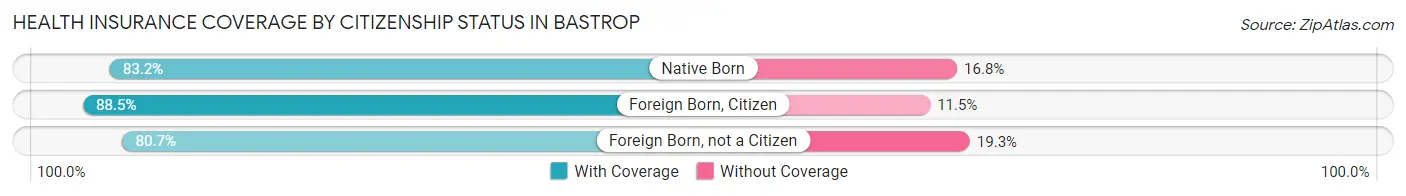
| Citizenship Status | With Coverage | Without Coverage |
| Native Born | 724 (83.2%) | 146 (16.8%) |
| Foreign Born, Citizen | 948 (88.5%) | 123 (11.5%) |
| Foreign Born, not a Citizen | 745 (80.7%) | 178 (19.3%) |
Health Insurance Coverage by Household Income in Bastrop
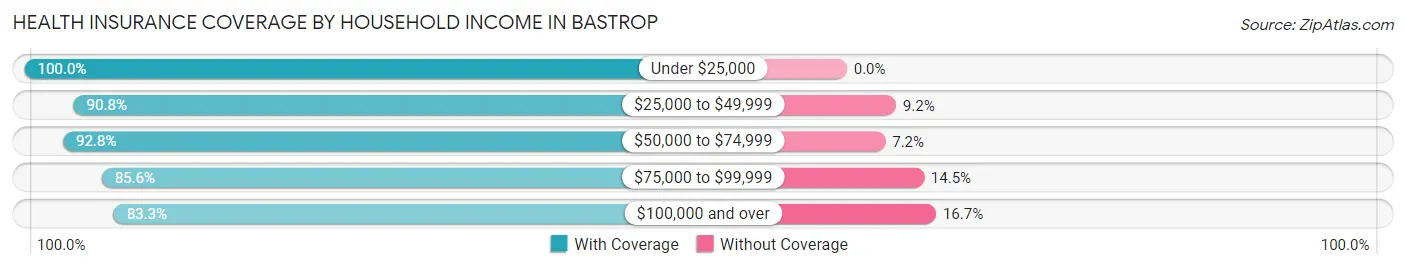
| Household Income | With Coverage | Without Coverage |
| Under $25,000 | 1,238 (100.0%) | 0 (0.0%) |
| $25,000 to $49,999 | 1,086 (90.8%) | 110 (9.2%) |
| $50,000 to $74,999 | 1,389 (92.8%) | 108 (7.2%) |
| $75,000 to $99,999 | 811 (85.6%) | 137 (14.4%) |
| $100,000 and over | 3,737 (83.3%) | 750 (16.7%) |
Public vs Private Health Insurance Coverage by Age in Bastrop
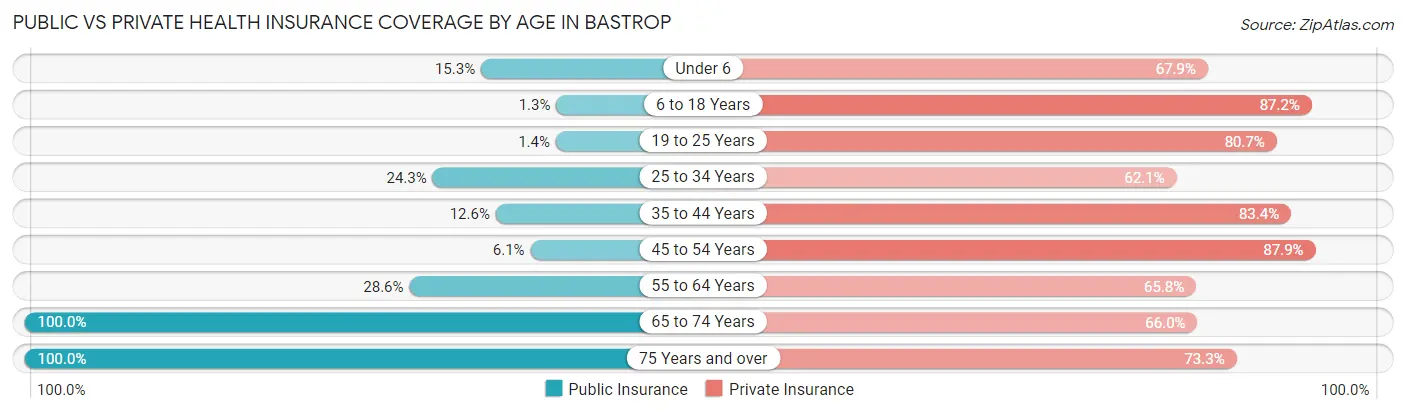
| Age Bracket | Public Insurance | Private Insurance |
| Under 6 | 133 (15.3%) | 591 (67.9%) |
| 6 to 18 Years | 14 (1.3%) | 934 (87.2%) |
| 19 to 25 Years | 13 (1.4%) | 745 (80.7%) |
| 25 to 34 Years | 345 (24.3%) | 883 (62.1%) |
| 35 to 44 Years | 126 (12.6%) | 837 (83.4%) |
| 45 to 54 Years | 103 (6.1%) | 1,483 (87.9%) |
| 55 to 64 Years | 313 (28.6%) | 720 (65.7%) |
| 65 to 74 Years | 697 (100.0%) | 460 (66.0%) |
| 75 Years and over | 613 (100.0%) | 449 (73.3%) |
| Total | 2,357 (25.1%) | 7,102 (75.7%) |
Disability Status by Sex by Age in Bastrop
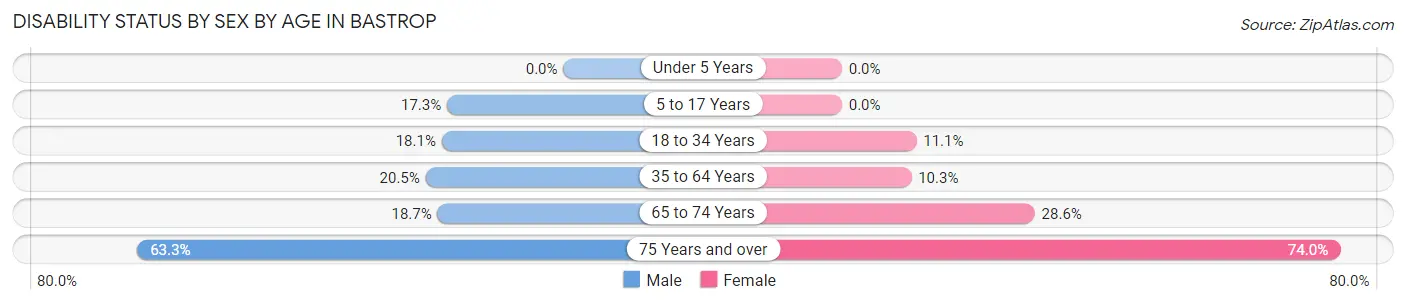
| Age Bracket | Male | Female |
| Under 5 Years | 0 (0.0%) | 0 (0.0%) |
| 5 to 17 Years | 76 (17.3%) | 0 (0.0%) |
| 18 to 34 Years | 229 (18.1%) | 140 (11.1%) |
| 35 to 64 Years | 338 (20.4%) | 220 (10.3%) |
| 65 to 74 Years | 48 (18.7%) | 126 (28.6%) |
| 75 Years and over | 62 (63.3%) | 381 (74.0%) |
Disability Class by Sex by Age in Bastrop
Disability Class: Hearing Difficulty
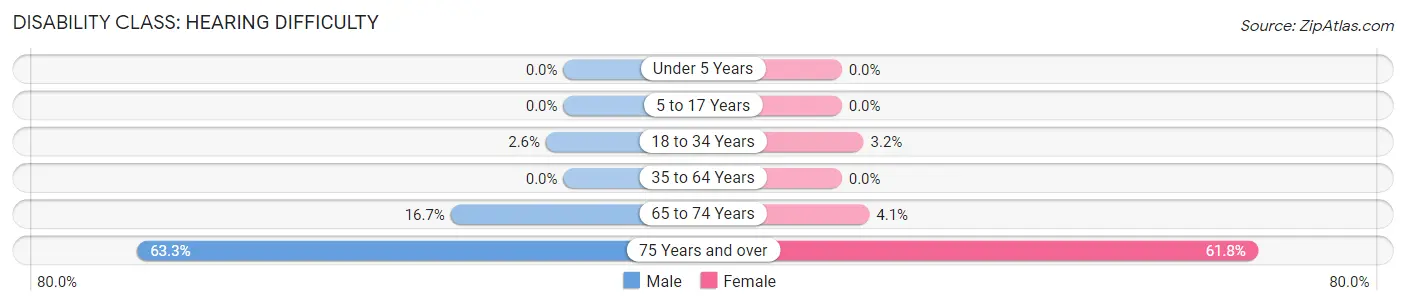
| Age Bracket | Male | Female |
| Under 5 Years | 0 (0.0%) | 0 (0.0%) |
| 5 to 17 Years | 0 (0.0%) | 0 (0.0%) |
| 18 to 34 Years | 33 (2.6%) | 41 (3.2%) |
| 35 to 64 Years | 0 (0.0%) | 0 (0.0%) |
| 65 to 74 Years | 43 (16.7%) | 18 (4.1%) |
| 75 Years and over | 62 (63.3%) | 318 (61.8%) |
Disability Class: Vision Difficulty
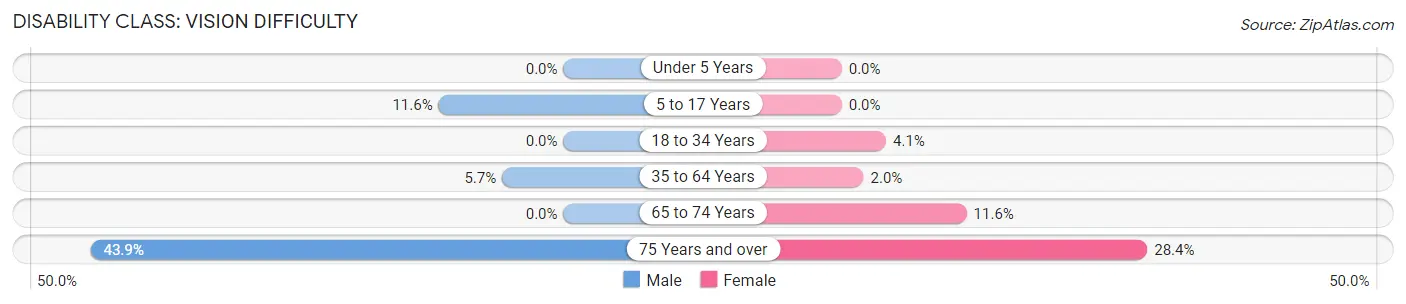
| Age Bracket | Male | Female |
| Under 5 Years | 0 (0.0%) | 0 (0.0%) |
| 5 to 17 Years | 51 (11.6%) | 0 (0.0%) |
| 18 to 34 Years | 0 (0.0%) | 52 (4.1%) |
| 35 to 64 Years | 94 (5.7%) | 43 (2.0%) |
| 65 to 74 Years | 0 (0.0%) | 51 (11.6%) |
| 75 Years and over | 43 (43.9%) | 146 (28.3%) |
Disability Class: Cognitive Difficulty
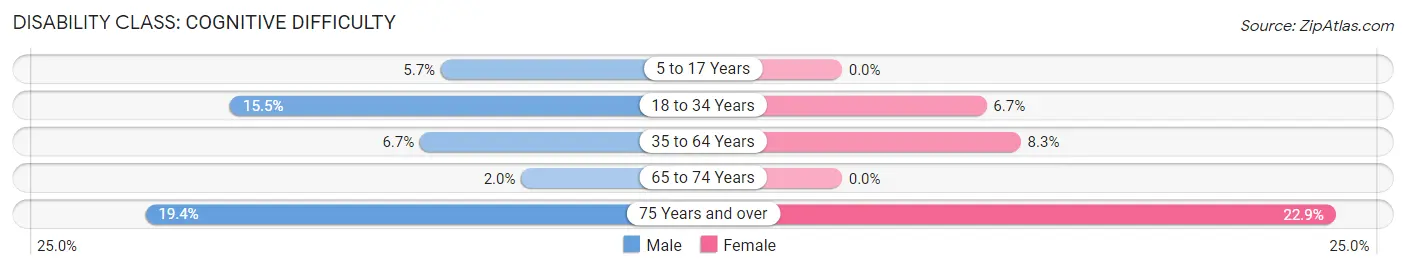
| Age Bracket | Male | Female |
| 5 to 17 Years | 25 (5.7%) | 0 (0.0%) |
| 18 to 34 Years | 196 (15.5%) | 85 (6.7%) |
| 35 to 64 Years | 110 (6.7%) | 177 (8.3%) |
| 65 to 74 Years | 5 (1.9%) | 0 (0.0%) |
| 75 Years and over | 19 (19.4%) | 118 (22.9%) |
Disability Class: Ambulatory Difficulty
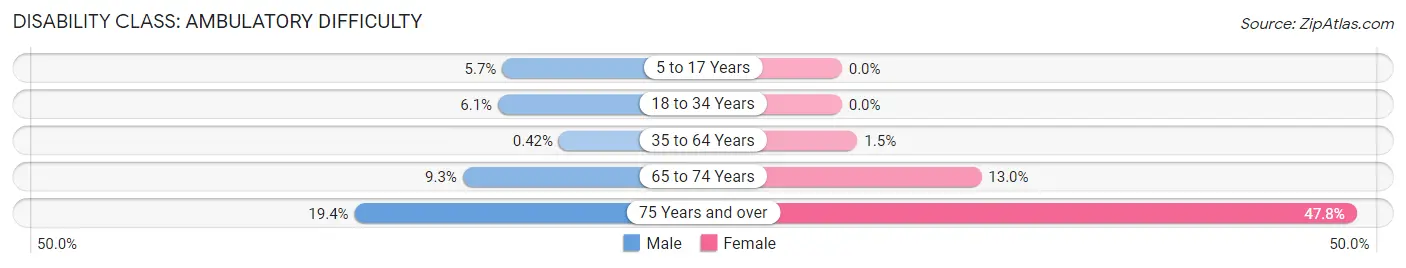
| Age Bracket | Male | Female |
| 5 to 17 Years | 25 (5.7%) | 0 (0.0%) |
| 18 to 34 Years | 77 (6.1%) | 0 (0.0%) |
| 35 to 64 Years | 7 (0.4%) | 31 (1.5%) |
| 65 to 74 Years | 24 (9.3%) | 57 (13.0%) |
| 75 Years and over | 19 (19.4%) | 246 (47.8%) |
Disability Class: Self-Care Difficulty
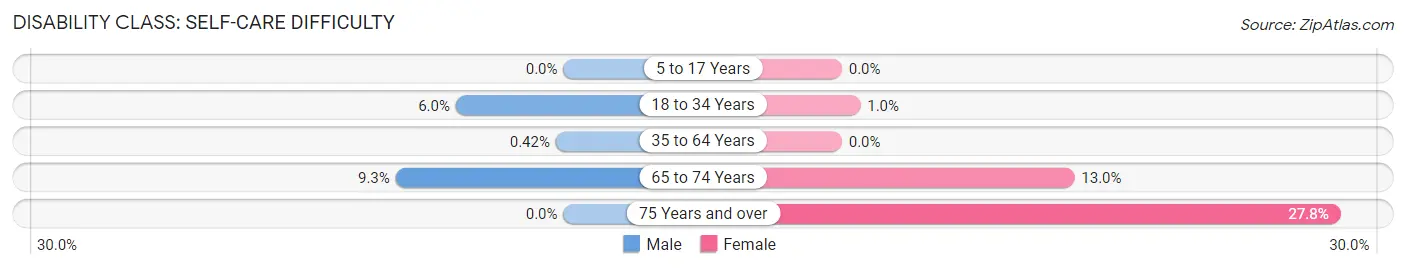
| Age Bracket | Male | Female |
| 5 to 17 Years | 0 (0.0%) | 0 (0.0%) |
| 18 to 34 Years | 76 (6.0%) | 13 (1.0%) |
| 35 to 64 Years | 7 (0.4%) | 0 (0.0%) |
| 65 to 74 Years | 24 (9.3%) | 57 (13.0%) |
| 75 Years and over | 0 (0.0%) | 143 (27.8%) |
Technology Access in Bastrop
Computing Device Access in Bastrop
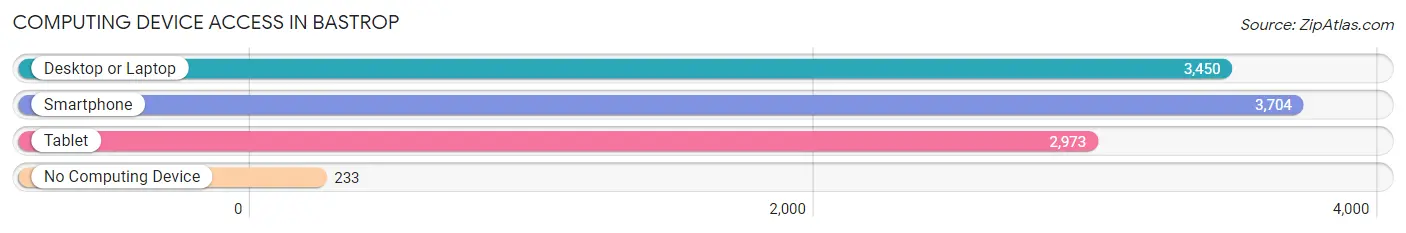
| Device Type | # Households | % Households |
| Desktop or Laptop | 3,450 | 83.0% |
| Smartphone | 3,704 | 89.1% |
| Tablet | 2,973 | 71.5% |
| No Computing Device | 233 | 5.6% |
| Total | 4,156 | 100.0% |
Internet Access in Bastrop
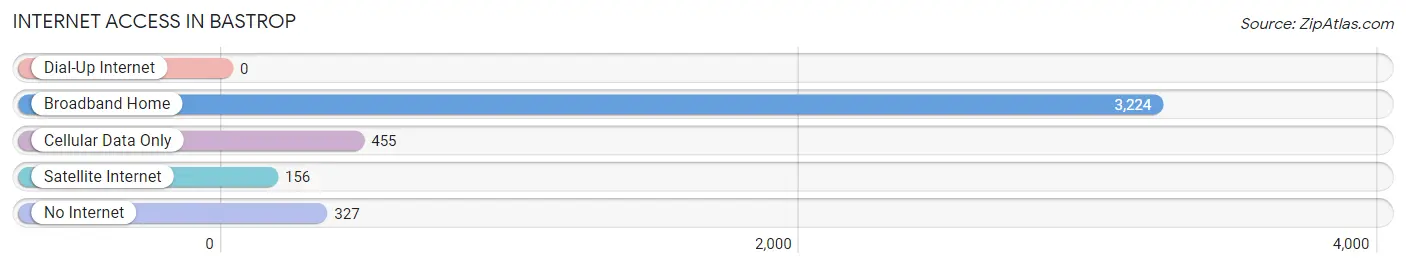
| Internet Type | # Households | % Households |
| Dial-Up Internet | 0 | 0.0% |
| Broadband Home | 3,224 | 77.6% |
| Cellular Data Only | 455 | 11.0% |
| Satellite Internet | 156 | 3.7% |
| No Internet | 327 | 7.9% |
| Total | 4,156 | 100.0% |
Bastrop Summary
Bastrop, Texas is a small city located in Bastrop County, Texas, about 30 miles southeast of Austin. The city is situated along the Colorado River and is home to a population of about 8,000 people. The city is known for its historic downtown area, which is home to a variety of shops, restaurants, and other businesses.
History
The area that is now Bastrop was first settled in the early 1800s by a group of settlers from the United States. The settlers were attracted to the area due to its fertile soil and abundant natural resources. The town was originally named Mina after a local Native American tribe, but was later changed to Bastrop in honor of Baron de Bastrop, a Dutch nobleman who had helped the settlers in their efforts to establish the town.
In 1839, the Texas Revolution began and Bastrop was one of the first towns to join the fight for independence from Mexico. During the war, the town was the site of several battles and skirmishes. After the war, Bastrop became an important trading center for the region and was home to several cotton plantations.
In the late 1800s, the town began to experience a period of growth and development. The railroad arrived in 1881, bringing with it new businesses and industries. The town was also home to several schools, churches, and other institutions.
Geography
Bastrop is located in the southeastern part of Texas, about 30 miles southeast of Austin. The city is situated along the Colorado River and is surrounded by rolling hills and wooded areas. The city has a total area of 8.3 square miles, with a population density of 945 people per square mile.
The climate in Bastrop is generally mild, with hot summers and mild winters. The average temperature in the summer is around 90 degrees Fahrenheit, while the average temperature in the winter is around 50 degrees Fahrenheit.
Economy
Bastrop’s economy is largely based on tourism, agriculture, and manufacturing. The city is home to several tourist attractions, including the Bastrop State Park, which is a popular destination for camping, hiking, and other outdoor activities. The city is also home to several wineries and vineyards, which attract visitors from all over the world.
Agriculture is also an important part of the local economy. The area is home to several farms and ranches, which produce a variety of crops, including cotton, corn, and hay. The city is also home to several manufacturing companies, which produce a variety of products, including furniture, clothing, and electronics.
Demographics
As of the 2010 census, the population of Bastrop was 8,239. The racial makeup of the city was 79.3% White, 11.2% African American, 0.7% Native American, 0.7% Asian, 0.1% Pacific Islander, 6.2% from other races, and 2.0% from two or more races. Hispanic or Latino of any race were 16.3% of the population.
The median income for a household in the city was $41,945, and the median income for a family was $50,945. The per capita income for the city was $21,945. About 15.3% of families and 19.2% of the population were below the poverty line, including 25.3% of those under age 18 and 11.2% of those age 65 or over.
Bastrop is a small city with a rich history and a vibrant economy. The city is home to a variety of businesses, attractions, and institutions, and is a popular destination for tourists and locals alike. The city is also home to a diverse population, with a variety of racial and ethnic backgrounds.
Common Questions
What is Per Capita Income in Bastrop?
Per Capita income in Bastrop is $38,541.
What is the Median Family Income in Bastrop?
Median Family Income in Bastrop is $104,286.
What is the Median Household income in Bastrop?
Median Household Income in Bastrop is $59,087.
What is Income or Wage Gap in Bastrop?
Income or Wage Gap in Bastrop is 21.5%.
Women in Bastrop earn 78.5 cents for every dollar earned by a man.
What is Inequality or Gini Index in Bastrop?
Inequality or Gini Index in Bastrop is 0.48.
What is the Total Population of Bastrop?
Total Population of Bastrop is 9,955.
What is the Total Male Population of Bastrop?
Total Male Population of Bastrop is 4,507.
What is the Total Female Population of Bastrop?
Total Female Population of Bastrop is 5,448.
What is the Ratio of Males per 100 Females in Bastrop?
There are 82.73 Males per 100 Females in Bastrop.
What is the Ratio of Females per 100 Males in Bastrop?
There are 120.88 Females per 100 Males in Bastrop.
What is the Median Population Age in Bastrop?
Median Population Age in Bastrop is 40.7 Years.
What is the Average Family Size in Bastrop
Average Family Size in Bastrop is 3.0 People.
What is the Average Household Size in Bastrop
Average Household Size in Bastrop is 2.2 People.
How Large is the Labor Force in Bastrop?
There are 5,506 People in the Labor Forcein in Bastrop.
What is the Percentage of People in the Labor Force in Bastrop?
66.3% of People are in the Labor Force in Bastrop.
What is the Unemployment Rate in Bastrop?
Unemployment Rate in Bastrop is 4.6%.