Atlanta, TX Map & Demographics
Atlanta Map
Atlanta Overview
$32,155
PER CAPITA INCOME
$70,417
AVG FAMILY INCOME
$62,215
AVG HOUSEHOLD INCOME
0.7%
WAGE / INCOME GAP [ % ]
99.3¢/ $1
WAGE / INCOME GAP [ $ ]
0.50
INEQUALITY / GINI INDEX
5,453
TOTAL POPULATION
2,703
MALE POPULATION
2,750
FEMALE POPULATION
98.29
MALES / 100 FEMALES
101.74
FEMALES / 100 MALES
40.1
MEDIAN AGE
3.3
AVG FAMILY SIZE
2.6
AVG HOUSEHOLD SIZE
2,550
LABOR FORCE [ PEOPLE ]
58.6%
PERCENT IN LABOR FORCE
7.6%
UNEMPLOYMENT RATE
Atlanta Zip Codes
Income in Atlanta
Income Overview in Atlanta
Per Capita Income in Atlanta is $32,155, while median incomes of families and households are $70,417 and $62,215 respectively.
| Characteristic | Number | Measure |
| Per Capita Income | 5,453 | $32,155 |
| Median Family Income | 1,306 | $70,417 |
| Mean Family Income | 1,306 | $104,477 |
| Median Household Income | 2,033 | $62,215 |
| Mean Household Income | 2,033 | $88,758 |
| Income Deficit | 1,306 | $0 |
| Wage / Income Gap (%) | 5,453 | 0.72% |
| Wage / Income Gap ($) | 5,453 | 99.28¢ per $1 |
| Gini / Inequality Index | 5,453 | 0.50 |
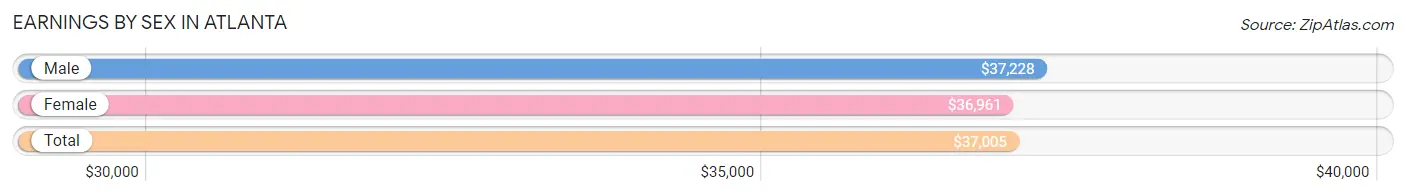
Earnings by Sex in Atlanta
Average Earnings in Atlanta are $37,005, $37,228 for men and $36,961 for women, a difference of 0.7%.
| Sex | Number | Average Earnings |
| Male | 1,367 (53.5%) | $37,228 |
| Female | 1,190 (46.5%) | $36,961 |
| Total | 2,557 (100.0%) | $37,005 |
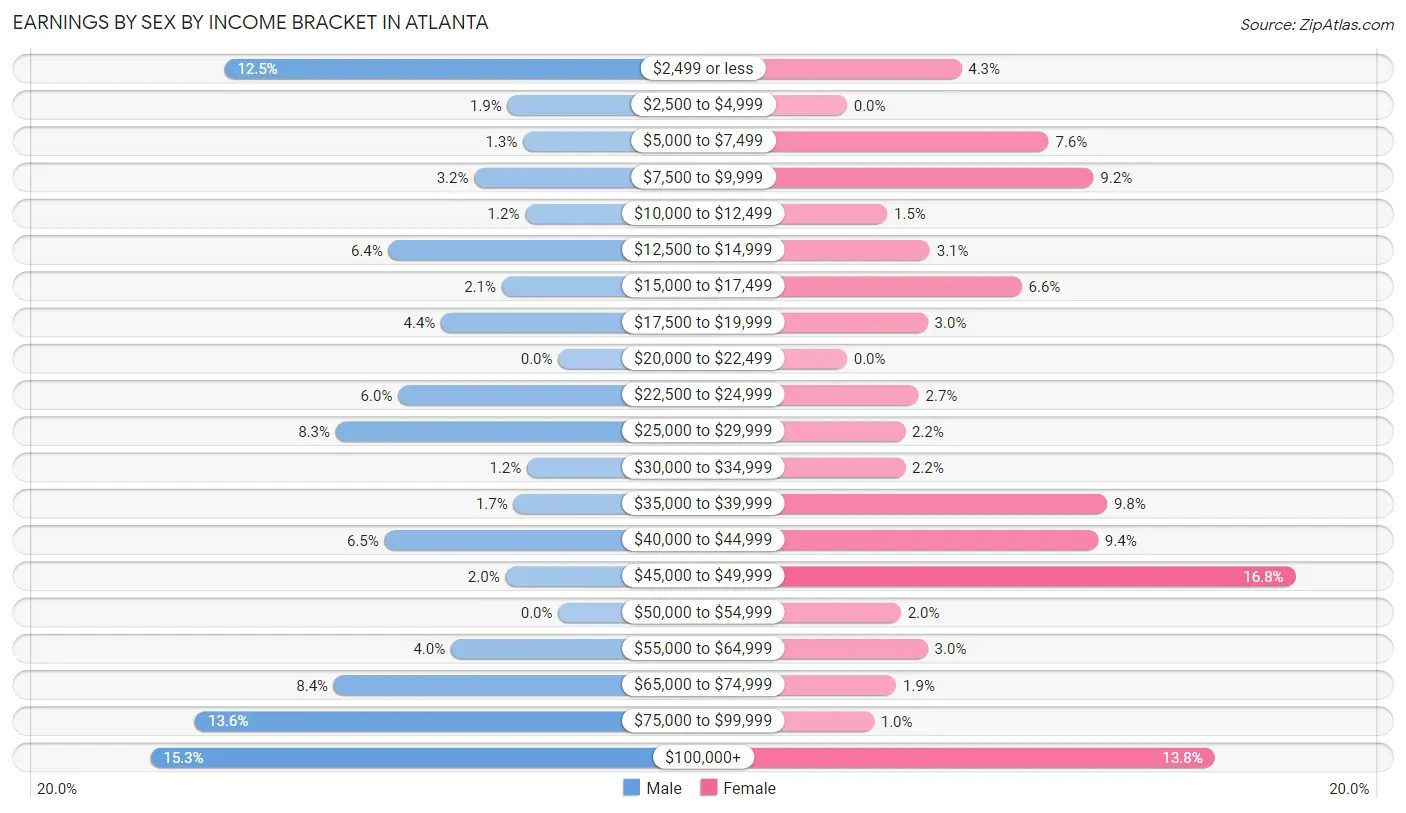
Earnings by Sex by Income Bracket in Atlanta
The most common earnings brackets in Atlanta are $100,000+ for men (209 | 15.3%) and $45,000 to $49,999 for women (200 | 16.8%).
| Income | Male | Female |
| $2,499 or less | 171 (12.5%) | 51 (4.3%) |
| $2,500 to $4,999 | 26 (1.9%) | 0 (0.0%) |
| $5,000 to $7,499 | 18 (1.3%) | 90 (7.6%) |
| $7,500 to $9,999 | 43 (3.2%) | 110 (9.2%) |
| $10,000 to $12,499 | 17 (1.2%) | 18 (1.5%) |
| $12,500 to $14,999 | 87 (6.4%) | 37 (3.1%) |
| $15,000 to $17,499 | 29 (2.1%) | 78 (6.6%) |
| $17,500 to $19,999 | 60 (4.4%) | 36 (3.0%) |
| $20,000 to $22,499 | 0 (0.0%) | 0 (0.0%) |
| $22,500 to $24,999 | 82 (6.0%) | 32 (2.7%) |
| $25,000 to $29,999 | 114 (8.3%) | 26 (2.2%) |
| $30,000 to $34,999 | 16 (1.2%) | 26 (2.2%) |
| $35,000 to $39,999 | 23 (1.7%) | 116 (9.8%) |
| $40,000 to $44,999 | 89 (6.5%) | 112 (9.4%) |
| $45,000 to $49,999 | 27 (2.0%) | 200 (16.8%) |
| $50,000 to $54,999 | 0 (0.0%) | 24 (2.0%) |
| $55,000 to $64,999 | 55 (4.0%) | 36 (3.0%) |
| $65,000 to $74,999 | 115 (8.4%) | 22 (1.8%) |
| $75,000 to $99,999 | 186 (13.6%) | 12 (1.0%) |
| $100,000+ | 209 (15.3%) | 164 (13.8%) |
| Total | 1,367 (100.0%) | 1,190 (100.0%) |
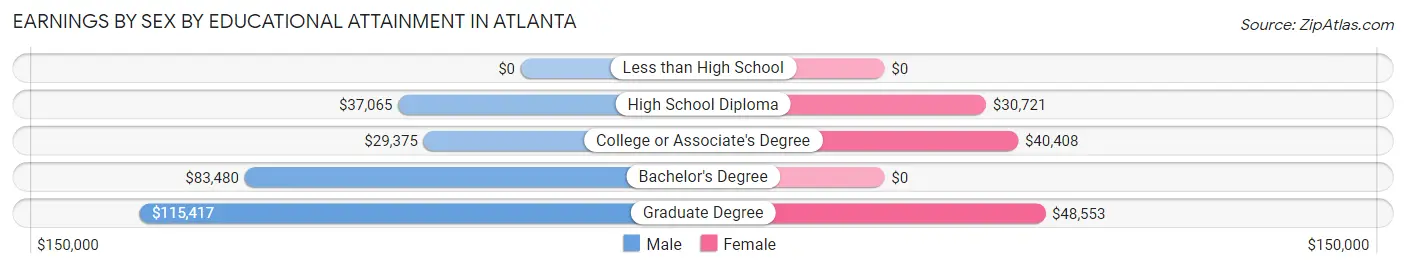
Earnings by Sex by Educational Attainment in Atlanta
Average earnings in Atlanta are $44,075 for men and $37,435 for women, a difference of 15.1%. Men with an educational attainment of graduate degree enjoy the highest average annual earnings of $115,417, while those with college or associate's degree education earn the least with $29,375. Women with an educational attainment of graduate degree earn the most with the average annual earnings of $48,553, while those with high school diploma education have the smallest earnings of $30,721.
| Educational Attainment | Male Income | Female Income |
| Less than High School | - | - |
| High School Diploma | $37,065 | $30,721 |
| College or Associate's Degree | $29,375 | $40,408 |
| Bachelor's Degree | $83,480 | $0 |
| Graduate Degree | $115,417 | $48,553 |
| Total | $44,075 | $37,435 |
Family Income in Atlanta
Family Income Brackets in Atlanta
According to the Atlanta family income data, there are 226 families falling into the $50,000 to $74,999 income range, which is the most common income bracket and makes up 17.3% of all families. Conversely, the less than $10,000 income bracket is the least frequent group with only 54 families (4.1%) belonging to this category.
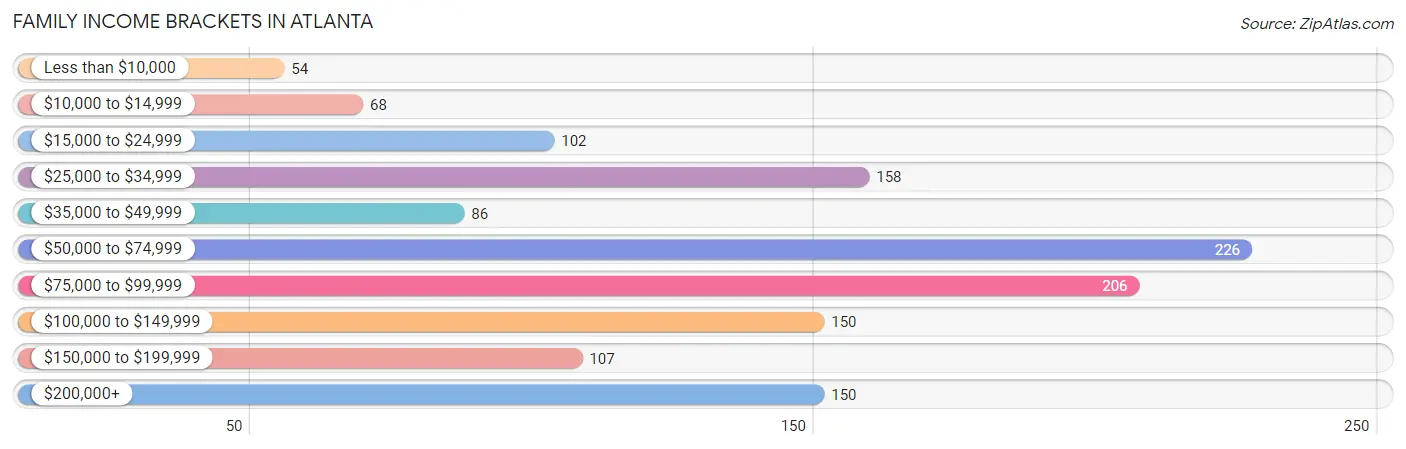
| Income Bracket | # Families | % Families |
| Less than $10,000 | 54 | 4.1% |
| $10,000 to $14,999 | 68 | 5.2% |
| $15,000 to $24,999 | 102 | 7.8% |
| $25,000 to $34,999 | 158 | 12.1% |
| $35,000 to $49,999 | 86 | 6.6% |
| $50,000 to $74,999 | 226 | 17.3% |
| $75,000 to $99,999 | 206 | 15.8% |
| $100,000 to $149,999 | 150 | 11.5% |
| $150,000 to $199,999 | 107 | 8.2% |
| $200,000+ | 150 | 11.5% |
Family Income by Famaliy Size in Atlanta
5-person families (141 | 10.8%) account for the highest median family income in Atlanta with $250,001 per family, while 5-person families (141 | 10.8%) have the highest median income of $50,000 per family member.
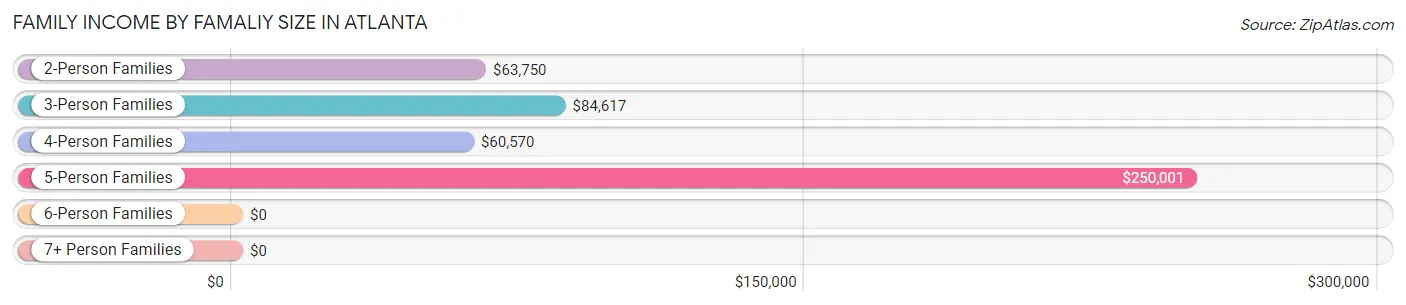
| Income Bracket | # Families | Median Income |
| 2-Person Families | 460 (35.2%) | $63,750 |
| 3-Person Families | 335 (25.7%) | $84,617 |
| 4-Person Families | 264 (20.2%) | $60,570 |
| 5-Person Families | 141 (10.8%) | $250,001 |
| 6-Person Families | 106 (8.1%) | $0 |
| 7+ Person Families | 0 (0.0%) | $0 |
| Total | 1,306 (100.0%) | $70,417 |
Family Income by Number of Earners in Atlanta
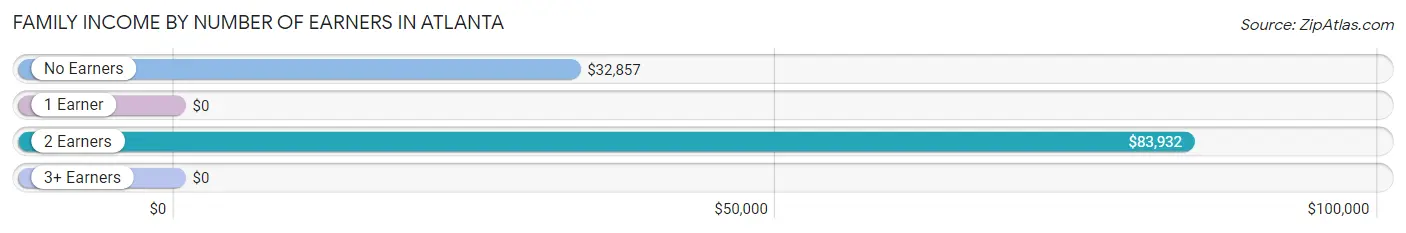
| Number of Earners | # Families | Median Income |
| No Earners | 192 (14.7%) | $32,857 |
| 1 Earner | 395 (30.2%) | $0 |
| 2 Earners | 486 (37.2%) | $83,932 |
| 3+ Earners | 233 (17.8%) | $0 |
| Total | 1,306 (100.0%) | $70,417 |
Household Income in Atlanta
Household Income Brackets in Atlanta
With 374 households falling in the category, the $75,000 to $99,999 income range is the most frequent in Atlanta, accounting for 18.4% of all households. In contrast, only 96 households (4.7%) fall into the $10,000 to $14,999 income bracket, making it the least populous group.
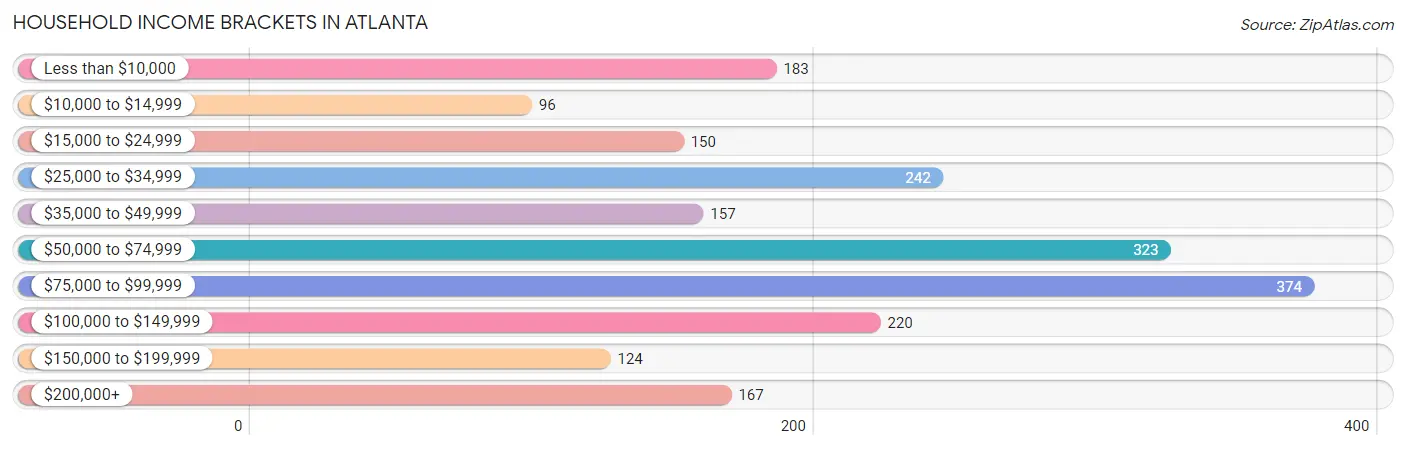
| Income Bracket | # Households | % Households |
| Less than $10,000 | 183 | 9.0% |
| $10,000 to $14,999 | 96 | 4.7% |
| $15,000 to $24,999 | 150 | 7.4% |
| $25,000 to $34,999 | 242 | 11.9% |
| $35,000 to $49,999 | 157 | 7.7% |
| $50,000 to $74,999 | 323 | 15.9% |
| $75,000 to $99,999 | 374 | 18.4% |
| $100,000 to $149,999 | 220 | 10.8% |
| $150,000 to $199,999 | 124 | 6.1% |
| $200,000+ | 167 | 8.2% |
Household Income by Householder Age in Atlanta
The median household income in Atlanta is $62,215, with the highest median household income of $75,426 found in the 45 to 64 years age bracket for the primary householder. A total of 952 households (46.8%) fall into this category. Meanwhile, the 15 to 24 years age bracket for the primary householder has the lowest median household income of $0, with 54 households (2.7%) in this group.
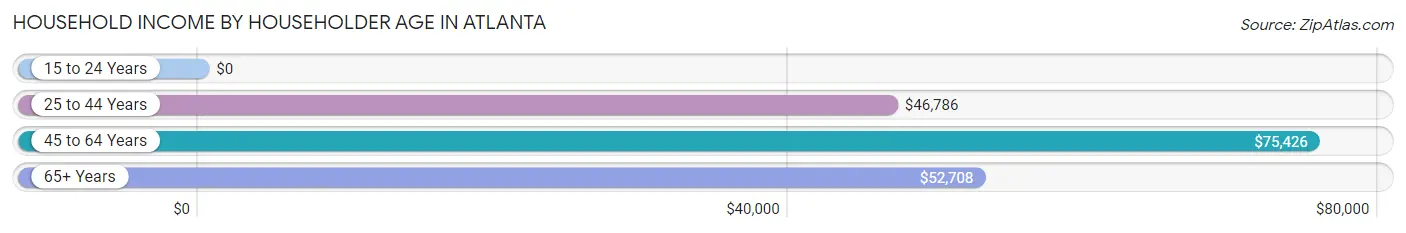
| Income Bracket | # Households | Median Income |
| 15 to 24 Years | 54 (2.7%) | $0 |
| 25 to 44 Years | 444 (21.8%) | $46,786 |
| 45 to 64 Years | 952 (46.8%) | $75,426 |
| 65+ Years | 583 (28.7%) | $52,708 |
| Total | 2,033 (100.0%) | $62,215 |
Poverty in Atlanta
Income Below Poverty by Sex and Age in Atlanta
With 25.0% poverty level for males and 25.9% for females among the residents of Atlanta, 12 to 14 year old males and 15 year old females are the most vulnerable to poverty, with 76 males (80.8%) and 31 females (100.0%) in their respective age groups living below the poverty level.
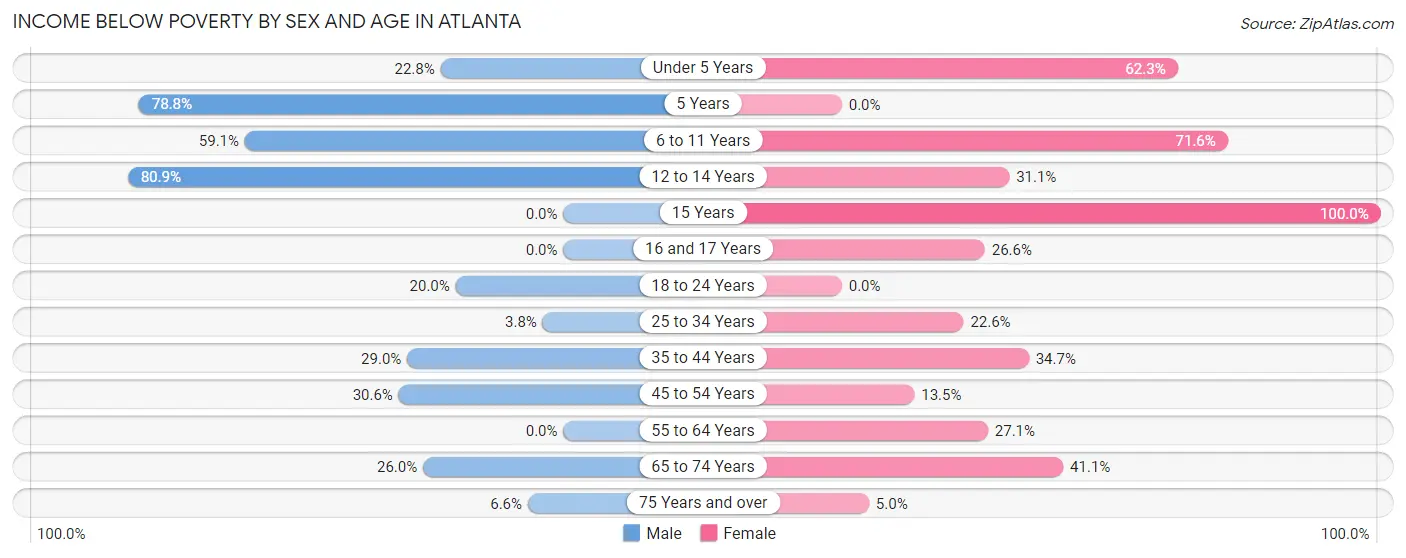
| Age Bracket | Male | Female |
| Under 5 Years | 44 (22.8%) | 38 (62.3%) |
| 5 Years | 26 (78.8%) | 0 (0.0%) |
| 6 to 11 Years | 188 (59.1%) | 111 (71.6%) |
| 12 to 14 Years | 76 (80.8%) | 55 (31.1%) |
| 15 Years | 0 (0.0%) | 31 (100.0%) |
| 16 and 17 Years | 0 (0.0%) | 30 (26.6%) |
| 18 to 24 Years | 56 (20.0%) | 0 (0.0%) |
| 25 to 34 Years | 17 (3.8%) | 70 (22.6%) |
| 35 to 44 Years | 60 (29.0%) | 93 (34.7%) |
| 45 to 54 Years | 125 (30.6%) | 79 (13.5%) |
| 55 to 64 Years | 0 (0.0%) | 90 (27.1%) |
| 65 to 74 Years | 44 (26.0%) | 83 (41.1%) |
| 75 Years and over | 11 (6.6%) | 18 (5.0%) |
| Total | 647 (25.0%) | 698 (25.9%) |
Income Above Poverty by Sex and Age in Atlanta
According to the poverty statistics in Atlanta, males aged 55 to 64 years and females aged 5 years are the age groups that are most secure financially, with 100.0% of males and 100.0% of females in these age groups living above the poverty line.
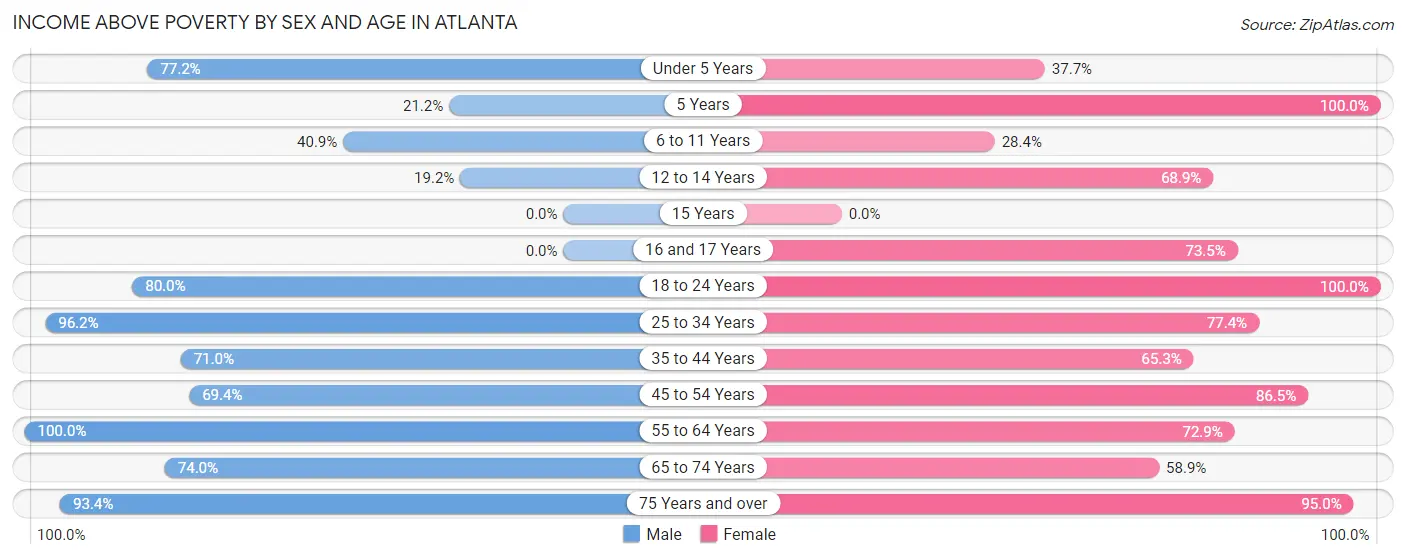
| Age Bracket | Male | Female |
| Under 5 Years | 149 (77.2%) | 23 (37.7%) |
| 5 Years | 7 (21.2%) | 18 (100.0%) |
| 6 to 11 Years | 130 (40.9%) | 44 (28.4%) |
| 12 to 14 Years | 18 (19.2%) | 122 (68.9%) |
| 15 Years | 0 (0.0%) | 0 (0.0%) |
| 16 and 17 Years | 0 (0.0%) | 83 (73.5%) |
| 18 to 24 Years | 224 (80.0%) | 79 (100.0%) |
| 25 to 34 Years | 426 (96.2%) | 240 (77.4%) |
| 35 to 44 Years | 147 (71.0%) | 175 (65.3%) |
| 45 to 54 Years | 284 (69.4%) | 508 (86.5%) |
| 55 to 64 Years | 275 (100.0%) | 242 (72.9%) |
| 65 to 74 Years | 125 (74.0%) | 119 (58.9%) |
| 75 Years and over | 156 (93.4%) | 340 (95.0%) |
| Total | 1,941 (75.0%) | 1,993 (74.1%) |
Income Below Poverty Among Married-Couple Families in Atlanta
The poverty statistics for married-couple families in Atlanta show that 11.8% or 107 of the total 908 families live below the poverty line. Families with 3 or 4 children have the highest poverty rate of 59.2%, comprising of 42 families. On the other hand, families with 1 or 2 children have the lowest poverty rate of 6.9%, which includes 19 families.
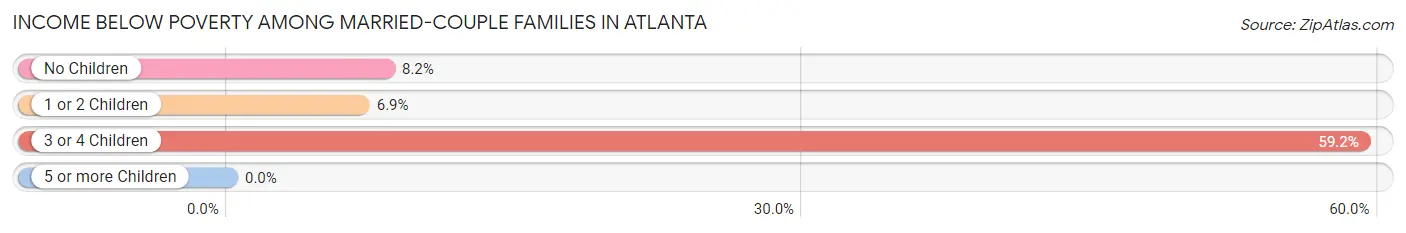
| Children | Above Poverty | Below Poverty |
| No Children | 515 (91.8%) | 46 (8.2%) |
| 1 or 2 Children | 257 (93.1%) | 19 (6.9%) |
| 3 or 4 Children | 29 (40.8%) | 42 (59.2%) |
| 5 or more Children | 0 (0.0%) | 0 (0.0%) |
| Total | 801 (88.2%) | 107 (11.8%) |
Income Below Poverty Among Single-Parent Households in Atlanta
According to the poverty data in Atlanta, 63.2% or 43 single-father households and 24.2% or 80 single-mother households are living below the poverty line. Among single-father households, those with 1 or 2 children have the highest poverty rate, with 43 households (100.0%) experiencing poverty. Likewise, among single-mother households, those with 3 or 4 children have the highest poverty rate, with 68 households (100.0%) falling below the poverty line.
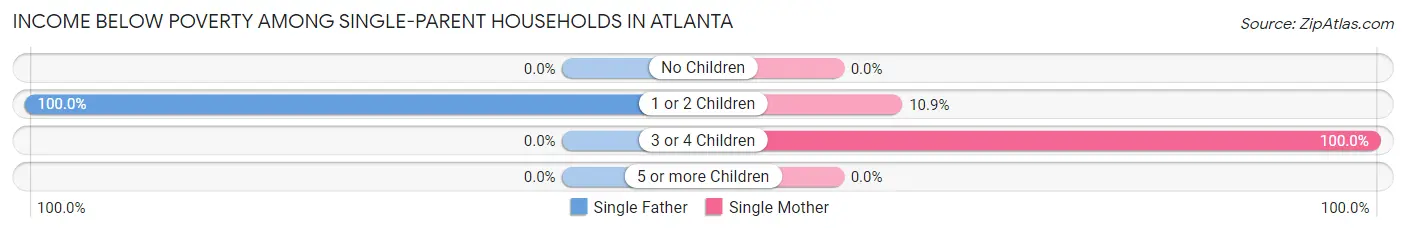
| Children | Single Father | Single Mother |
| No Children | 0 (0.0%) | 0 (0.0%) |
| 1 or 2 Children | 43 (100.0%) | 12 (10.9%) |
| 3 or 4 Children | 0 (0.0%) | 68 (100.0%) |
| 5 or more Children | 0 (0.0%) | 0 (0.0%) |
| Total | 43 (63.2%) | 80 (24.2%) |
Income Below Poverty Among Married-Couple vs Single-Parent Households in Atlanta
The poverty data for Atlanta shows that 107 of the married-couple family households (11.8%) and 123 of the single-parent households (30.9%) are living below the poverty level. Within the married-couple family households, those with 3 or 4 children have the highest poverty rate, with 42 households (59.2%) falling below the poverty line. Among the single-parent households, those with 3 or 4 children have the highest poverty rate, with 68 household (100.0%) living below poverty.
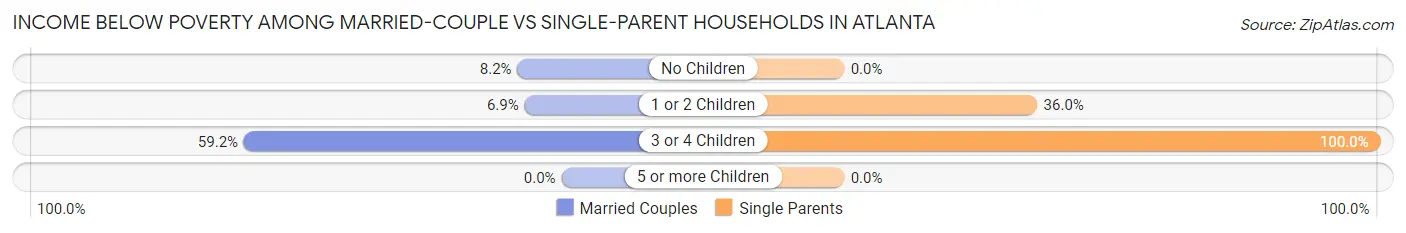
| Children | Married-Couple Families | Single-Parent Households |
| No Children | 46 (8.2%) | 0 (0.0%) |
| 1 or 2 Children | 19 (6.9%) | 55 (35.9%) |
| 3 or 4 Children | 42 (59.2%) | 68 (100.0%) |
| 5 or more Children | 0 (0.0%) | 0 (0.0%) |
| Total | 107 (11.8%) | 123 (30.9%) |
Race in Atlanta
The most populous races in Atlanta are White / Caucasian (2,970 | 54.5%), Black / African American (1,537 | 28.2%), and Asian (570 | 10.4%).
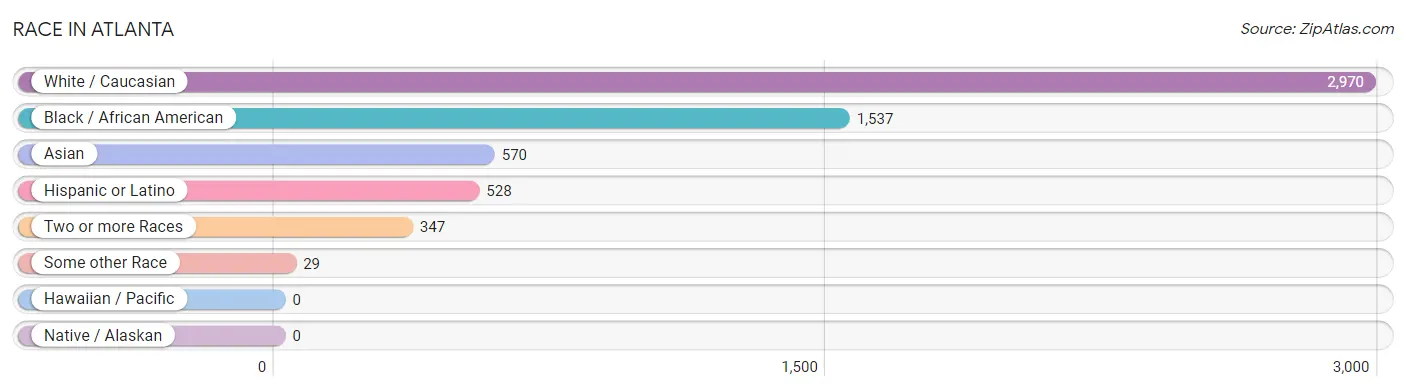
| Race | # Population | % Population |
| Asian | 570 | 10.4% |
| Black / African American | 1,537 | 28.2% |
| Hawaiian / Pacific | 0 | 0.0% |
| Hispanic or Latino | 528 | 9.7% |
| Native / Alaskan | 0 | 0.0% |
| White / Caucasian | 2,970 | 54.5% |
| Two or more Races | 347 | 6.4% |
| Some other Race | 29 | 0.5% |
| Total | 5,453 | 100.0% |
Ancestry in Atlanta
The most populous ancestries reported in Atlanta are American (1,061 | 19.5%), German (712 | 13.1%), Irish (439 | 8.1%), Mexican (437 | 8.0%), and Indian (Asian) (374 | 6.9%), together accounting for 55.4% of all Atlanta residents.
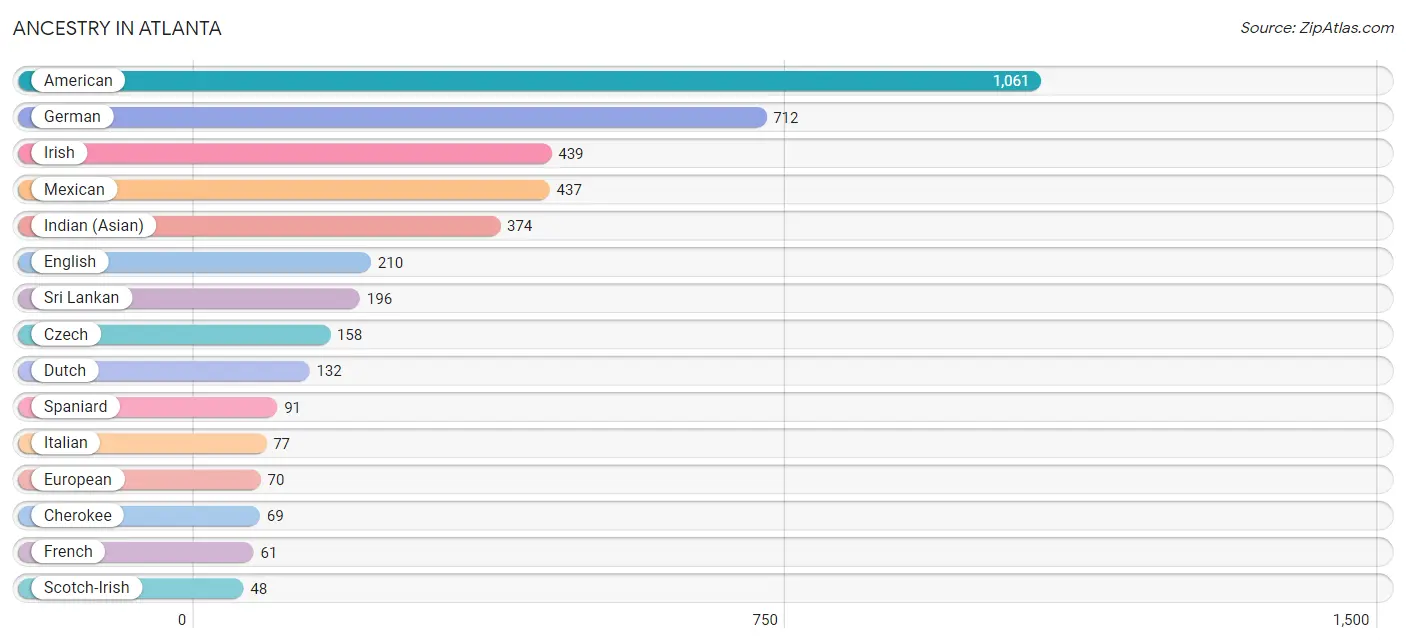
| Ancestry | # Population | % Population |
| American | 1,061 | 19.5% |
| British | 17 | 0.3% |
| Cherokee | 69 | 1.3% |
| Czech | 158 | 2.9% |
| Dutch | 132 | 2.4% |
| English | 210 | 3.8% |
| European | 70 | 1.3% |
| French | 61 | 1.1% |
| German | 712 | 13.1% |
| Indian (Asian) | 374 | 6.9% |
| Iranian | 15 | 0.3% |
| Irish | 439 | 8.1% |
| Iroquois | 5 | 0.1% |
| Italian | 77 | 1.4% |
| Mexican | 437 | 8.0% |
| Portuguese | 30 | 0.5% |
| Scotch-Irish | 48 | 0.9% |
| Scottish | 27 | 0.5% |
| Spaniard | 91 | 1.7% |
| Sri Lankan | 196 | 3.6% |
| Swedish | 37 | 0.7% |
| Welsh | 14 | 0.3% | View All 22 Rows |
Immigrants in Atlanta
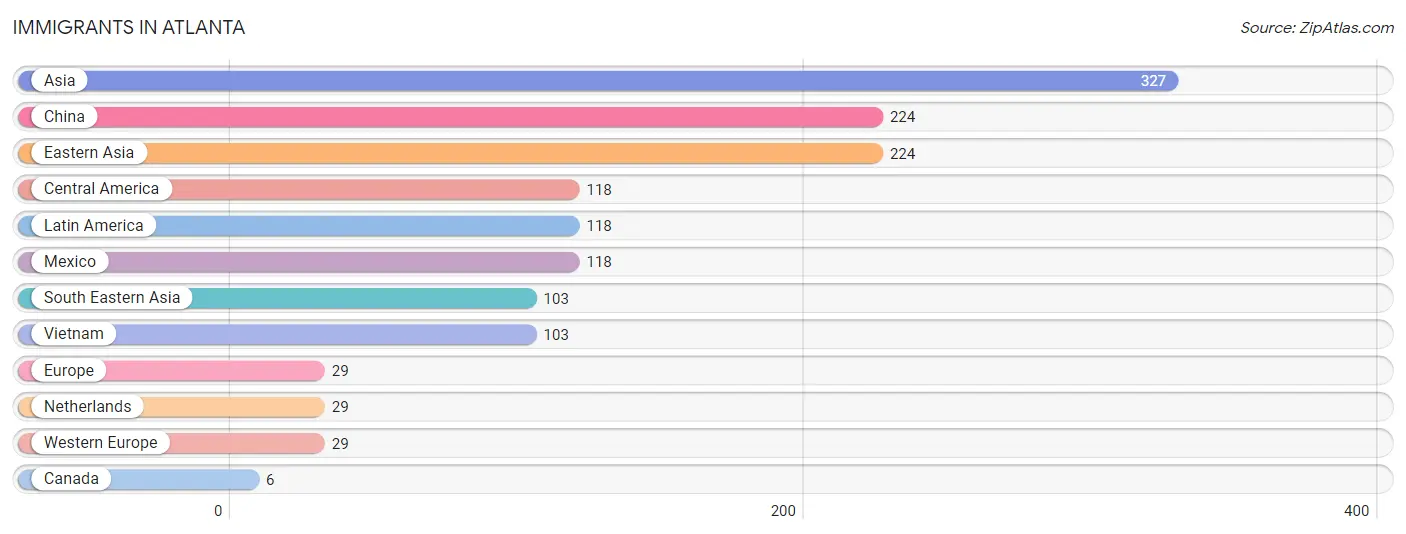
The most numerous immigrant groups reported in Atlanta came from Asia (327 | 6.0%), China (224 | 4.1%), Eastern Asia (224 | 4.1%), Central America (118 | 2.2%), and Latin America (118 | 2.2%), together accounting for 18.5% of all Atlanta residents.
| Immigration Origin | # Population | % Population |
| Asia | 327 | 6.0% |
| Canada | 6 | 0.1% |
| Central America | 118 | 2.2% |
| China | 224 | 4.1% |
| Eastern Asia | 224 | 4.1% |
| Europe | 29 | 0.5% |
| Latin America | 118 | 2.2% |
| Mexico | 118 | 2.2% |
| Netherlands | 29 | 0.5% |
| South Eastern Asia | 103 | 1.9% |
| Vietnam | 103 | 1.9% |
| Western Europe | 29 | 0.5% | View All 12 Rows |
Sex and Age in Atlanta
Sex and Age in Atlanta
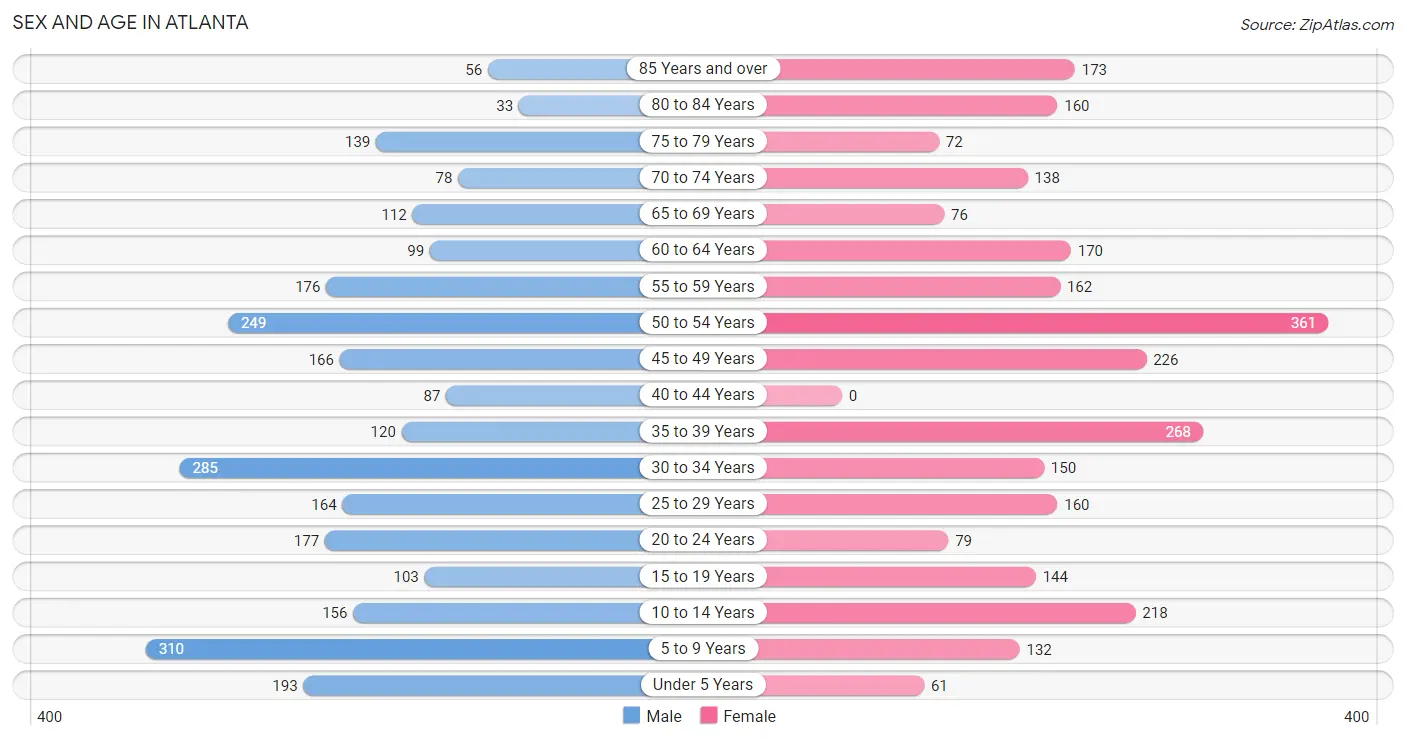
The most populous age groups in Atlanta are 5 to 9 Years (310 | 11.5%) for men and 50 to 54 Years (361 | 13.1%) for women.
| Age Bracket | Male | Female |
| Under 5 Years | 193 (7.1%) | 61 (2.2%) |
| 5 to 9 Years | 310 (11.5%) | 132 (4.8%) |
| 10 to 14 Years | 156 (5.8%) | 218 (7.9%) |
| 15 to 19 Years | 103 (3.8%) | 144 (5.2%) |
| 20 to 24 Years | 177 (6.6%) | 79 (2.9%) |
| 25 to 29 Years | 164 (6.1%) | 160 (5.8%) |
| 30 to 34 Years | 285 (10.5%) | 150 (5.4%) |
| 35 to 39 Years | 120 (4.4%) | 268 (9.8%) |
| 40 to 44 Years | 87 (3.2%) | 0 (0.0%) |
| 45 to 49 Years | 166 (6.1%) | 226 (8.2%) |
| 50 to 54 Years | 249 (9.2%) | 361 (13.1%) |
| 55 to 59 Years | 176 (6.5%) | 162 (5.9%) |
| 60 to 64 Years | 99 (3.7%) | 170 (6.2%) |
| 65 to 69 Years | 112 (4.1%) | 76 (2.8%) |
| 70 to 74 Years | 78 (2.9%) | 138 (5.0%) |
| 75 to 79 Years | 139 (5.1%) | 72 (2.6%) |
| 80 to 84 Years | 33 (1.2%) | 160 (5.8%) |
| 85 Years and over | 56 (2.1%) | 173 (6.3%) |
| Total | 2,703 (100.0%) | 2,750 (100.0%) |
Families and Households in Atlanta
Median Family Size in Atlanta
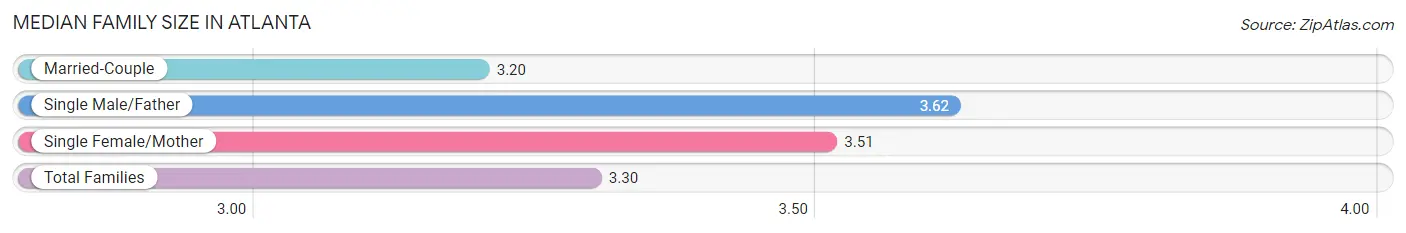
The median family size in Atlanta is 3.30 persons per family, with single male/father families (68 | 5.2%) accounting for the largest median family size of 3.62 persons per family. On the other hand, married-couple families (908 | 69.5%) represent the smallest median family size with 3.20 persons per family.
| Family Type | # Families | Family Size |
| Married-Couple | 908 (69.5%) | 3.20 |
| Single Male/Father | 68 (5.2%) | 3.62 |
| Single Female/Mother | 330 (25.3%) | 3.51 |
| Total Families | 1,306 (100.0%) | 3.30 |
Median Household Size in Atlanta
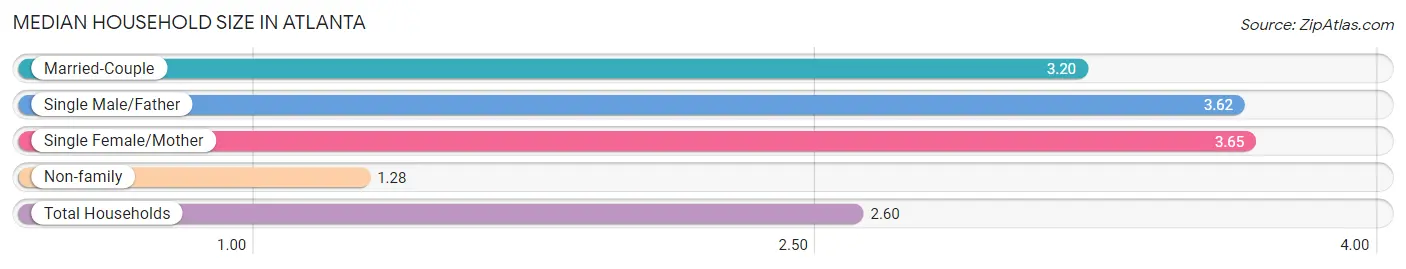
The median household size in Atlanta is 2.60 persons per household, with single female/mother households (330 | 16.2%) accounting for the largest median household size of 3.65 persons per household. non-family households (727 | 35.8%) represent the smallest median household size with 1.28 persons per household.
| Household Type | # Households | Household Size |
| Married-Couple | 908 (44.7%) | 3.20 |
| Single Male/Father | 68 (3.3%) | 3.62 |
| Single Female/Mother | 330 (16.2%) | 3.65 |
| Non-family | 727 (35.8%) | 1.28 |
| Total Households | 2,033 (100.0%) | 2.60 |
Household Size by Marriage Status in Atlanta
Out of a total of 2,033 households in Atlanta, 1,306 (64.2%) are family households, while 727 (35.8%) are nonfamily households. The most numerous type of family households are 2-person households, comprising 432, and the most common type of nonfamily households are 1-person households, comprising 593.
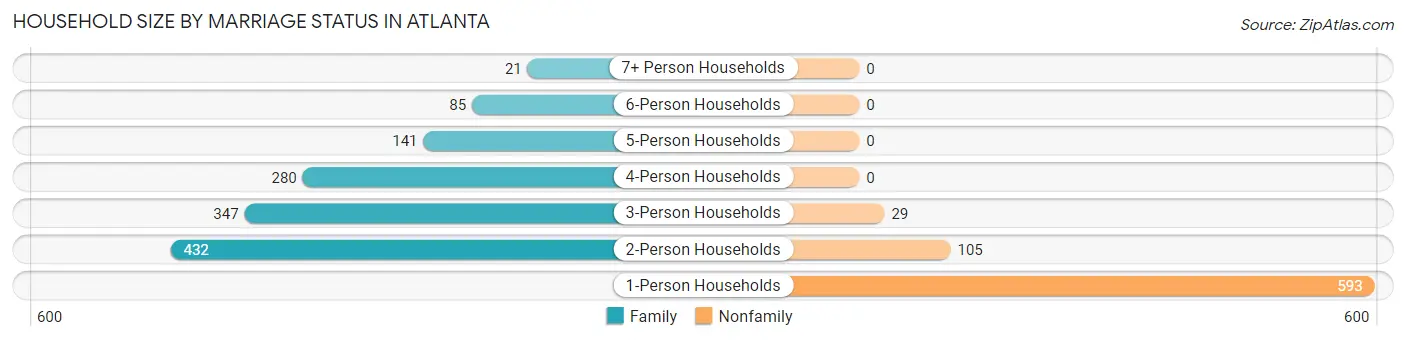
| Household Size | Family Households | Nonfamily Households |
| 1-Person Households | - | 593 (29.2%) |
| 2-Person Households | 432 (21.2%) | 105 (5.2%) |
| 3-Person Households | 347 (17.1%) | 29 (1.4%) |
| 4-Person Households | 280 (13.8%) | 0 (0.0%) |
| 5-Person Households | 141 (6.9%) | 0 (0.0%) |
| 6-Person Households | 85 (4.2%) | 0 (0.0%) |
| 7+ Person Households | 21 (1.0%) | 0 (0.0%) |
| Total | 1,306 (64.2%) | 727 (35.8%) |
Female Fertility in Atlanta
Fertility by Age in Atlanta
Average fertility rate in Atlanta is 98.0 births per 1,000 women. Women in the age bracket of 35 to 50 years have the highest fertility rate with 178.0 births per 1,000 women. Women in the age bracket of 35 to 50 years acount for 89.3% of all women with births.
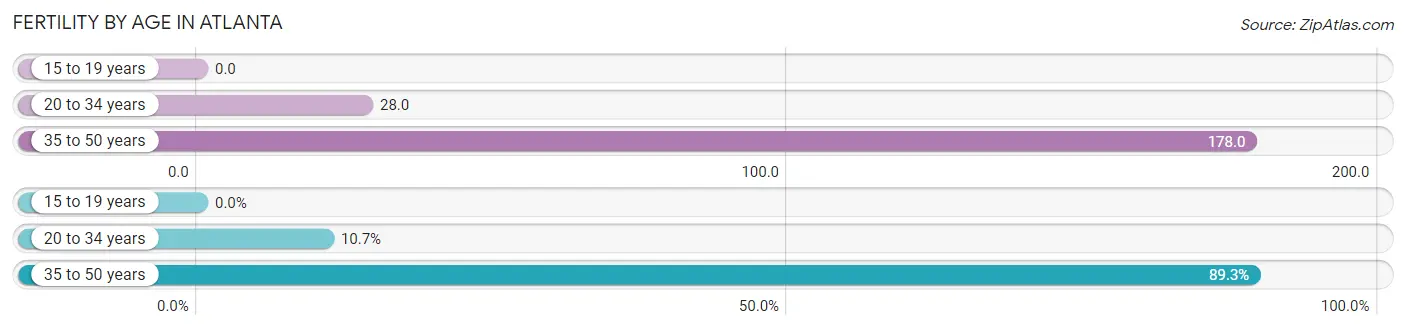
| Age Bracket | Women with Births | Births / 1,000 Women |
| 15 to 19 years | 0 (0.0%) | 0.0 |
| 20 to 34 years | 11 (10.7%) | 28.0 |
| 35 to 50 years | 92 (89.3%) | 178.0 |
| Total | 103 (100.0%) | 98.0 |
Fertility by Age by Marriage Status in Atlanta
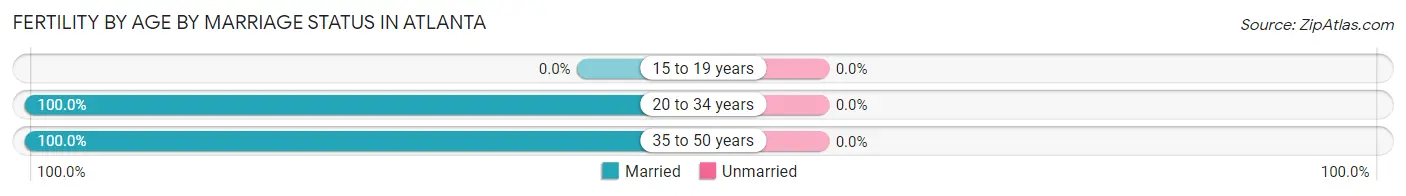
| Age Bracket | Married | Unmarried |
| 15 to 19 years | 0 (0.0%) | 0 (0.0%) |
| 20 to 34 years | 11 (100.0%) | 0 (0.0%) |
| 35 to 50 years | 92 (100.0%) | 0 (0.0%) |
| Total | 103 (100.0%) | 0 (0.0%) |
Fertility by Education in Atlanta
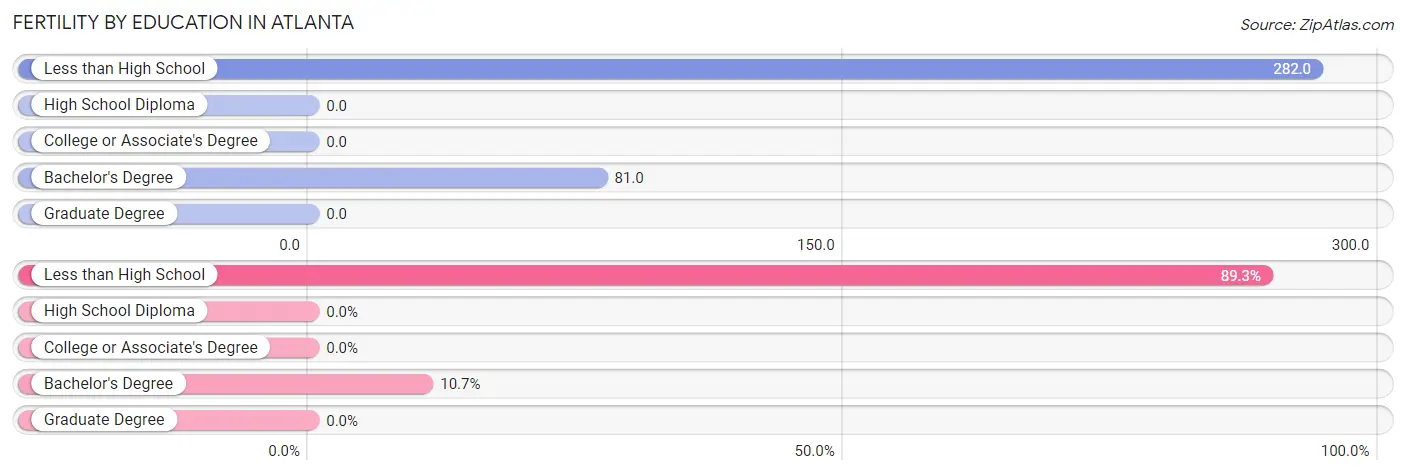
| Educational Attainment | Women with Births | Births / 1,000 Women |
| Less than High School | 92 (89.3%) | 282.0 |
| High School Diploma | 0 (0.0%) | 0.0 |
| College or Associate's Degree | 0 (0.0%) | 0.0 |
| Bachelor's Degree | 11 (10.7%) | 81.0 |
| Graduate Degree | 0 (0.0%) | 0.0 |
| Total | 103 (100.0%) | 98.0 |
Fertility by Education by Marriage Status in Atlanta
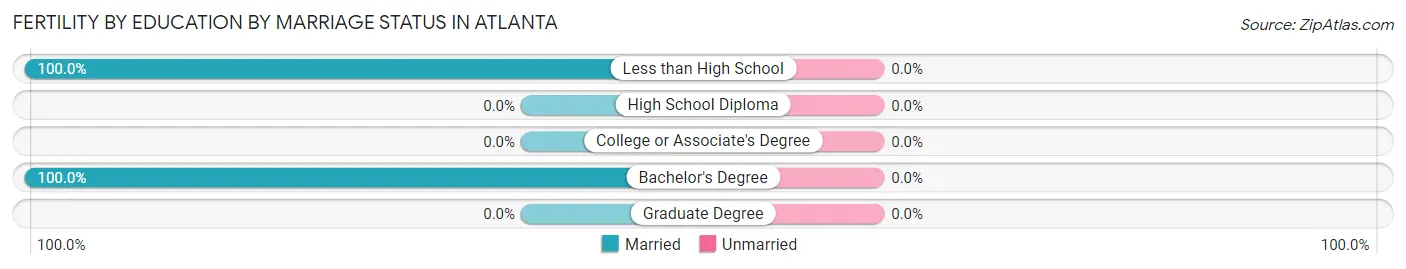
| Educational Attainment | Married | Unmarried |
| Less than High School | 92 (100.0%) | 0 (0.0%) |
| High School Diploma | 0 (0.0%) | 0 (0.0%) |
| College or Associate's Degree | 0 (0.0%) | 0 (0.0%) |
| Bachelor's Degree | 11 (100.0%) | 0 (0.0%) |
| Graduate Degree | 0 (0.0%) | 0 (0.0%) |
| Total | 103 (100.0%) | 0 (0.0%) |
Employment Characteristics in Atlanta
Employment by Class of Employer in Atlanta
Among the 2,355 employed individuals in Atlanta, private company employees (1,523 | 64.7%), not-for-profit organizations (262 | 11.1%), and local government employees (207 | 8.8%) make up the most common classes of employment.
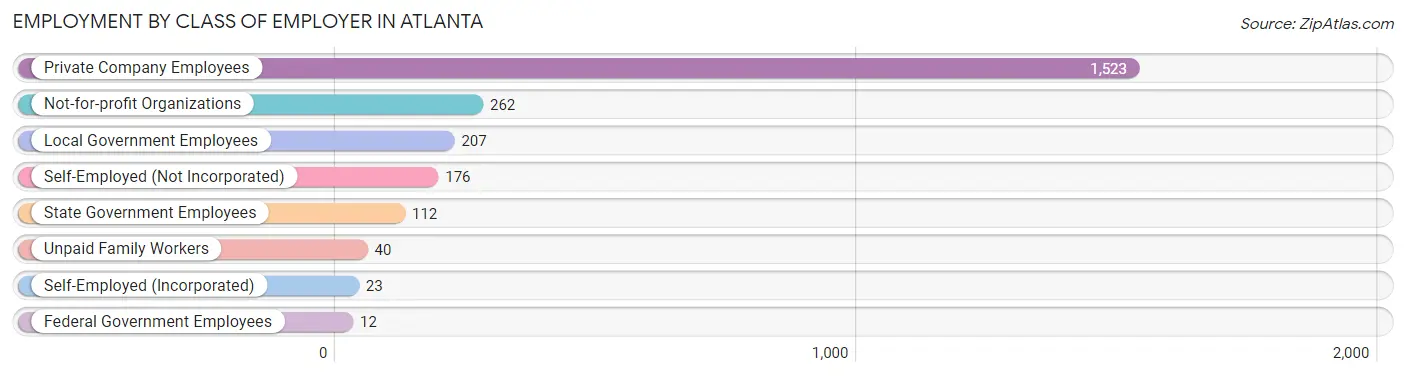
| Employer Class | # Employees | % Employees |
| Private Company Employees | 1,523 | 64.7% |
| Self-Employed (Incorporated) | 23 | 1.0% |
| Self-Employed (Not Incorporated) | 176 | 7.5% |
| Not-for-profit Organizations | 262 | 11.1% |
| Local Government Employees | 207 | 8.8% |
| State Government Employees | 112 | 4.8% |
| Federal Government Employees | 12 | 0.5% |
| Unpaid Family Workers | 40 | 1.7% |
| Total | 2,355 | 100.0% |
Employment Status by Age in Atlanta
According to the labor force statistics for Atlanta, out of the total population over 16 years of age (4,352), 58.6% or 2,550 individuals are in the labor force, with 7.6% or 194 of them unemployed. The age group with the highest labor force participation rate is 30 to 34 years, with 83.0% or 361 individuals in the labor force. Within the labor force, the 20 to 24 years age range has the highest percentage of unemployed individuals, with 21.3% or 36 of them being unemployed.
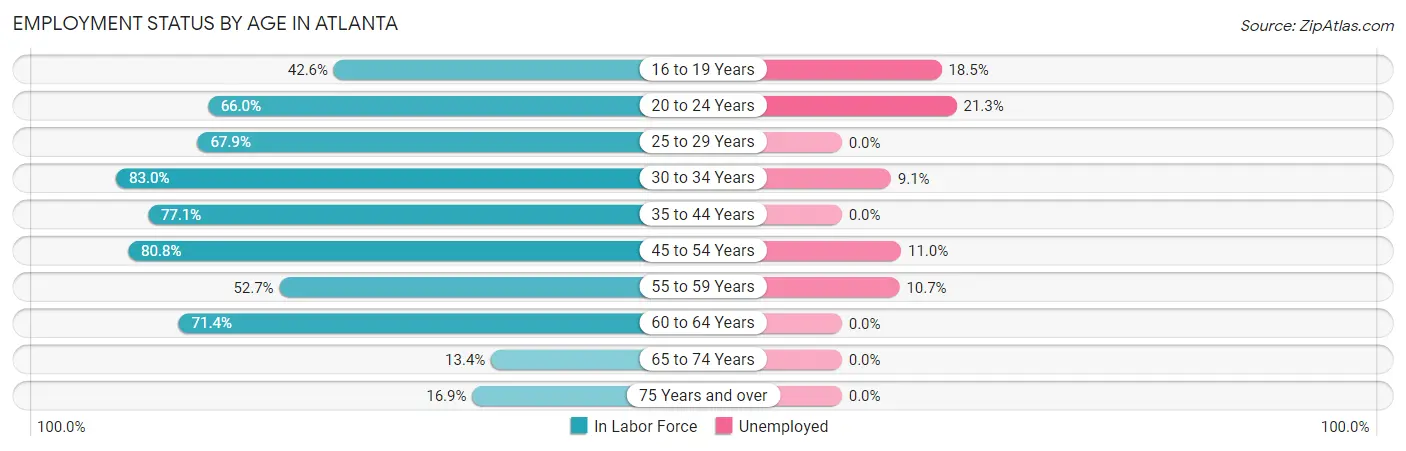
| Age Bracket | In Labor Force | Unemployed |
| 16 to 19 Years | 92 (42.6%) | 17 (18.5%) |
| 20 to 24 Years | 169 (66.0%) | 36 (21.3%) |
| 25 to 29 Years | 220 (67.9%) | 0 (0.0%) |
| 30 to 34 Years | 361 (83.0%) | 33 (9.1%) |
| 35 to 44 Years | 366 (77.1%) | 0 (0.0%) |
| 45 to 54 Years | 810 (80.8%) | 89 (11.0%) |
| 55 to 59 Years | 178 (52.7%) | 19 (10.7%) |
| 60 to 64 Years | 192 (71.4%) | 0 (0.0%) |
| 65 to 74 Years | 54 (13.4%) | 0 (0.0%) |
| 75 Years and over | 107 (16.9%) | 0 (0.0%) |
| Total | 2,550 (58.6%) | 194 (7.6%) |
Employment Status by Educational Attainment in Atlanta
According to labor force statistics for Atlanta, 74.8% of individuals (2,127) out of the total population between 25 and 64 years of age (2,843) are in the labor force, with 6.6% or 140 of them being unemployed. The group with the highest labor force participation rate are those with the educational attainment of bachelor's degree or higher, with 94.2% or 589 individuals in the labor force. Within the labor force, individuals with less than high school education have the highest percentage of unemployment, with 13.1% or 33 of them being unemployed.
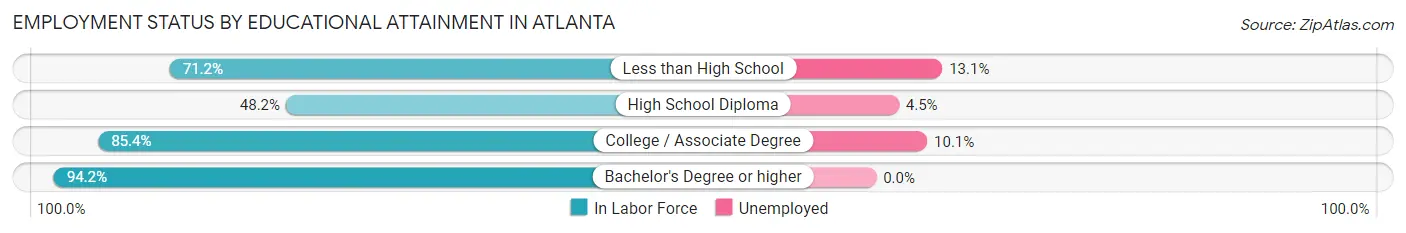
| Educational Attainment | In Labor Force | Unemployed |
| Less than High School | 252 (71.2%) | 46 (13.1%) |
| High School Diploma | 396 (48.2%) | 37 (4.5%) |
| College / Associate Degree | 890 (85.4%) | 105 (10.1%) |
| Bachelor's Degree or higher | 589 (94.2%) | 0 (0.0%) |
| Total | 2,127 (74.8%) | 188 (6.6%) |
Employment Occupations by Sex in Atlanta
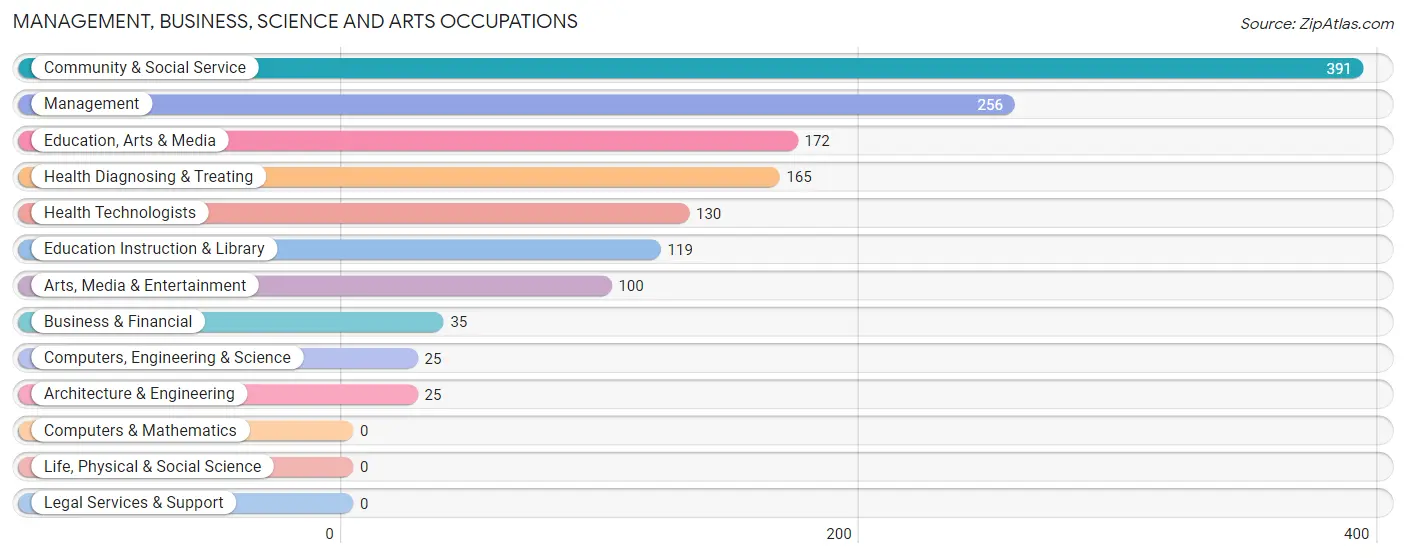
Management, Business, Science and Arts Occupations
The most common Management, Business, Science and Arts occupations in Atlanta are Community & Social Service (391 | 16.6%), Management (256 | 10.9%), Education, Arts & Media (172 | 7.3%), Health Diagnosing & Treating (165 | 7.0%), and Health Technologists (130 | 5.5%).
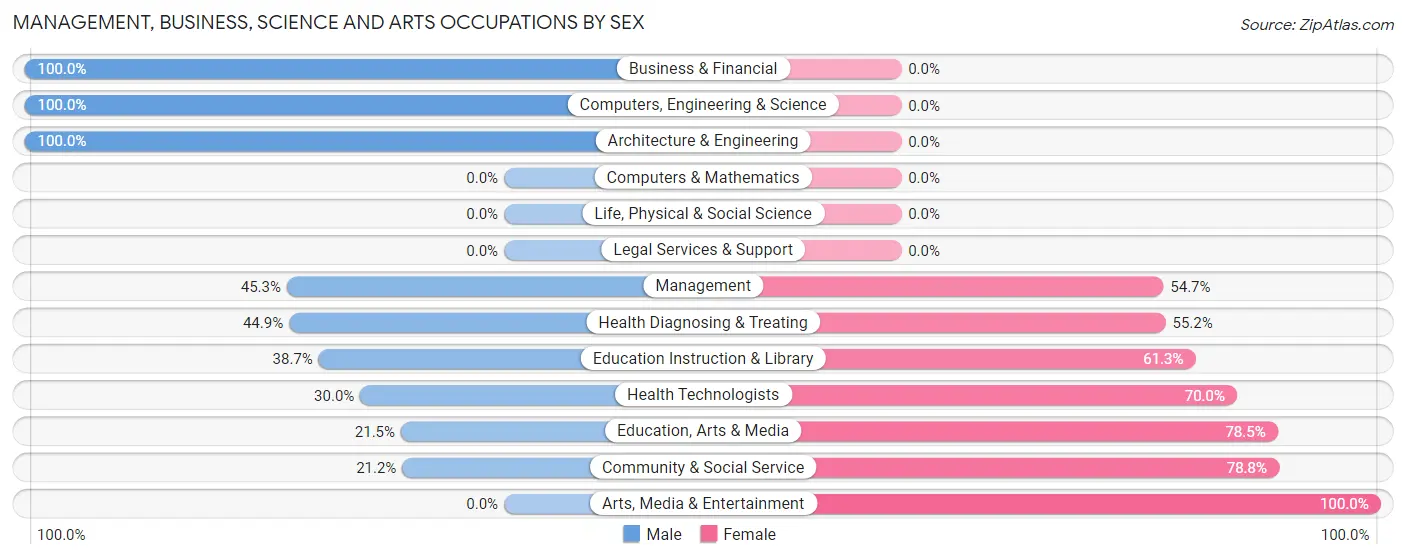
Management, Business, Science and Arts Occupations by Sex
Within the Management, Business, Science and Arts occupations in Atlanta, the most male-oriented occupations are Business & Financial (100.0%), Computers, Engineering & Science (100.0%), and Architecture & Engineering (100.0%), while the most female-oriented occupations are Arts, Media & Entertainment (100.0%), Community & Social Service (78.8%), and Education, Arts & Media (78.5%).
| Occupation | Male | Female |
| Management | 116 (45.3%) | 140 (54.7%) |
| Business & Financial | 35 (100.0%) | 0 (0.0%) |
| Computers, Engineering & Science | 25 (100.0%) | 0 (0.0%) |
| Computers & Mathematics | 0 (0.0%) | 0 (0.0%) |
| Architecture & Engineering | 25 (100.0%) | 0 (0.0%) |
| Life, Physical & Social Science | 0 (0.0%) | 0 (0.0%) |
| Community & Social Service | 83 (21.2%) | 308 (78.8%) |
| Education, Arts & Media | 37 (21.5%) | 135 (78.5%) |
| Legal Services & Support | 0 (0.0%) | 0 (0.0%) |
| Education Instruction & Library | 46 (38.7%) | 73 (61.3%) |
| Arts, Media & Entertainment | 0 (0.0%) | 100 (100.0%) |
| Health Diagnosing & Treating | 74 (44.9%) | 91 (55.1%) |
| Health Technologists | 39 (30.0%) | 91 (70.0%) |
| Total (Category) | 333 (38.2%) | 539 (61.8%) |
| Total (Overall) | 1,188 (50.4%) | 1,167 (49.5%) |
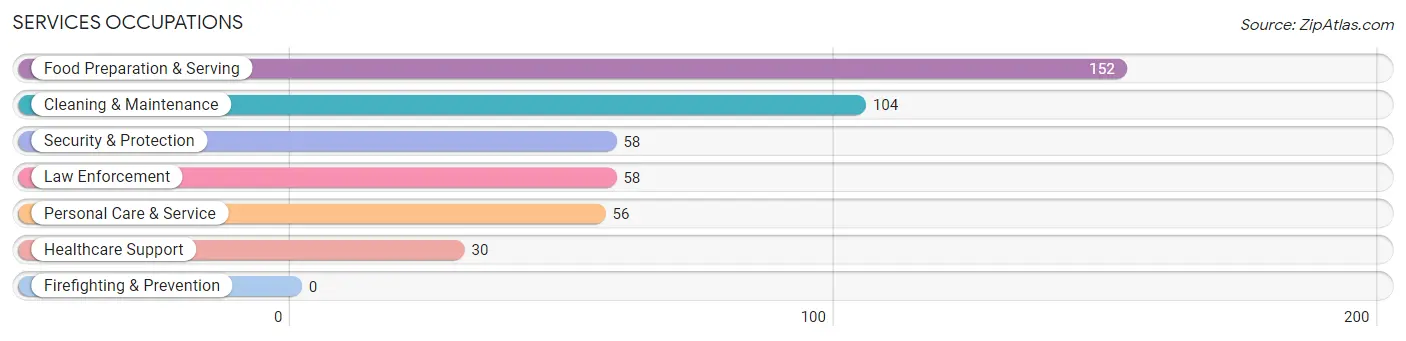
Services Occupations
The most common Services occupations in Atlanta are Food Preparation & Serving (152 | 6.5%), Cleaning & Maintenance (104 | 4.4%), Security & Protection (58 | 2.5%), Law Enforcement (58 | 2.5%), and Personal Care & Service (56 | 2.4%).
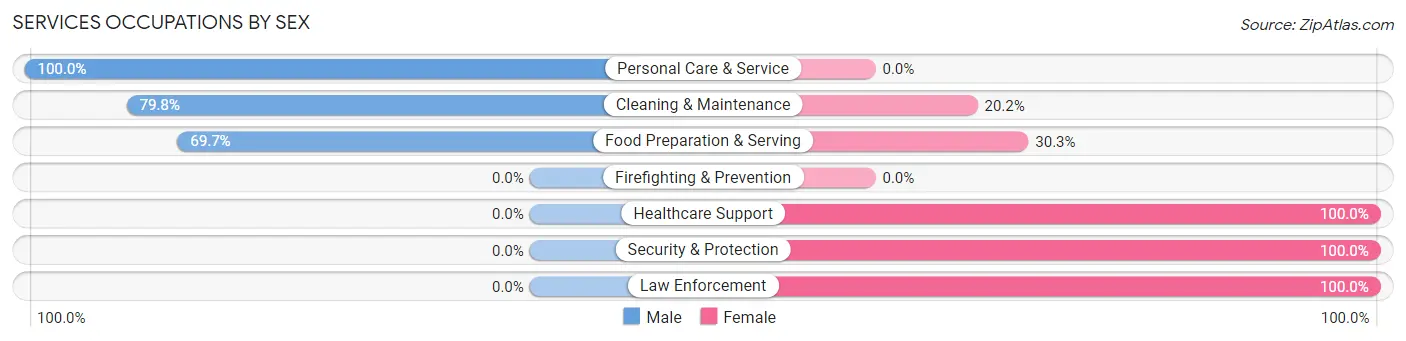
Services Occupations by Sex
Within the Services occupations in Atlanta, the most male-oriented occupations are Personal Care & Service (100.0%), Cleaning & Maintenance (79.8%), and Food Preparation & Serving (69.7%), while the most female-oriented occupations are Healthcare Support (100.0%), Security & Protection (100.0%), and Law Enforcement (100.0%).
| Occupation | Male | Female |
| Healthcare Support | 0 (0.0%) | 30 (100.0%) |
| Security & Protection | 0 (0.0%) | 58 (100.0%) |
| Firefighting & Prevention | 0 (0.0%) | 0 (0.0%) |
| Law Enforcement | 0 (0.0%) | 58 (100.0%) |
| Food Preparation & Serving | 106 (69.7%) | 46 (30.3%) |
| Cleaning & Maintenance | 83 (79.8%) | 21 (20.2%) |
| Personal Care & Service | 56 (100.0%) | 0 (0.0%) |
| Total (Category) | 245 (61.3%) | 155 (38.8%) |
| Total (Overall) | 1,188 (50.4%) | 1,167 (49.5%) |
Sales and Office Occupations
The most common Sales and Office occupations in Atlanta are Office & Administration (200 | 8.5%), and Sales & Related (160 | 6.8%).
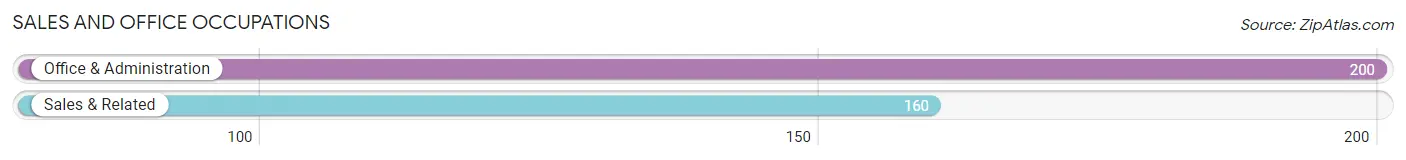
Sales and Office Occupations by Sex

| Occupation | Male | Female |
| Sales & Related | 0 (0.0%) | 160 (100.0%) |
| Office & Administration | 33 (16.5%) | 167 (83.5%) |
| Total (Category) | 33 (9.2%) | 327 (90.8%) |
| Total (Overall) | 1,188 (50.4%) | 1,167 (49.5%) |
Natural Resources, Construction and Maintenance Occupations
The most common Natural Resources, Construction and Maintenance occupations in Atlanta are Construction & Extraction (102 | 4.3%), and Installation, Maintenance & Repair (55 | 2.3%).

Natural Resources, Construction and Maintenance Occupations by Sex

| Occupation | Male | Female |
| Farming, Fishing & Forestry | 0 (0.0%) | 0 (0.0%) |
| Construction & Extraction | 102 (100.0%) | 0 (0.0%) |
| Installation, Maintenance & Repair | 55 (100.0%) | 0 (0.0%) |
| Total (Category) | 157 (100.0%) | 0 (0.0%) |
| Total (Overall) | 1,188 (50.4%) | 1,167 (49.5%) |
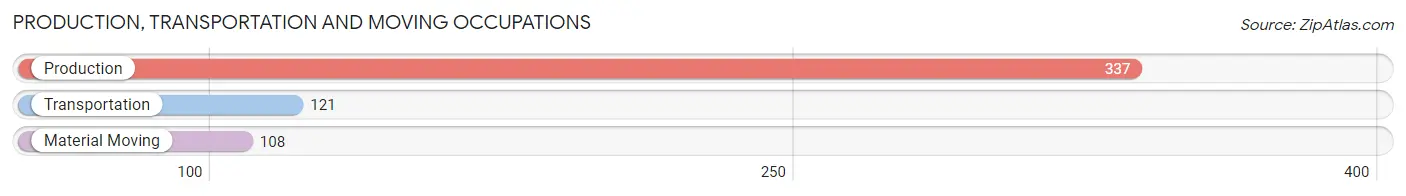
Production, Transportation and Moving Occupations
The most common Production, Transportation and Moving occupations in Atlanta are Production (337 | 14.3%), Transportation (121 | 5.1%), and Material Moving (108 | 4.6%).
Production, Transportation and Moving Occupations by Sex
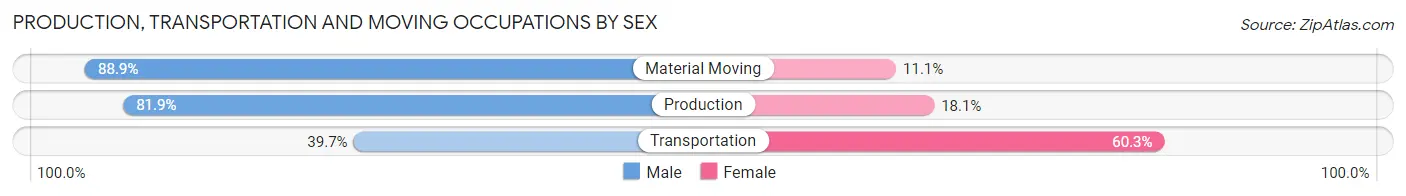
| Occupation | Male | Female |
| Production | 276 (81.9%) | 61 (18.1%) |
| Transportation | 48 (39.7%) | 73 (60.3%) |
| Material Moving | 96 (88.9%) | 12 (11.1%) |
| Total (Category) | 420 (74.2%) | 146 (25.8%) |
| Total (Overall) | 1,188 (50.4%) | 1,167 (49.5%) |
Employment Industries by Sex in Atlanta
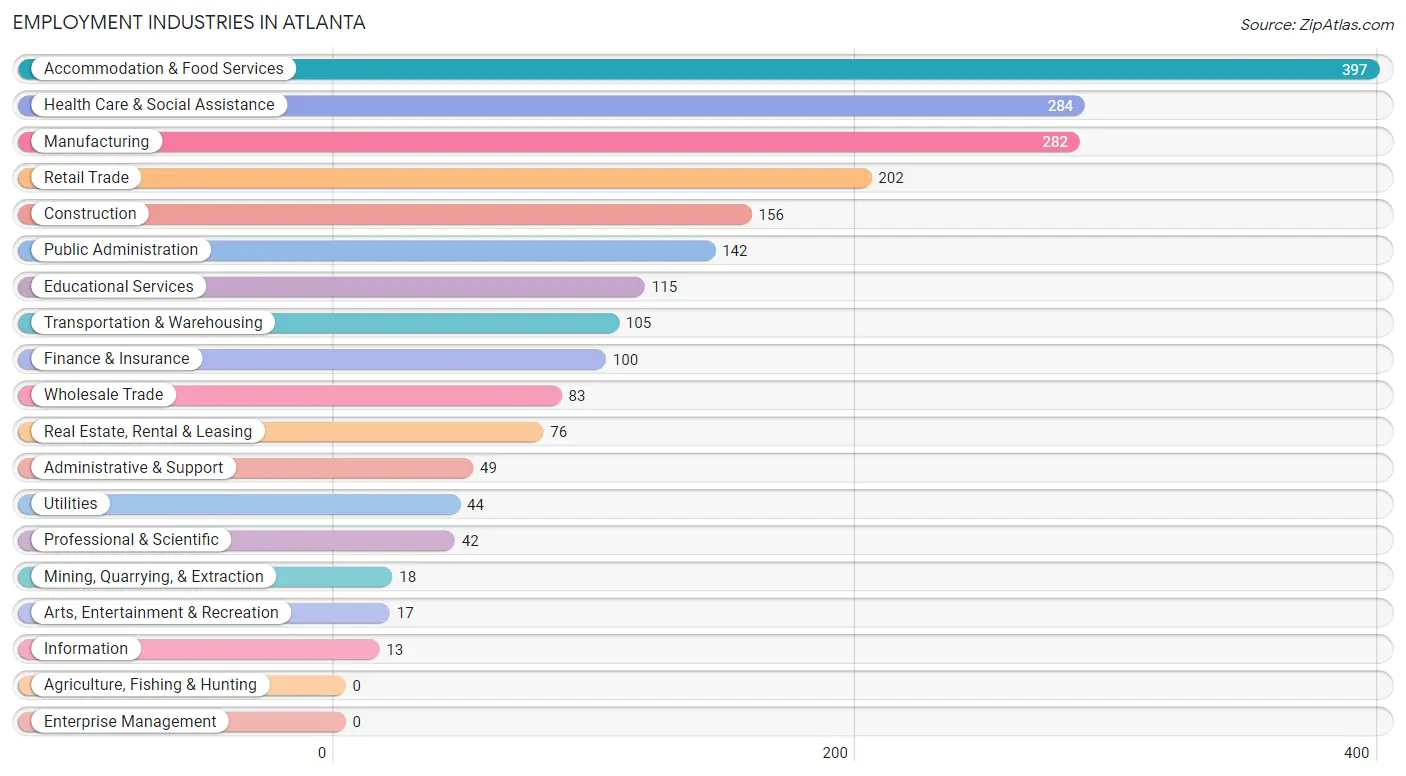
Employment Industries in Atlanta
The major employment industries in Atlanta include Accommodation & Food Services (397 | 16.9%), Health Care & Social Assistance (284 | 12.1%), Manufacturing (282 | 12.0%), Retail Trade (202 | 8.6%), and Construction (156 | 6.6%).
Employment Industries by Sex in Atlanta
The Atlanta industries that see more men than women are Mining, Quarrying, & Extraction (100.0%), Construction (100.0%), and Utilities (100.0%), whereas the industries that tend to have a higher number of women are Information (100.0%), Finance & Insurance (100.0%), and Arts, Entertainment & Recreation (100.0%).
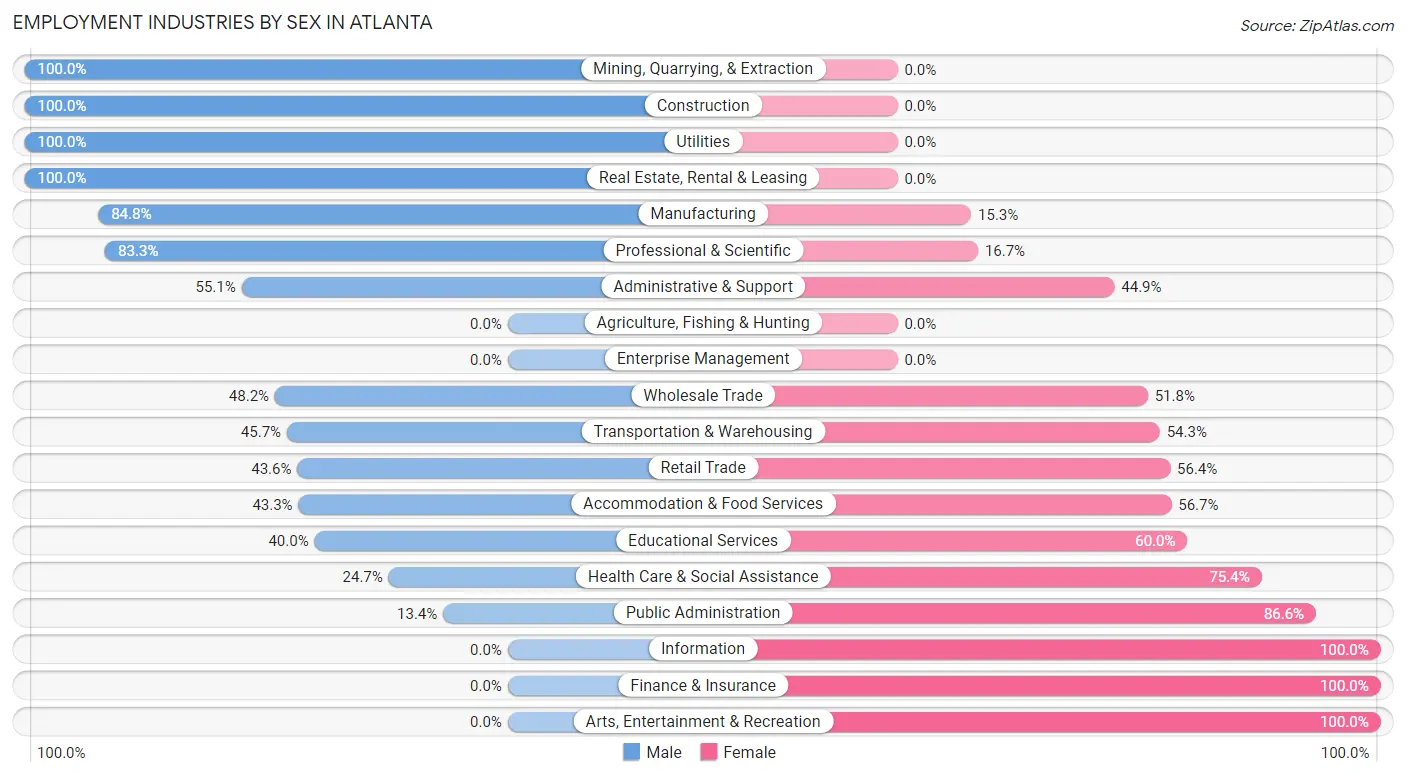
| Industry | Male | Female |
| Agriculture, Fishing & Hunting | 0 (0.0%) | 0 (0.0%) |
| Mining, Quarrying, & Extraction | 18 (100.0%) | 0 (0.0%) |
| Construction | 156 (100.0%) | 0 (0.0%) |
| Manufacturing | 239 (84.8%) | 43 (15.2%) |
| Wholesale Trade | 40 (48.2%) | 43 (51.8%) |
| Retail Trade | 88 (43.6%) | 114 (56.4%) |
| Transportation & Warehousing | 48 (45.7%) | 57 (54.3%) |
| Utilities | 44 (100.0%) | 0 (0.0%) |
| Information | 0 (0.0%) | 13 (100.0%) |
| Finance & Insurance | 0 (0.0%) | 100 (100.0%) |
| Real Estate, Rental & Leasing | 76 (100.0%) | 0 (0.0%) |
| Professional & Scientific | 35 (83.3%) | 7 (16.7%) |
| Enterprise Management | 0 (0.0%) | 0 (0.0%) |
| Administrative & Support | 27 (55.1%) | 22 (44.9%) |
| Educational Services | 46 (40.0%) | 69 (60.0%) |
| Health Care & Social Assistance | 70 (24.6%) | 214 (75.3%) |
| Arts, Entertainment & Recreation | 0 (0.0%) | 17 (100.0%) |
| Accommodation & Food Services | 172 (43.3%) | 225 (56.7%) |
| Public Administration | 19 (13.4%) | 123 (86.6%) |
| Total | 1,188 (50.4%) | 1,167 (49.5%) |
Education in Atlanta
School Enrollment in Atlanta
The most common levels of schooling among the 1,271 students in Atlanta are high school (322 | 25.3%), college / undergraduate (222 | 17.5%), and kindergarten (212 | 16.7%).
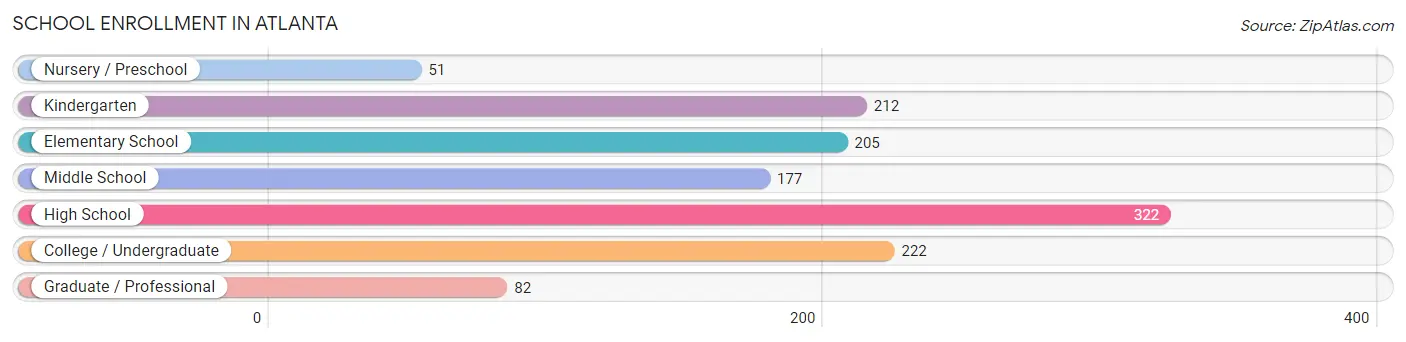
| School Level | # Students | % Students |
| Nursery / Preschool | 51 | 4.0% |
| Kindergarten | 212 | 16.7% |
| Elementary School | 205 | 16.1% |
| Middle School | 177 | 13.9% |
| High School | 322 | 25.3% |
| College / Undergraduate | 222 | 17.5% |
| Graduate / Professional | 82 | 6.5% |
| Total | 1,271 | 100.0% |
School Enrollment by Age by Funding Source in Atlanta
Out of a total of 1,271 students who are enrolled in schools in Atlanta, 67 (5.3%) attend a private institution, while the remaining 1,204 (94.7%) are enrolled in public schools. The age group of 25 to 34 year olds has the highest likelihood of being enrolled in private schools, with 22 (25.9% in the age bracket) enrolled. Conversely, the age group of 10 to 14 year olds has the lowest likelihood of being enrolled in a private school, with 342 (100.0% in the age bracket) attending a public institution.
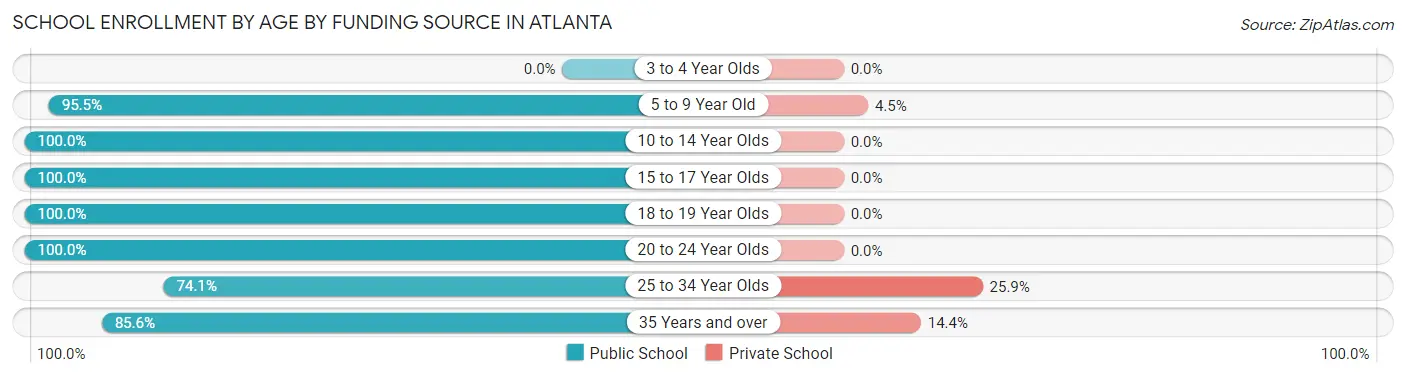
| Age Bracket | Public School | Private School |
| 3 to 4 Year Olds | 0 (0.0%) | 0 (0.0%) |
| 5 to 9 Year Old | 422 (95.5%) | 20 (4.5%) |
| 10 to 14 Year Olds | 342 (100.0%) | 0 (0.0%) |
| 15 to 17 Year Olds | 144 (100.0%) | 0 (0.0%) |
| 18 to 19 Year Olds | 48 (100.0%) | 0 (0.0%) |
| 20 to 24 Year Olds | 36 (100.0%) | 0 (0.0%) |
| 25 to 34 Year Olds | 63 (74.1%) | 22 (25.9%) |
| 35 Years and over | 149 (85.6%) | 25 (14.4%) |
| Total | 1,204 (94.7%) | 67 (5.3%) |
Educational Attainment by Field of Study in Atlanta
Science & technology (252 | 27.9%), engineering (146 | 16.2%), education (134 | 14.9%), business (125 | 13.9%), and arts & humanities (95 | 10.5%) are the most common fields of study among 902 individuals in Atlanta who have obtained a bachelor's degree or higher.
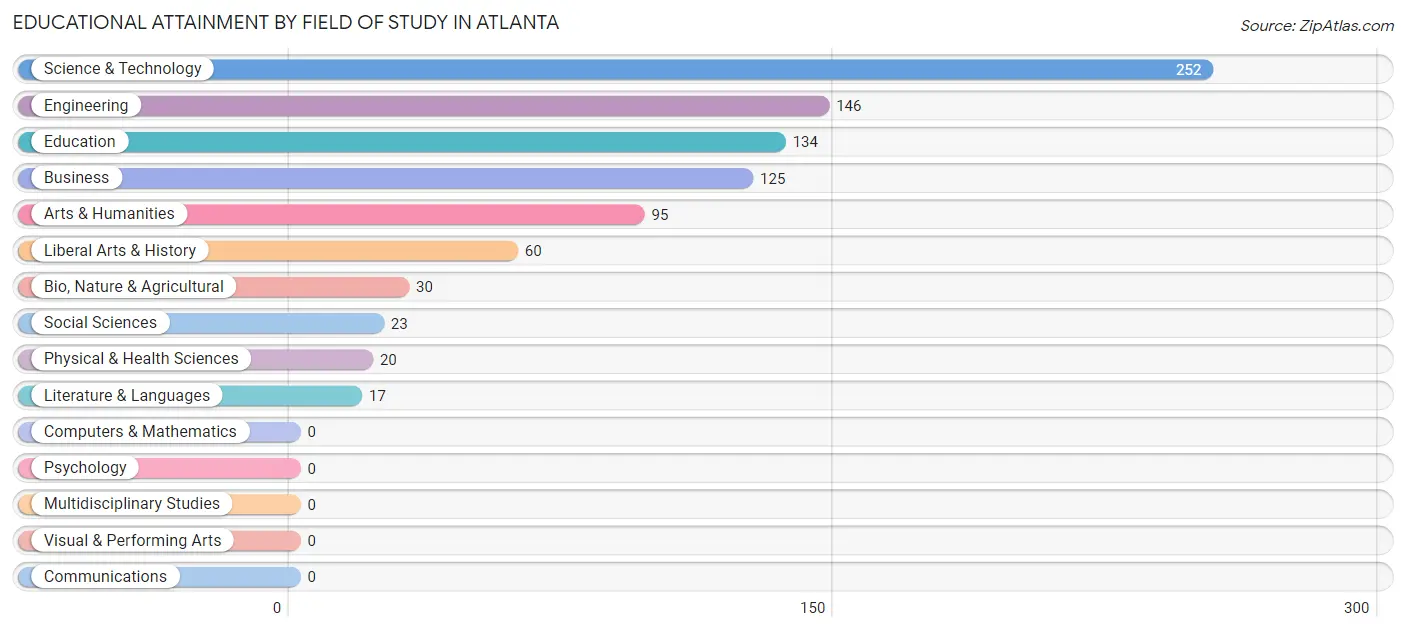
| Field of Study | # Graduates | % Graduates |
| Computers & Mathematics | 0 | 0.0% |
| Bio, Nature & Agricultural | 30 | 3.3% |
| Physical & Health Sciences | 20 | 2.2% |
| Psychology | 0 | 0.0% |
| Social Sciences | 23 | 2.5% |
| Engineering | 146 | 16.2% |
| Multidisciplinary Studies | 0 | 0.0% |
| Science & Technology | 252 | 27.9% |
| Business | 125 | 13.9% |
| Education | 134 | 14.9% |
| Literature & Languages | 17 | 1.9% |
| Liberal Arts & History | 60 | 6.7% |
| Visual & Performing Arts | 0 | 0.0% |
| Communications | 0 | 0.0% |
| Arts & Humanities | 95 | 10.5% |
| Total | 902 | 100.0% |
Transportation & Commute in Atlanta
Vehicle Availability by Sex in Atlanta
The most prevalent vehicle ownership categories in Atlanta are males with 3 vehicles (588, accounting for 49.5%) and females with 3 vehicles (486, making up 50.4%).
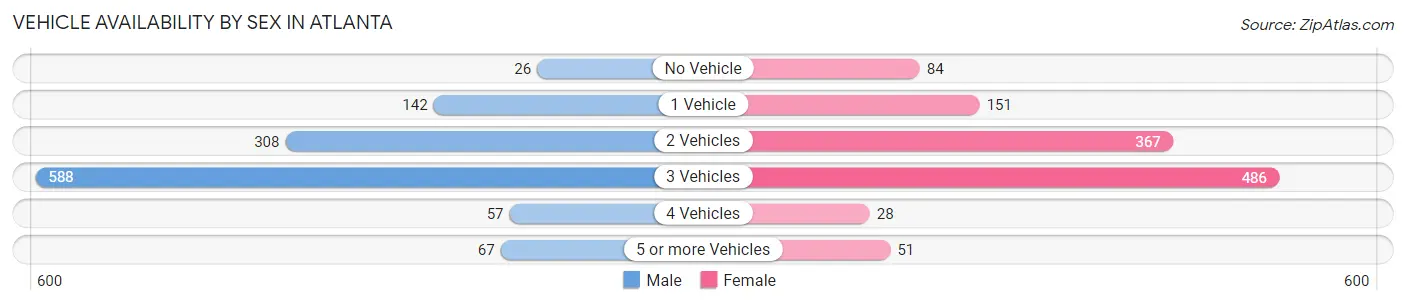
| Vehicles Available | Male | Female |
| No Vehicle | 26 (2.2%) | 84 (7.2%) |
| 1 Vehicle | 142 (11.9%) | 151 (12.9%) |
| 2 Vehicles | 308 (25.9%) | 367 (31.5%) |
| 3 Vehicles | 588 (49.5%) | 486 (41.6%) |
| 4 Vehicles | 57 (4.8%) | 28 (2.4%) |
| 5 or more Vehicles | 67 (5.6%) | 51 (4.4%) |
| Total | 1,188 (100.0%) | 1,167 (100.0%) |
Commute Time in Atlanta
The most frequently occuring commute durations in Atlanta are 5 to 9 minutes (918 commuters, 41.8%), 30 to 34 minutes (260 commuters, 11.8%), and 10 to 14 minutes (253 commuters, 11.5%).

| Commute Time | # Commuters | % Commuters |
| Less than 5 Minutes | 98 | 4.5% |
| 5 to 9 Minutes | 918 | 41.8% |
| 10 to 14 Minutes | 253 | 11.5% |
| 15 to 19 Minutes | 106 | 4.8% |
| 20 to 24 Minutes | 112 | 5.1% |
| 25 to 29 Minutes | 100 | 4.5% |
| 30 to 34 Minutes | 260 | 11.8% |
| 35 to 39 Minutes | 0 | 0.0% |
| 40 to 44 Minutes | 40 | 1.8% |
| 45 to 59 Minutes | 61 | 2.8% |
| 60 to 89 Minutes | 222 | 10.1% |
| 90 or more Minutes | 28 | 1.3% |
Commute Time by Sex in Atlanta
The most common commute times in Atlanta are 5 to 9 minutes (592 commuters, 49.8%) for males and 5 to 9 minutes (326 commuters, 32.3%) for females.
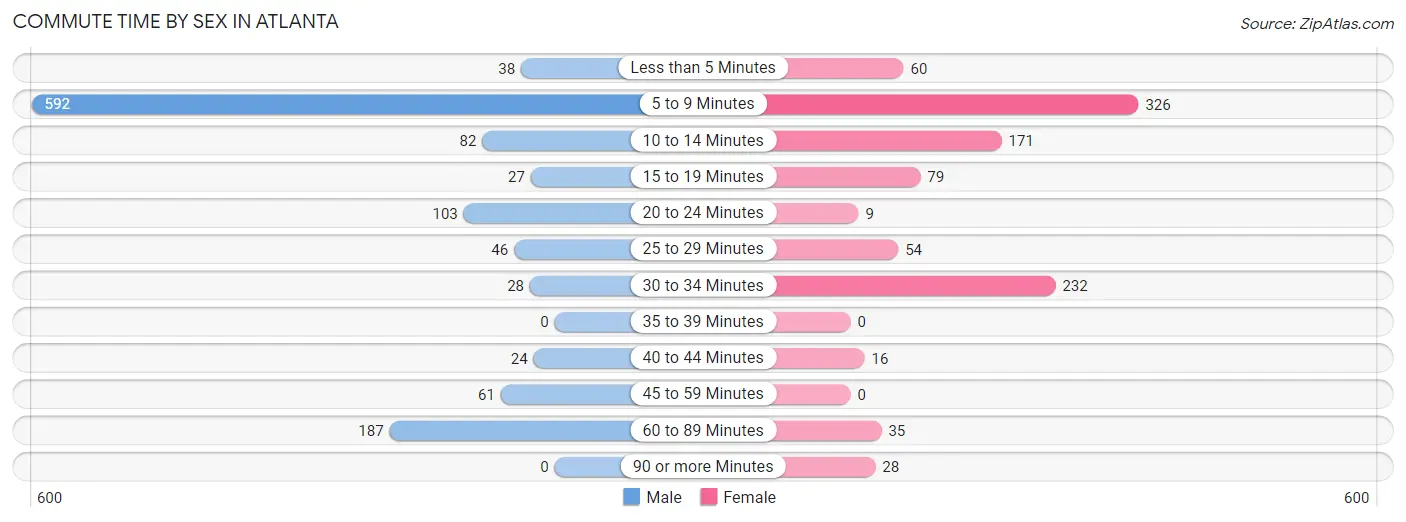
| Commute Time | Male | Female |
| Less than 5 Minutes | 38 (3.2%) | 60 (5.9%) |
| 5 to 9 Minutes | 592 (49.8%) | 326 (32.3%) |
| 10 to 14 Minutes | 82 (6.9%) | 171 (16.9%) |
| 15 to 19 Minutes | 27 (2.3%) | 79 (7.8%) |
| 20 to 24 Minutes | 103 (8.7%) | 9 (0.9%) |
| 25 to 29 Minutes | 46 (3.9%) | 54 (5.3%) |
| 30 to 34 Minutes | 28 (2.4%) | 232 (23.0%) |
| 35 to 39 Minutes | 0 (0.0%) | 0 (0.0%) |
| 40 to 44 Minutes | 24 (2.0%) | 16 (1.6%) |
| 45 to 59 Minutes | 61 (5.1%) | 0 (0.0%) |
| 60 to 89 Minutes | 187 (15.7%) | 35 (3.5%) |
| 90 or more Minutes | 0 (0.0%) | 28 (2.8%) |
Time of Departure to Work by Sex in Atlanta
The most frequent times of departure to work in Atlanta are 8:00 AM to 8:29 AM (187, 15.7%) for males and 7:00 AM to 7:29 AM (236, 23.4%) for females.
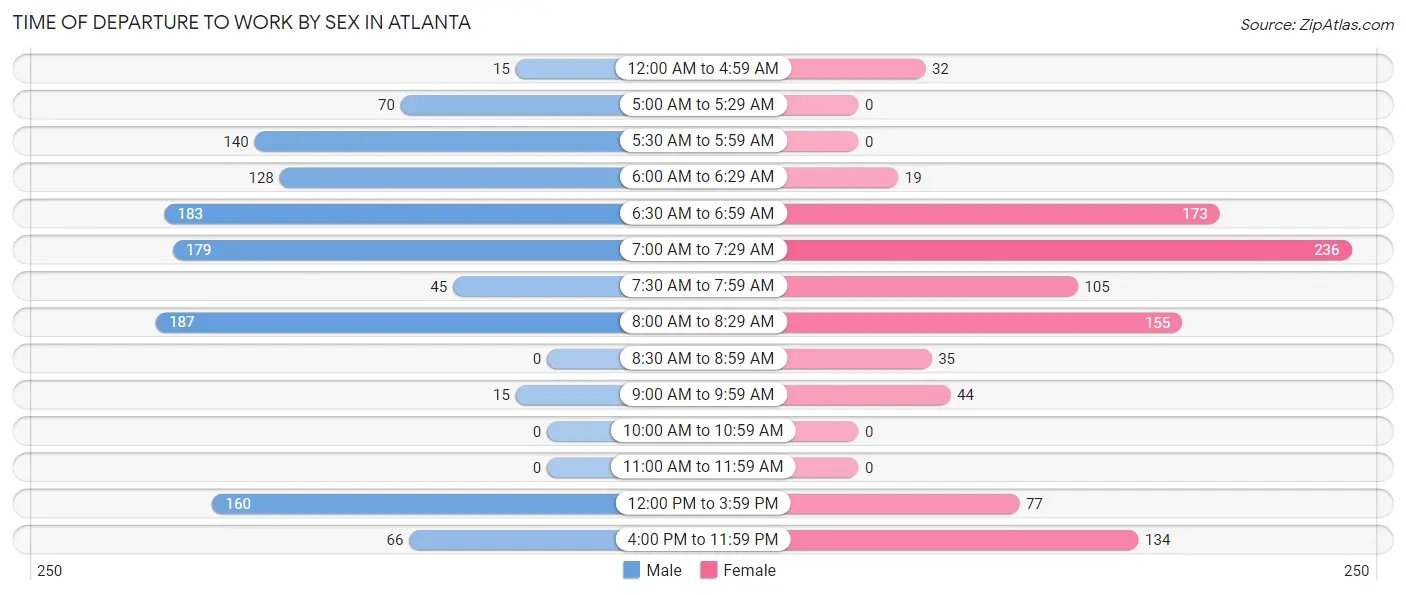
| Time of Departure | Male | Female |
| 12:00 AM to 4:59 AM | 15 (1.3%) | 32 (3.2%) |
| 5:00 AM to 5:29 AM | 70 (5.9%) | 0 (0.0%) |
| 5:30 AM to 5:59 AM | 140 (11.8%) | 0 (0.0%) |
| 6:00 AM to 6:29 AM | 128 (10.8%) | 19 (1.9%) |
| 6:30 AM to 6:59 AM | 183 (15.4%) | 173 (17.1%) |
| 7:00 AM to 7:29 AM | 179 (15.1%) | 236 (23.4%) |
| 7:30 AM to 7:59 AM | 45 (3.8%) | 105 (10.4%) |
| 8:00 AM to 8:29 AM | 187 (15.7%) | 155 (15.3%) |
| 8:30 AM to 8:59 AM | 0 (0.0%) | 35 (3.5%) |
| 9:00 AM to 9:59 AM | 15 (1.3%) | 44 (4.4%) |
| 10:00 AM to 10:59 AM | 0 (0.0%) | 0 (0.0%) |
| 11:00 AM to 11:59 AM | 0 (0.0%) | 0 (0.0%) |
| 12:00 PM to 3:59 PM | 160 (13.5%) | 77 (7.6%) |
| 4:00 PM to 11:59 PM | 66 (5.6%) | 134 (13.3%) |
| Total | 1,188 (100.0%) | 1,010 (100.0%) |
Housing Occupancy in Atlanta
Occupancy by Ownership in Atlanta
Of the total 2,033 dwellings in Atlanta, owner-occupied units account for 1,331 (65.5%), while renter-occupied units make up 702 (34.5%).
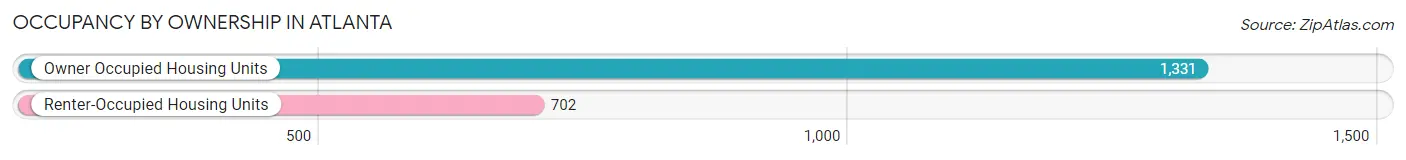
| Occupancy | # Housing Units | % Housing Units |
| Owner Occupied Housing Units | 1,331 | 65.5% |
| Renter-Occupied Housing Units | 702 | 34.5% |
| Total Occupied Housing Units | 2,033 | 100.0% |
Occupancy by Household Size in Atlanta
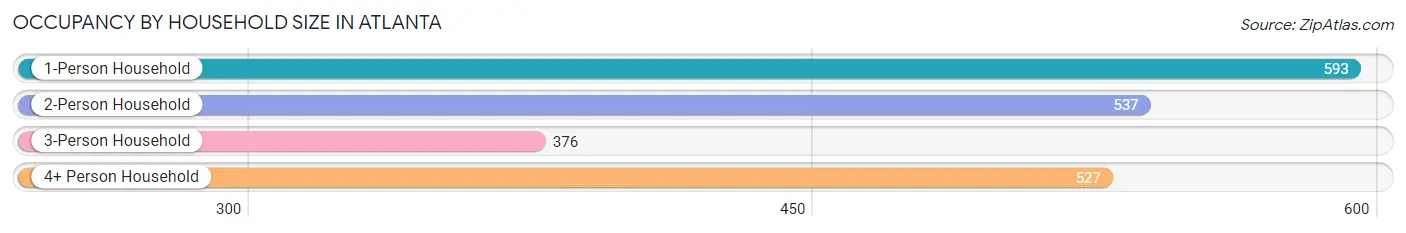
| Household Size | # Housing Units | % Housing Units |
| 1-Person Household | 593 | 29.2% |
| 2-Person Household | 537 | 26.4% |
| 3-Person Household | 376 | 18.5% |
| 4+ Person Household | 527 | 25.9% |
| Total Housing Units | 2,033 | 100.0% |
Occupancy by Ownership by Household Size in Atlanta
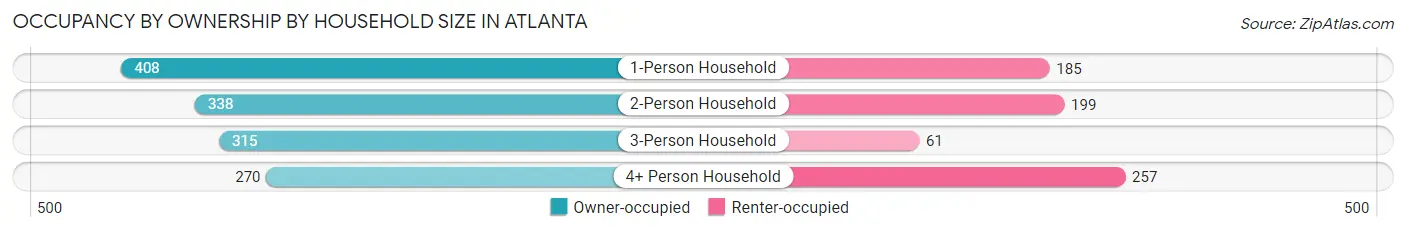
| Household Size | Owner-occupied | Renter-occupied |
| 1-Person Household | 408 (68.8%) | 185 (31.2%) |
| 2-Person Household | 338 (62.9%) | 199 (37.1%) |
| 3-Person Household | 315 (83.8%) | 61 (16.2%) |
| 4+ Person Household | 270 (51.2%) | 257 (48.8%) |
| Total Housing Units | 1,331 (65.5%) | 702 (34.5%) |
Occupancy by Educational Attainment in Atlanta
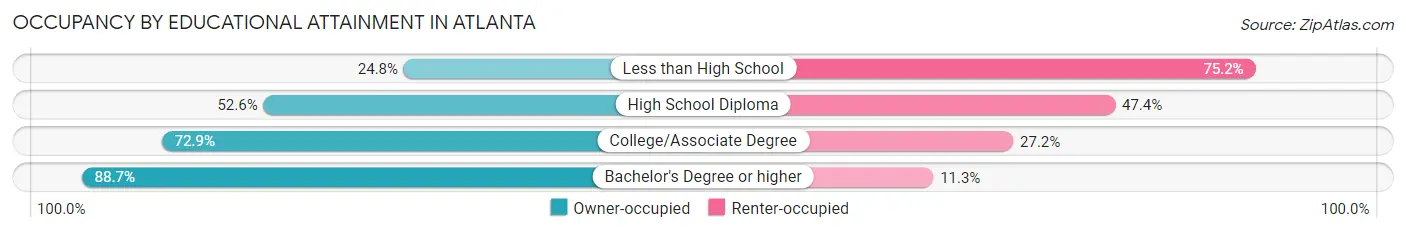
| Household Size | Owner-occupied | Renter-occupied |
| Less than High School | 65 (24.8%) | 197 (75.2%) |
| High School Diploma | 249 (52.6%) | 224 (47.4%) |
| College/Associate Degree | 617 (72.9%) | 230 (27.2%) |
| Bachelor's Degree or higher | 400 (88.7%) | 51 (11.3%) |
Occupancy by Age of Householder in Atlanta
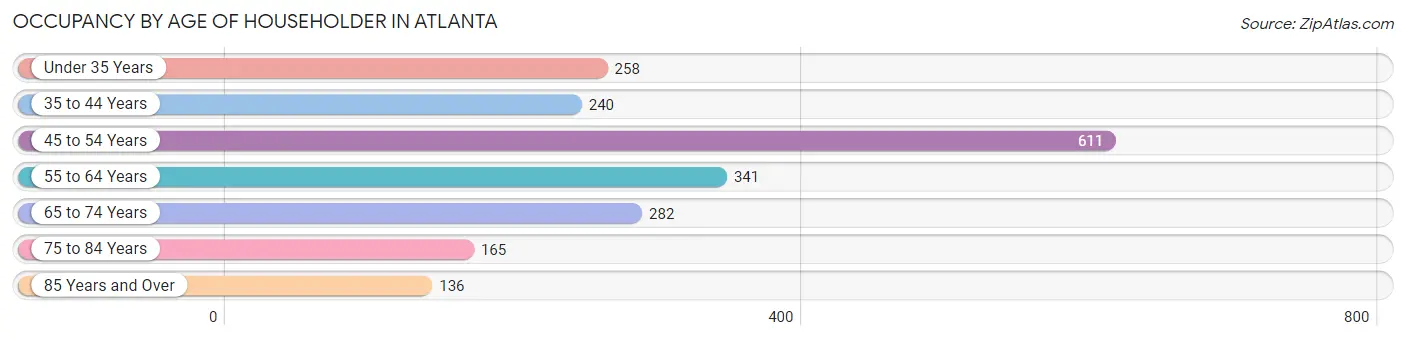
| Age Bracket | # Households | % Households |
| Under 35 Years | 258 | 12.7% |
| 35 to 44 Years | 240 | 11.8% |
| 45 to 54 Years | 611 | 30.0% |
| 55 to 64 Years | 341 | 16.8% |
| 65 to 74 Years | 282 | 13.9% |
| 75 to 84 Years | 165 | 8.1% |
| 85 Years and Over | 136 | 6.7% |
| Total | 2,033 | 100.0% |
Housing Finances in Atlanta
Median Income by Occupancy in Atlanta
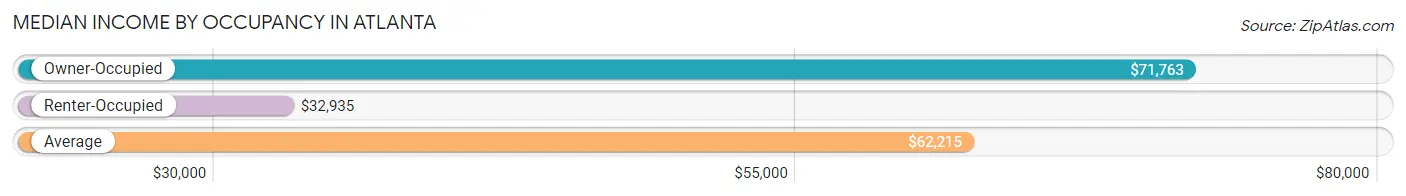
| Occupancy Type | # Households | Median Income |
| Owner-Occupied | 1,331 (65.5%) | $71,763 |
| Renter-Occupied | 702 (34.5%) | $32,935 |
| Average | 2,033 (100.0%) | $62,215 |
Occupancy by Householder Income Bracket in Atlanta
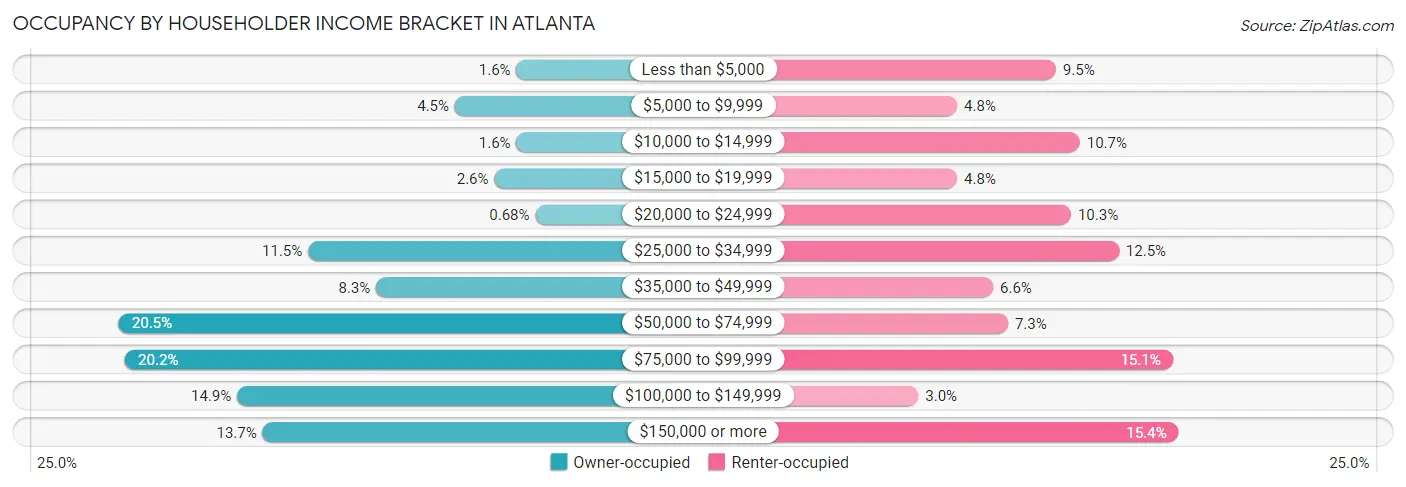
| Income Bracket | Owner-occupied | Renter-occupied |
| Less than $5,000 | 21 (1.6%) | 67 (9.5%) |
| $5,000 to $9,999 | 60 (4.5%) | 34 (4.8%) |
| $10,000 to $14,999 | 21 (1.6%) | 75 (10.7%) |
| $15,000 to $19,999 | 35 (2.6%) | 34 (4.8%) |
| $20,000 to $24,999 | 9 (0.7%) | 72 (10.3%) |
| $25,000 to $34,999 | 153 (11.5%) | 88 (12.5%) |
| $35,000 to $49,999 | 110 (8.3%) | 46 (6.6%) |
| $50,000 to $74,999 | 273 (20.5%) | 51 (7.3%) |
| $75,000 to $99,999 | 269 (20.2%) | 106 (15.1%) |
| $100,000 to $149,999 | 198 (14.9%) | 21 (3.0%) |
| $150,000 or more | 182 (13.7%) | 108 (15.4%) |
| Total | 1,331 (100.0%) | 702 (100.0%) |
Monthly Housing Cost Tiers in Atlanta
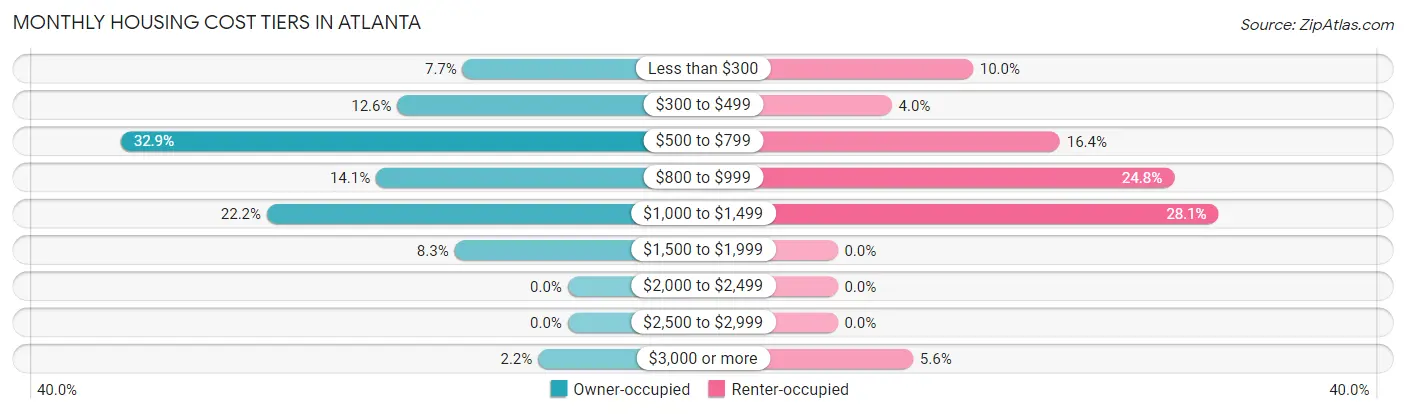
| Monthly Cost | Owner-occupied | Renter-occupied |
| Less than $300 | 103 (7.7%) | 70 (10.0%) |
| $300 to $499 | 167 (12.6%) | 28 (4.0%) |
| $500 to $799 | 438 (32.9%) | 115 (16.4%) |
| $800 to $999 | 188 (14.1%) | 174 (24.8%) |
| $1,000 to $1,499 | 295 (22.2%) | 197 (28.1%) |
| $1,500 to $1,999 | 111 (8.3%) | 0 (0.0%) |
| $2,000 to $2,499 | 0 (0.0%) | 0 (0.0%) |
| $2,500 to $2,999 | 0 (0.0%) | 0 (0.0%) |
| $3,000 or more | 29 (2.2%) | 39 (5.6%) |
| Total | 1,331 (100.0%) | 702 (100.0%) |
Physical Housing Characteristics in Atlanta
Housing Structures in Atlanta
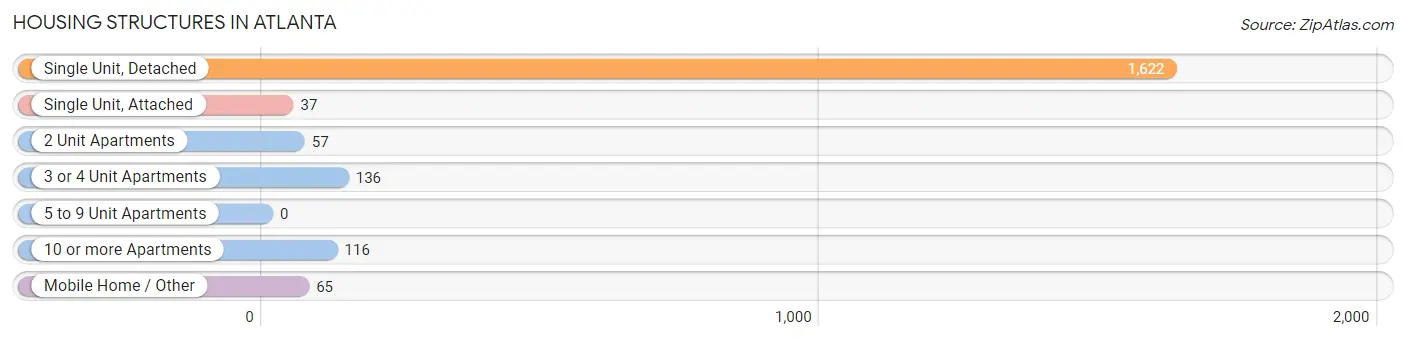
| Structure Type | # Housing Units | % Housing Units |
| Single Unit, Detached | 1,622 | 79.8% |
| Single Unit, Attached | 37 | 1.8% |
| 2 Unit Apartments | 57 | 2.8% |
| 3 or 4 Unit Apartments | 136 | 6.7% |
| 5 to 9 Unit Apartments | 0 | 0.0% |
| 10 or more Apartments | 116 | 5.7% |
| Mobile Home / Other | 65 | 3.2% |
| Total | 2,033 | 100.0% |
Housing Structures by Occupancy in Atlanta
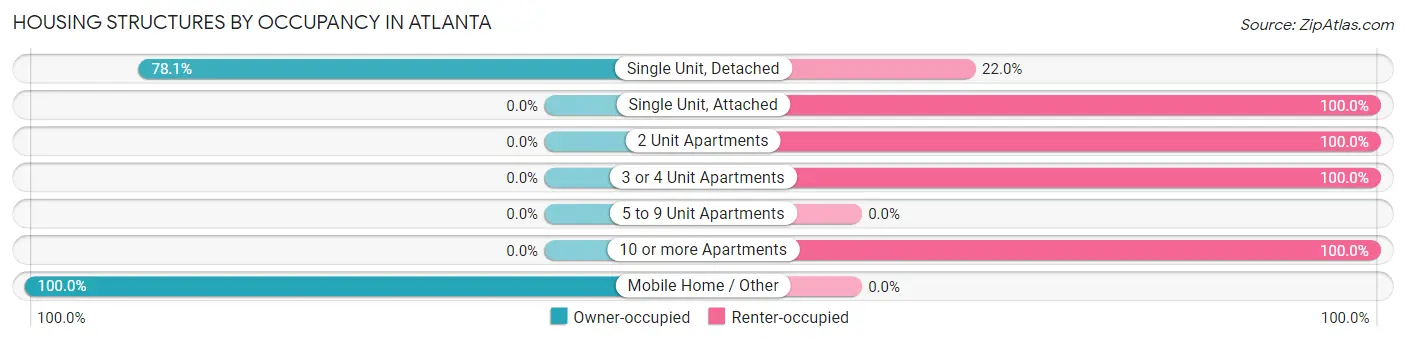
| Structure Type | Owner-occupied | Renter-occupied |
| Single Unit, Detached | 1,266 (78.0%) | 356 (22.0%) |
| Single Unit, Attached | 0 (0.0%) | 37 (100.0%) |
| 2 Unit Apartments | 0 (0.0%) | 57 (100.0%) |
| 3 or 4 Unit Apartments | 0 (0.0%) | 136 (100.0%) |
| 5 to 9 Unit Apartments | 0 (0.0%) | 0 (0.0%) |
| 10 or more Apartments | 0 (0.0%) | 116 (100.0%) |
| Mobile Home / Other | 65 (100.0%) | 0 (0.0%) |
| Total | 1,331 (65.5%) | 702 (34.5%) |
Housing Structures by Number of Rooms in Atlanta
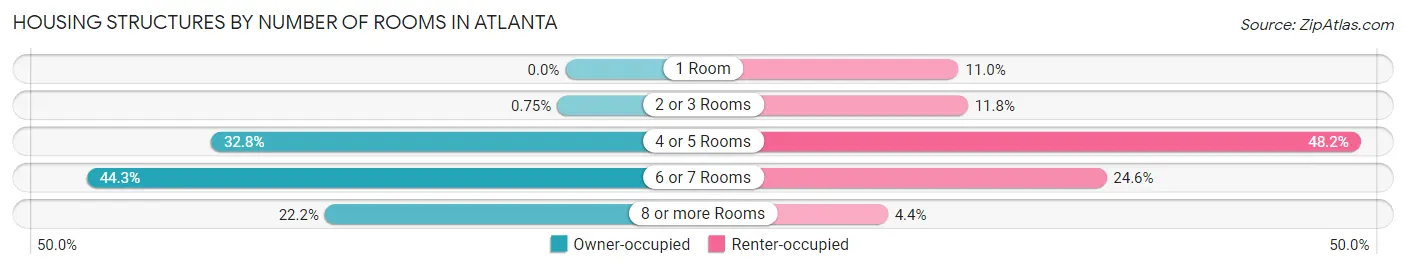
| Number of Rooms | Owner-occupied | Renter-occupied |
| 1 Room | 0 (0.0%) | 77 (11.0%) |
| 2 or 3 Rooms | 10 (0.7%) | 83 (11.8%) |
| 4 or 5 Rooms | 436 (32.8%) | 338 (48.1%) |
| 6 or 7 Rooms | 589 (44.3%) | 173 (24.6%) |
| 8 or more Rooms | 296 (22.2%) | 31 (4.4%) |
| Total | 1,331 (100.0%) | 702 (100.0%) |
Housing Structure by Heating Type in Atlanta
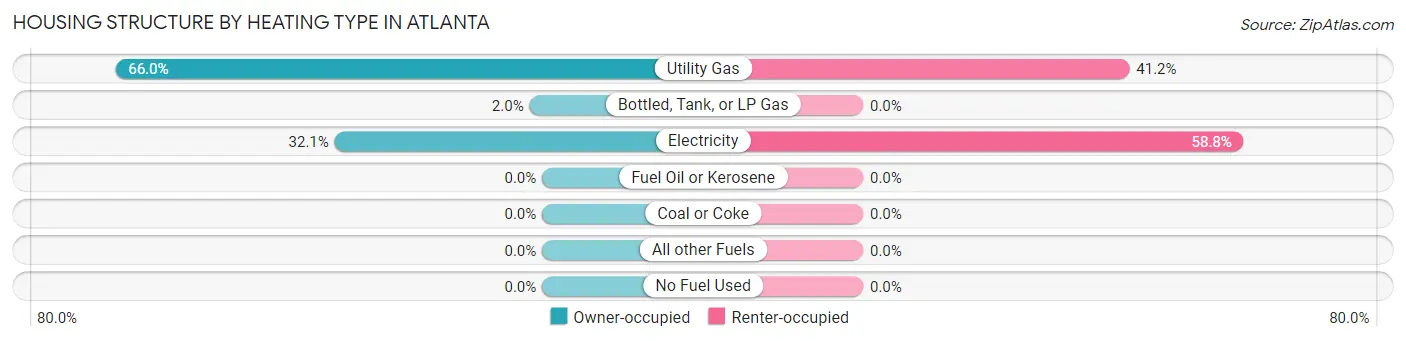
| Heating Type | Owner-occupied | Renter-occupied |
| Utility Gas | 878 (66.0%) | 289 (41.2%) |
| Bottled, Tank, or LP Gas | 26 (1.9%) | 0 (0.0%) |
| Electricity | 427 (32.1%) | 413 (58.8%) |
| Fuel Oil or Kerosene | 0 (0.0%) | 0 (0.0%) |
| Coal or Coke | 0 (0.0%) | 0 (0.0%) |
| All other Fuels | 0 (0.0%) | 0 (0.0%) |
| No Fuel Used | 0 (0.0%) | 0 (0.0%) |
| Total | 1,331 (100.0%) | 702 (100.0%) |
Household Vehicle Usage in Atlanta
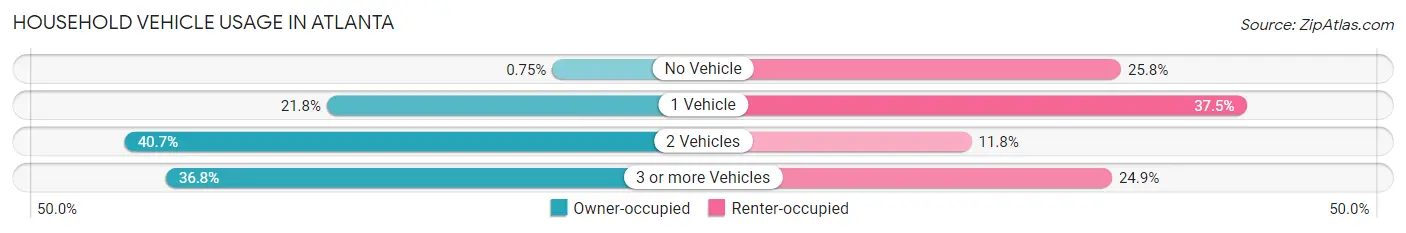
| Vehicles per Household | Owner-occupied | Renter-occupied |
| No Vehicle | 10 (0.7%) | 181 (25.8%) |
| 1 Vehicle | 290 (21.8%) | 263 (37.5%) |
| 2 Vehicles | 541 (40.6%) | 83 (11.8%) |
| 3 or more Vehicles | 490 (36.8%) | 175 (24.9%) |
| Total | 1,331 (100.0%) | 702 (100.0%) |
Real Estate & Mortgages in Atlanta
Real Estate and Mortgage Overview in Atlanta
| Characteristic | Without Mortgage | With Mortgage |
| Housing Units | 705 | 626 |
| Median Property Value | $142,500 | $155,400 |
| Median Household Income | $71,027 | $75 |
| Monthly Housing Costs | $552 | $29 |
| Real Estate Taxes | $1,934 | $30 |
Property Value by Mortgage Status in Atlanta
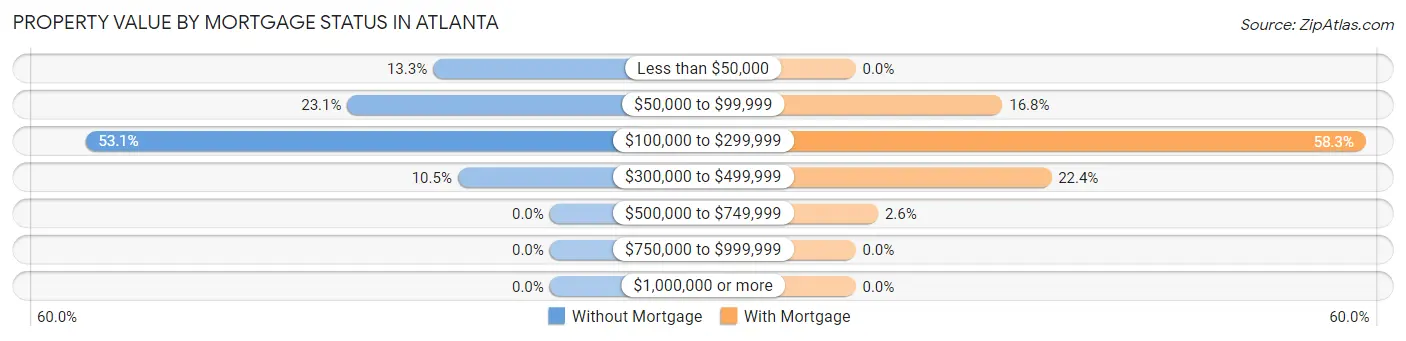
| Property Value | Without Mortgage | With Mortgage |
| Less than $50,000 | 94 (13.3%) | 0 (0.0%) |
| $50,000 to $99,999 | 163 (23.1%) | 105 (16.8%) |
| $100,000 to $299,999 | 374 (53.0%) | 365 (58.3%) |
| $300,000 to $499,999 | 74 (10.5%) | 140 (22.4%) |
| $500,000 to $749,999 | 0 (0.0%) | 16 (2.6%) |
| $750,000 to $999,999 | 0 (0.0%) | 0 (0.0%) |
| $1,000,000 or more | 0 (0.0%) | 0 (0.0%) |
| Total | 705 (100.0%) | 626 (100.0%) |
Household Income by Mortgage Status in Atlanta
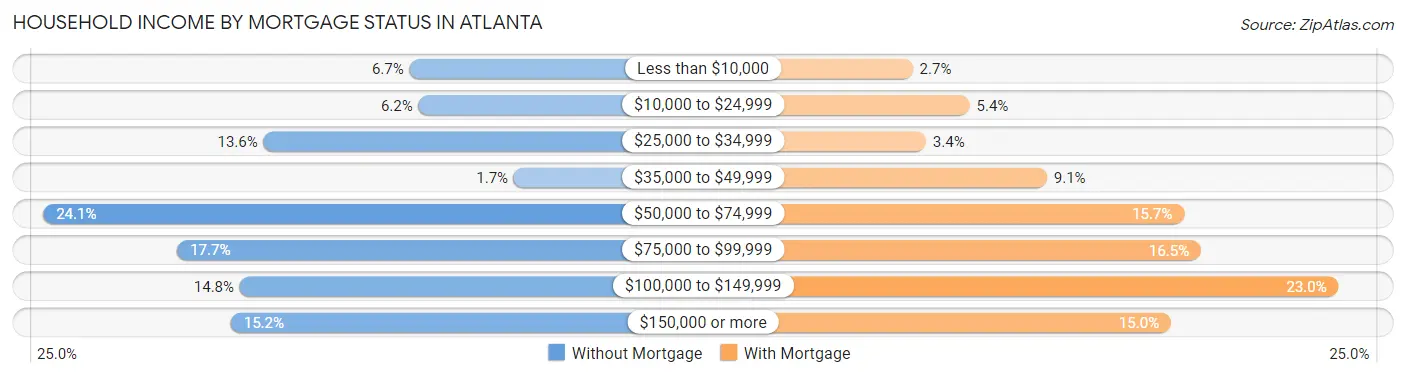
| Household Income | Without Mortgage | With Mortgage |
| Less than $10,000 | 47 (6.7%) | 17 (2.7%) |
| $10,000 to $24,999 | 44 (6.2%) | 34 (5.4%) |
| $25,000 to $34,999 | 96 (13.6%) | 21 (3.4%) |
| $35,000 to $49,999 | 12 (1.7%) | 57 (9.1%) |
| $50,000 to $74,999 | 170 (24.1%) | 98 (15.7%) |
| $75,000 to $99,999 | 125 (17.7%) | 103 (16.5%) |
| $100,000 to $149,999 | 104 (14.7%) | 144 (23.0%) |
| $150,000 or more | 107 (15.2%) | 94 (15.0%) |
| Total | 705 (100.0%) | 626 (100.0%) |
Property Value to Household Income Ratio in Atlanta
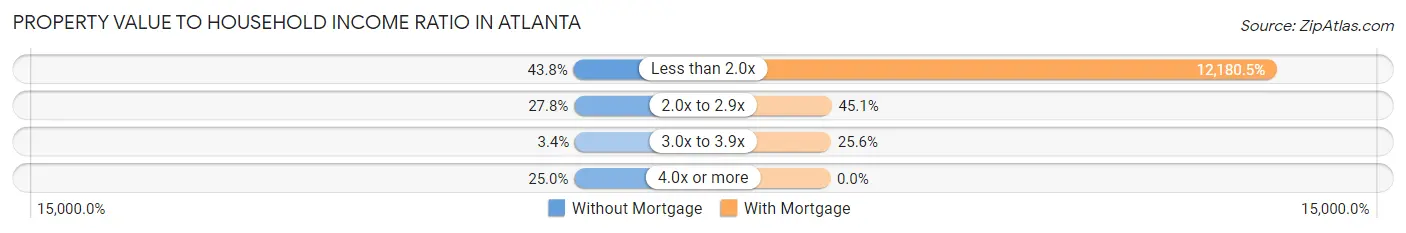
| Value-to-Income Ratio | Without Mortgage | With Mortgage |
| Less than 2.0x | 309 (43.8%) | 76,250 (12,180.5%) |
| 2.0x to 2.9x | 196 (27.8%) | 282 (45.1%) |
| 3.0x to 3.9x | 24 (3.4%) | 160 (25.6%) |
| 4.0x or more | 176 (25.0%) | 0 (0.0%) |
| Total | 705 (100.0%) | 626 (100.0%) |
Real Estate Taxes by Mortgage Status in Atlanta
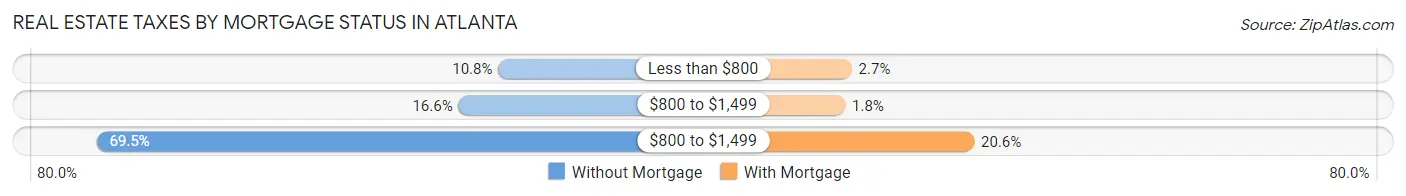
| Property Taxes | Without Mortgage | With Mortgage |
| Less than $800 | 76 (10.8%) | 17 (2.7%) |
| $800 to $1,499 | 117 (16.6%) | 11 (1.8%) |
| $800 to $1,499 | 490 (69.5%) | 129 (20.6%) |
| Total | 705 (100.0%) | 626 (100.0%) |
Health & Disability in Atlanta
Health Insurance Coverage by Age in Atlanta
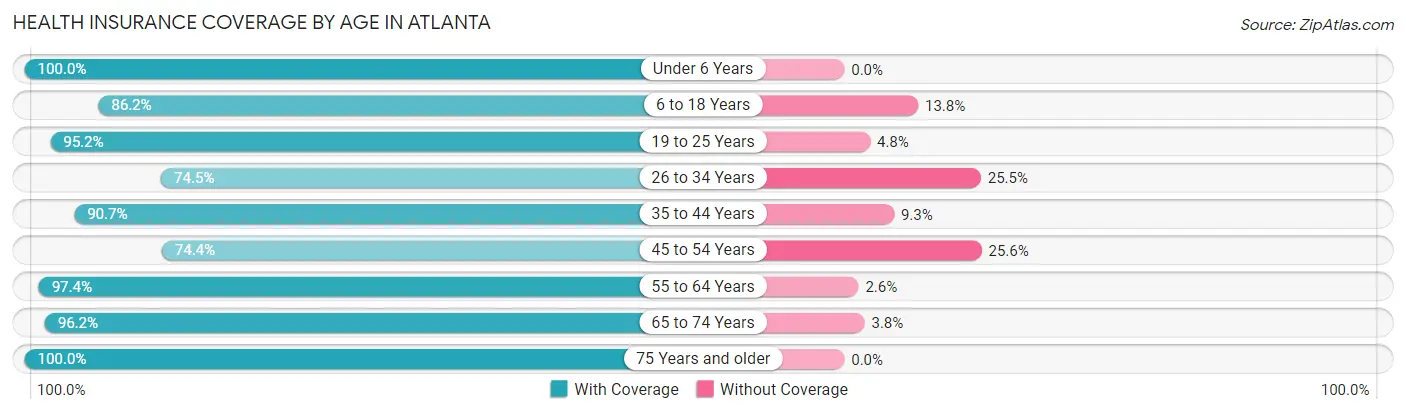
| Age Bracket | With Coverage | Without Coverage |
| Under 6 Years | 305 (100.0%) | 0 (0.0%) |
| 6 to 18 Years | 846 (86.2%) | 135 (13.8%) |
| 19 to 25 Years | 317 (95.2%) | 16 (4.8%) |
| 26 to 34 Years | 527 (74.5%) | 180 (25.5%) |
| 35 to 44 Years | 431 (90.7%) | 44 (9.3%) |
| 45 to 54 Years | 741 (74.4%) | 255 (25.6%) |
| 55 to 64 Years | 591 (97.4%) | 16 (2.6%) |
| 65 to 74 Years | 357 (96.2%) | 14 (3.8%) |
| 75 Years and older | 525 (100.0%) | 0 (0.0%) |
| Total | 4,640 (87.5%) | 660 (12.4%) |
Health Insurance Coverage by Citizenship Status in Atlanta
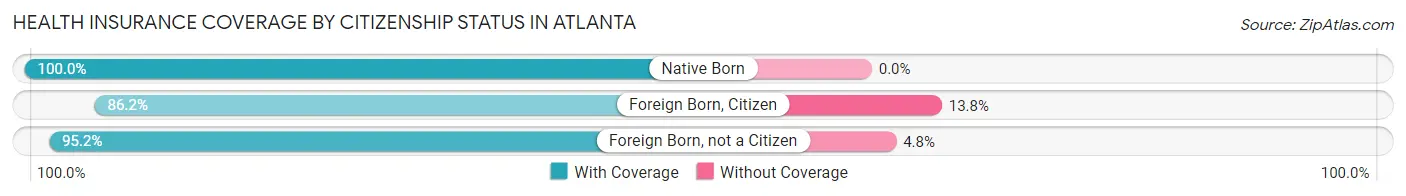
| Citizenship Status | With Coverage | Without Coverage |
| Native Born | 305 (100.0%) | 0 (0.0%) |
| Foreign Born, Citizen | 846 (86.2%) | 135 (13.8%) |
| Foreign Born, not a Citizen | 317 (95.2%) | 16 (4.8%) |
Health Insurance Coverage by Household Income in Atlanta
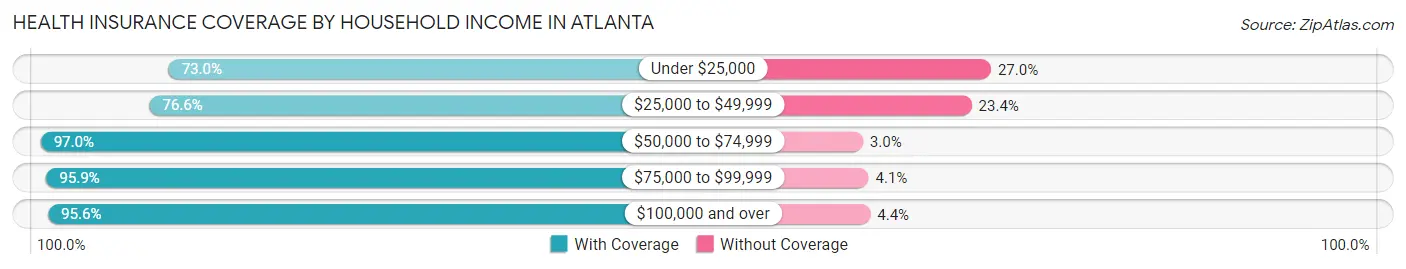
| Household Income | With Coverage | Without Coverage |
| Under $25,000 | 762 (73.0%) | 282 (27.0%) |
| $25,000 to $49,999 | 822 (76.6%) | 251 (23.4%) |
| $50,000 to $74,999 | 963 (97.0%) | 30 (3.0%) |
| $75,000 to $99,999 | 633 (95.9%) | 27 (4.1%) |
| $100,000 and over | 1,449 (95.6%) | 67 (4.4%) |
Public vs Private Health Insurance Coverage by Age in Atlanta
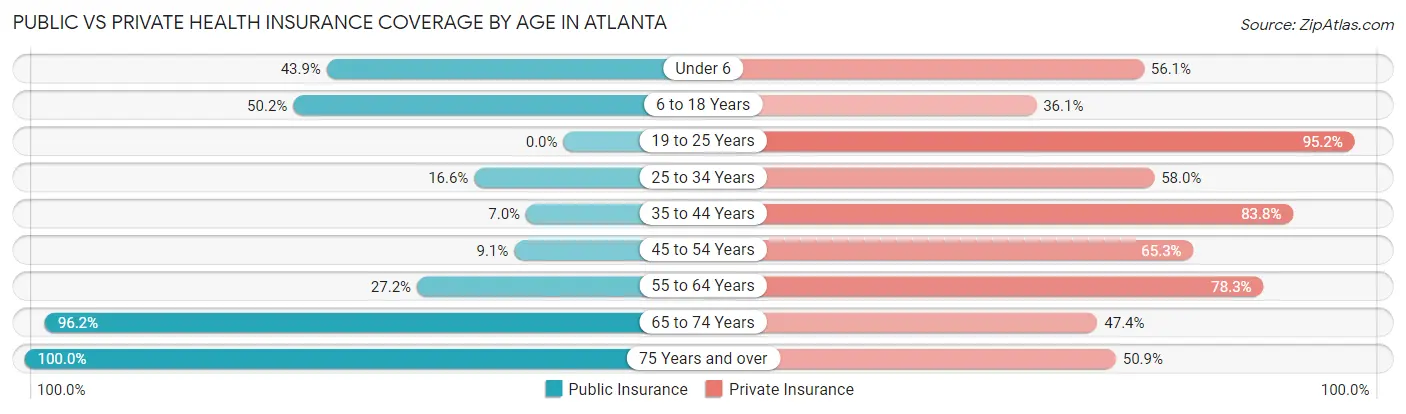
| Age Bracket | Public Insurance | Private Insurance |
| Under 6 | 134 (43.9%) | 171 (56.1%) |
| 6 to 18 Years | 492 (50.1%) | 354 (36.1%) |
| 19 to 25 Years | 0 (0.0%) | 317 (95.2%) |
| 25 to 34 Years | 117 (16.6%) | 410 (58.0%) |
| 35 to 44 Years | 33 (7.0%) | 398 (83.8%) |
| 45 to 54 Years | 91 (9.1%) | 650 (65.3%) |
| 55 to 64 Years | 165 (27.2%) | 475 (78.2%) |
| 65 to 74 Years | 357 (96.2%) | 176 (47.4%) |
| 75 Years and over | 525 (100.0%) | 267 (50.9%) |
| Total | 1,914 (36.1%) | 3,218 (60.7%) |
Disability Status by Sex by Age in Atlanta
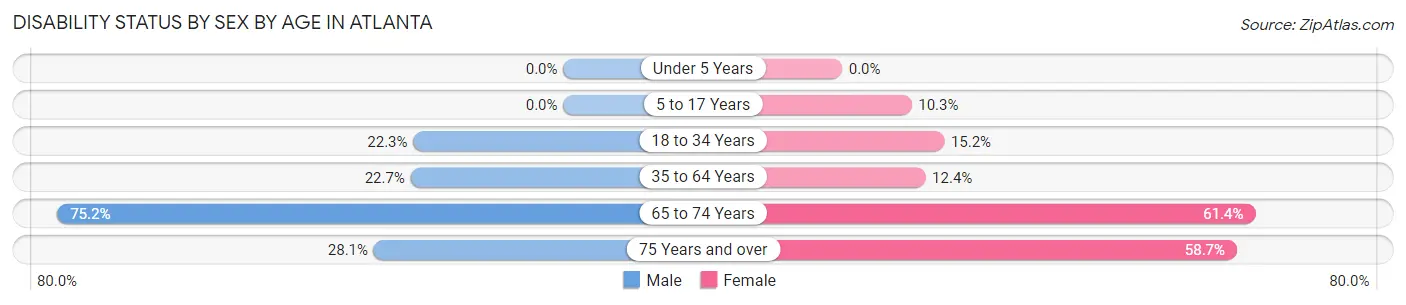
| Age Bracket | Male | Female |
| Under 5 Years | 0 (0.0%) | 0 (0.0%) |
| 5 to 17 Years | 0 (0.0%) | 51 (10.3%) |
| 18 to 34 Years | 161 (22.3%) | 59 (15.2%) |
| 35 to 64 Years | 202 (22.7%) | 147 (12.4%) |
| 65 to 74 Years | 127 (75.1%) | 124 (61.4%) |
| 75 Years and over | 47 (28.1%) | 210 (58.7%) |
Disability Class by Sex by Age in Atlanta
Disability Class: Hearing Difficulty
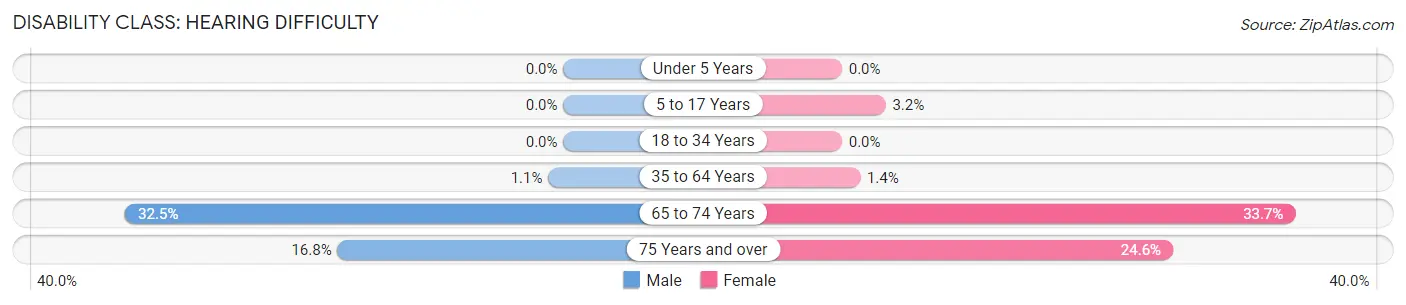
| Age Bracket | Male | Female |
| Under 5 Years | 0 (0.0%) | 0 (0.0%) |
| 5 to 17 Years | 0 (0.0%) | 16 (3.2%) |
| 18 to 34 Years | 0 (0.0%) | 0 (0.0%) |
| 35 to 64 Years | 10 (1.1%) | 16 (1.3%) |
| 65 to 74 Years | 55 (32.5%) | 68 (33.7%) |
| 75 Years and over | 28 (16.8%) | 88 (24.6%) |
Disability Class: Vision Difficulty
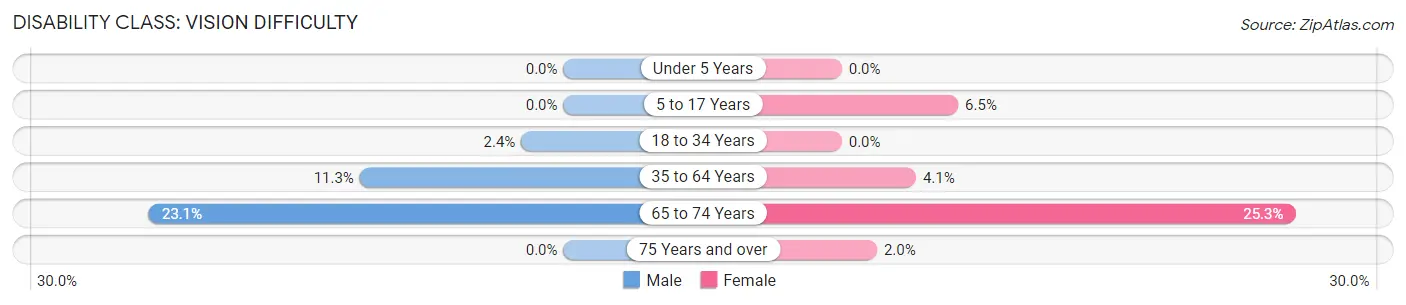
| Age Bracket | Male | Female |
| Under 5 Years | 0 (0.0%) | 0 (0.0%) |
| 5 to 17 Years | 0 (0.0%) | 32 (6.5%) |
| 18 to 34 Years | 17 (2.4%) | 0 (0.0%) |
| 35 to 64 Years | 101 (11.3%) | 49 (4.1%) |
| 65 to 74 Years | 39 (23.1%) | 51 (25.3%) |
| 75 Years and over | 0 (0.0%) | 7 (2.0%) |
Disability Class: Cognitive Difficulty
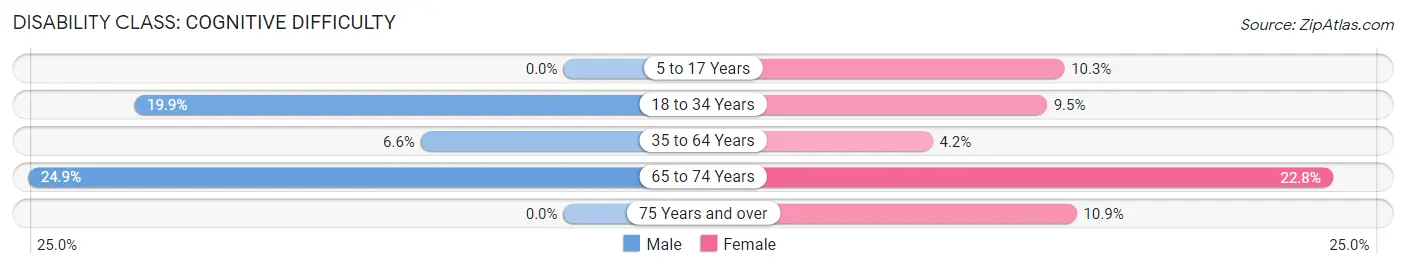
| Age Bracket | Male | Female |
| 5 to 17 Years | 0 (0.0%) | 51 (10.3%) |
| 18 to 34 Years | 144 (19.9%) | 37 (9.5%) |
| 35 to 64 Years | 59 (6.6%) | 50 (4.2%) |
| 65 to 74 Years | 42 (24.8%) | 46 (22.8%) |
| 75 Years and over | 0 (0.0%) | 39 (10.9%) |
Disability Class: Ambulatory Difficulty
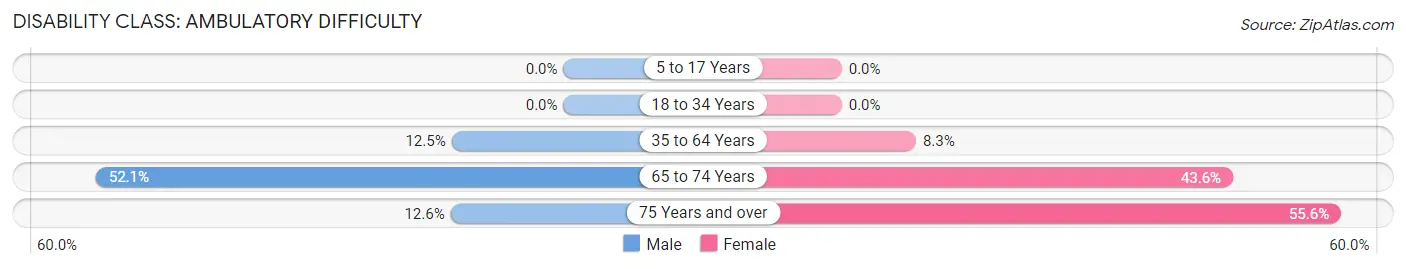
| Age Bracket | Male | Female |
| 5 to 17 Years | 0 (0.0%) | 0 (0.0%) |
| 18 to 34 Years | 0 (0.0%) | 0 (0.0%) |
| 35 to 64 Years | 111 (12.5%) | 98 (8.3%) |
| 65 to 74 Years | 88 (52.1%) | 88 (43.6%) |
| 75 Years and over | 21 (12.6%) | 199 (55.6%) |
Disability Class: Self-Care Difficulty
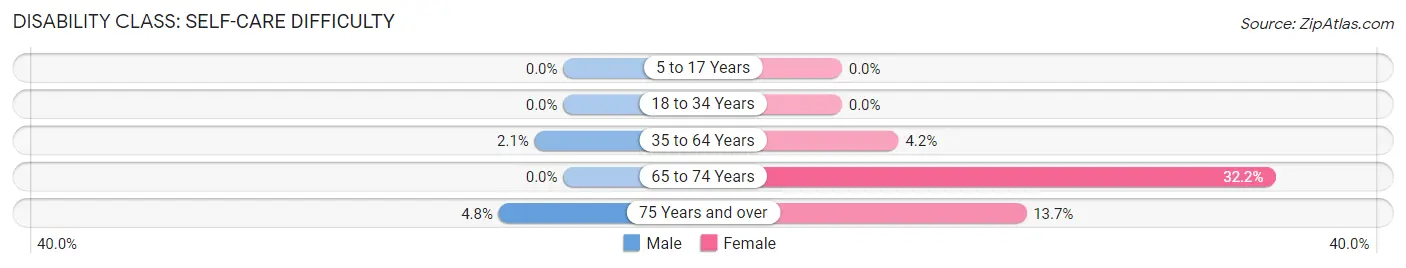
| Age Bracket | Male | Female |
| 5 to 17 Years | 0 (0.0%) | 0 (0.0%) |
| 18 to 34 Years | 0 (0.0%) | 0 (0.0%) |
| 35 to 64 Years | 19 (2.1%) | 50 (4.2%) |
| 65 to 74 Years | 0 (0.0%) | 65 (32.2%) |
| 75 Years and over | 8 (4.8%) | 49 (13.7%) |
Technology Access in Atlanta
Computing Device Access in Atlanta
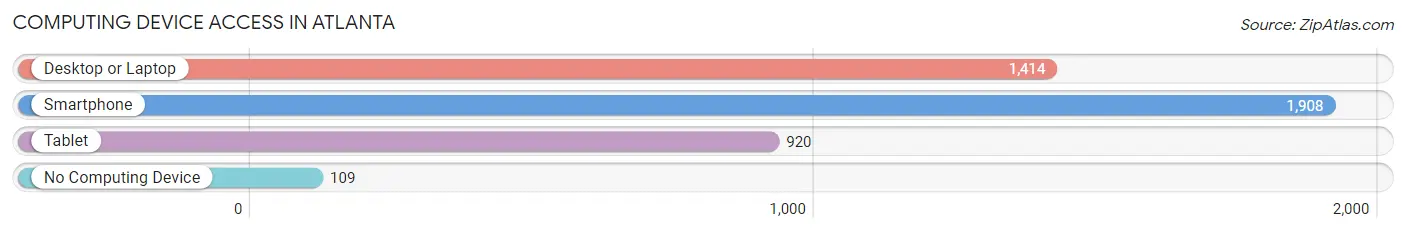
| Device Type | # Households | % Households |
| Desktop or Laptop | 1,414 | 69.6% |
| Smartphone | 1,908 | 93.9% |
| Tablet | 920 | 45.3% |
| No Computing Device | 109 | 5.4% |
| Total | 2,033 | 100.0% |
Internet Access in Atlanta
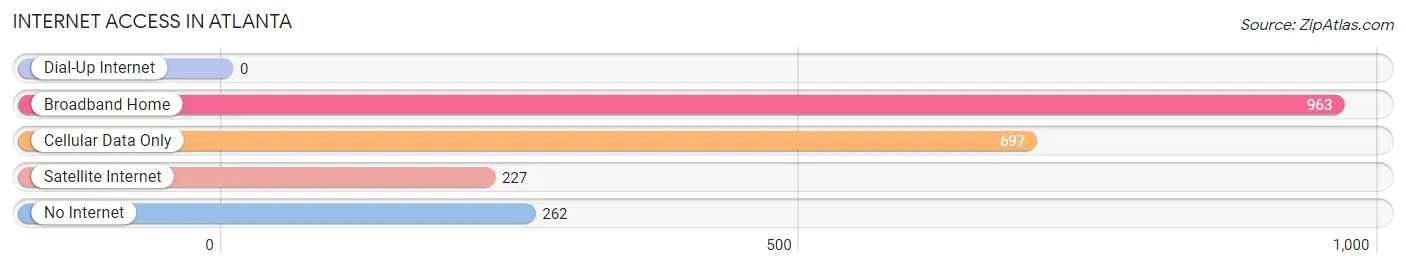
| Internet Type | # Households | % Households |
| Dial-Up Internet | 0 | 0.0% |
| Broadband Home | 963 | 47.4% |
| Cellular Data Only | 697 | 34.3% |
| Satellite Internet | 227 | 11.2% |
| No Internet | 262 | 12.9% |
| Total | 2,033 | 100.0% |
Atlanta Summary
Atlanta, Texas is a small city located in the northeastern corner of the state, in Cass County. It is situated on the banks of the Sulphur River, and is the county seat of Cass County. The city is home to a population of approximately 2,000 people, and is part of the Texarkana metropolitan area.
History
The area that is now Atlanta, Texas was first settled in the early 1840s by a group of settlers from Arkansas. The settlement was originally known as “Crow’s Nest”, and was located on the banks of the Sulphur River. In 1846, the settlement was renamed “Atlanta”, after the city in Georgia.
In 1871, the Texas and Pacific Railway was built through the area, and the town of Atlanta was officially incorporated in 1873. The town quickly grew, and by 1880, the population had grown to over 1,000 people.
In the early 1900s, the town was a major center for the timber industry, and the local economy was largely based on the production of lumber. The town also had a thriving cotton industry, and was home to several cotton gins.
In the late 1940s, the town began to decline, as the timber industry began to move away from the area. The population of the town began to decline, and by the 1970s, the population had dropped to just over 1,000 people.
Geography
Atlanta, Texas is located in the northeastern corner of the state, in Cass County. It is situated on the banks of the Sulphur River, and is the county seat of Cass County. The city is located approximately 30 miles south of Texarkana, and is part of the Texarkana metropolitan area.
The city has a total area of 2.2 square miles, all of which is land. The terrain of the area is mostly flat, with some rolling hills. The climate of the area is humid subtropical, with hot summers and mild winters.
Economy
The economy of Atlanta, Texas is largely based on agriculture and manufacturing. The city is home to several manufacturing plants, including a paper mill, a plastics plant, and a furniture factory. The city is also home to several agricultural operations, including cattle ranches, poultry farms, and cotton farms.
The city is also home to several retail stores, restaurants, and other businesses. The city is served by the Atlanta Independent School District, and is home to several churches and other religious organizations.
Demographics
As of the 2010 census, the population of Atlanta, Texas was 2,000 people. The racial makeup of the city was 79.2% White, 17.2% African American, 0.7% Native American, 0.3% Asian, 0.1% Pacific Islander, and 2.5% from other races. Hispanic or Latino of any race were 4.2% of the population.
The median household income in the city was $30,000, and the median family income was $35,000. The per capita income in the city was $15,000. About 17.2% of the population was below the poverty line.
Common Questions
What is Per Capita Income in Atlanta?
Per Capita income in Atlanta is $32,155.
What is the Median Family Income in Atlanta?
Median Family Income in Atlanta is $70,417.
What is the Median Household income in Atlanta?
Median Household Income in Atlanta is $62,215.
What is Income or Wage Gap in Atlanta?
Income or Wage Gap in Atlanta is 0.7%.
Women in Atlanta earn 99.3 cents for every dollar earned by a man.
What is Inequality or Gini Index in Atlanta?
Inequality or Gini Index in Atlanta is 0.50.
What is the Total Population of Atlanta?
Total Population of Atlanta is 5,453.
What is the Total Male Population of Atlanta?
Total Male Population of Atlanta is 2,703.
What is the Total Female Population of Atlanta?
Total Female Population of Atlanta is 2,750.
What is the Ratio of Males per 100 Females in Atlanta?
There are 98.29 Males per 100 Females in Atlanta.
What is the Ratio of Females per 100 Males in Atlanta?
There are 101.74 Females per 100 Males in Atlanta.
What is the Median Population Age in Atlanta?
Median Population Age in Atlanta is 40.1 Years.
What is the Average Family Size in Atlanta
Average Family Size in Atlanta is 3.3 People.
What is the Average Household Size in Atlanta
Average Household Size in Atlanta is 2.6 People.
How Large is the Labor Force in Atlanta?
There are 2,550 People in the Labor Forcein in Atlanta.
What is the Percentage of People in the Labor Force in Atlanta?
58.6% of People are in the Labor Force in Atlanta.
What is the Unemployment Rate in Atlanta?
Unemployment Rate in Atlanta is 7.6%.