Archer City, TX Map & Demographics
Archer City Map
Archer City Overview
$27,096
PER CAPITA INCOME
$71,250
AVG FAMILY INCOME
$40,714
AVG HOUSEHOLD INCOME
59.7%
WAGE / INCOME GAP [ % ]
40.3¢/ $1
WAGE / INCOME GAP [ $ ]
0.44
INEQUALITY / GINI INDEX
1,549
TOTAL POPULATION
741
MALE POPULATION
808
FEMALE POPULATION
91.71
MALES / 100 FEMALES
109.04
FEMALES / 100 MALES
42.1
MEDIAN AGE
3.3
AVG FAMILY SIZE
2.4
AVG HOUSEHOLD SIZE
624
LABOR FORCE [ PEOPLE ]
51.6%
PERCENT IN LABOR FORCE
Archer City Zip Codes
Archer City Area Codes
Income in Archer City
Income Overview in Archer City
Per Capita Income in Archer City is $27,096, while median incomes of families and households are $71,250 and $40,714 respectively.
| Characteristic | Number | Measure |
| Per Capita Income | 1,549 | $27,096 |
| Median Family Income | 358 | $71,250 |
| Mean Family Income | 358 | $76,383 |
| Median Household Income | 632 | $40,714 |
| Mean Household Income | 632 | $63,817 |
| Income Deficit | 358 | $0 |
| Wage / Income Gap (%) | 1,549 | 59.66% |
| Wage / Income Gap ($) | 1,549 | 40.34¢ per $1 |
| Gini / Inequality Index | 1,549 | 0.44 |
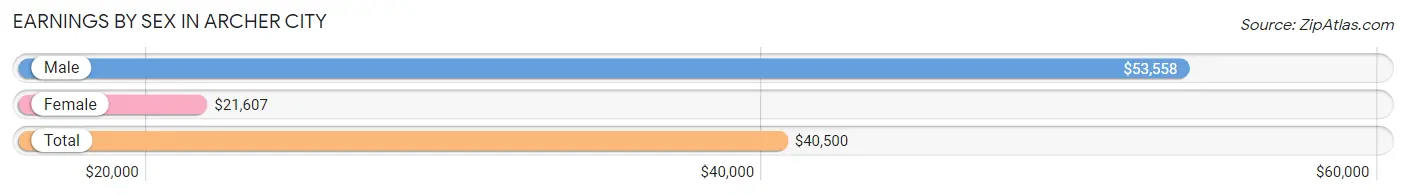
Earnings by Sex in Archer City
Average Earnings in Archer City are $40,500, $53,558 for men and $21,607 for women, a difference of 59.7%.
| Sex | Number | Average Earnings |
| Male | 343 (49.7%) | $53,558 |
| Female | 347 (50.3%) | $21,607 |
| Total | 690 (100.0%) | $40,500 |
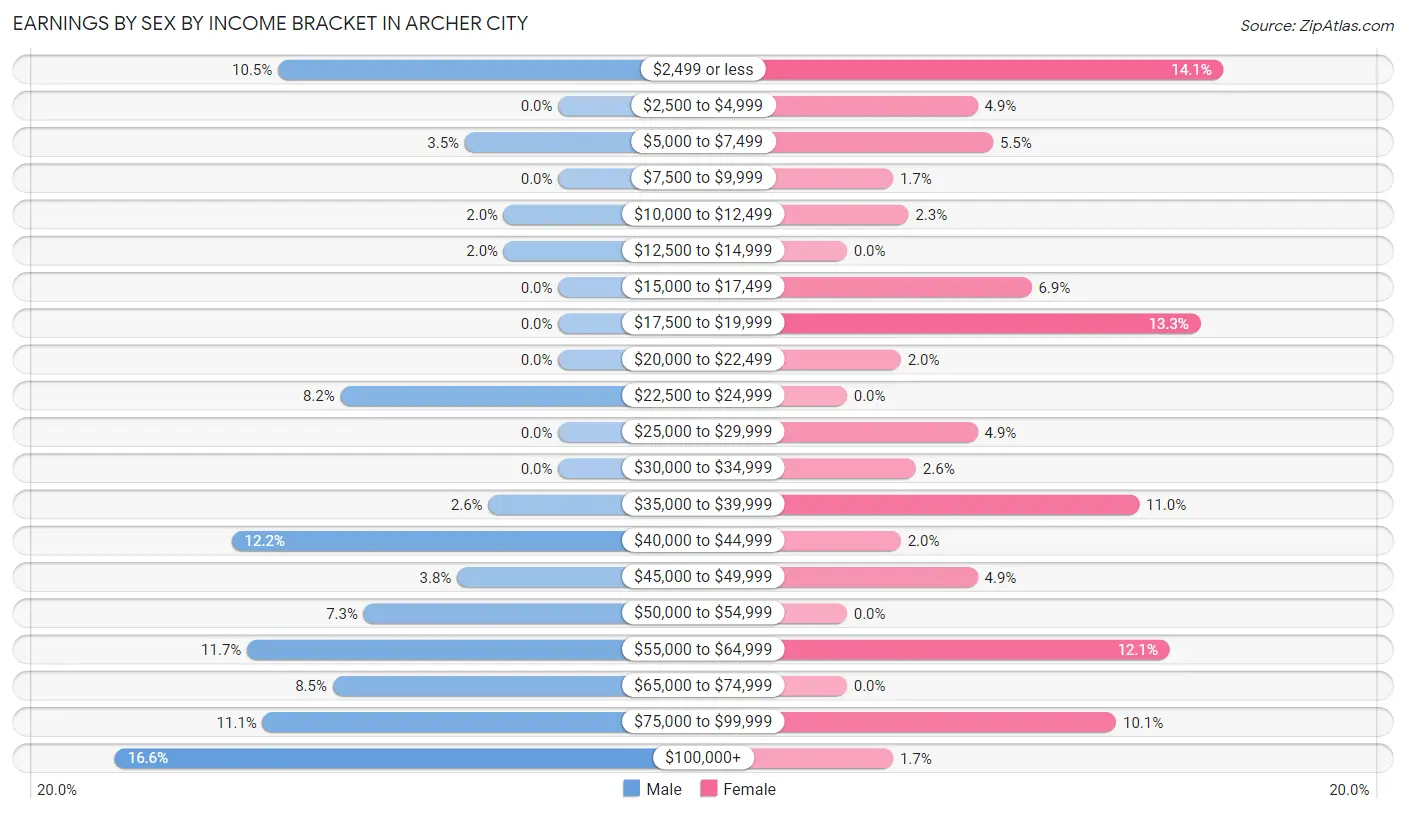
Earnings by Sex by Income Bracket in Archer City
The most common earnings brackets in Archer City are $100,000+ for men (57 | 16.6%) and $2,499 or less for women (49 | 14.1%).
| Income | Male | Female |
| $2,499 or less | 36 (10.5%) | 49 (14.1%) |
| $2,500 to $4,999 | 0 (0.0%) | 17 (4.9%) |
| $5,000 to $7,499 | 12 (3.5%) | 19 (5.5%) |
| $7,500 to $9,999 | 0 (0.0%) | 6 (1.7%) |
| $10,000 to $12,499 | 7 (2.0%) | 8 (2.3%) |
| $12,500 to $14,999 | 7 (2.0%) | 0 (0.0%) |
| $15,000 to $17,499 | 0 (0.0%) | 24 (6.9%) |
| $17,500 to $19,999 | 0 (0.0%) | 46 (13.3%) |
| $20,000 to $22,499 | 0 (0.0%) | 7 (2.0%) |
| $22,500 to $24,999 | 28 (8.2%) | 0 (0.0%) |
| $25,000 to $29,999 | 0 (0.0%) | 17 (4.9%) |
| $30,000 to $34,999 | 0 (0.0%) | 9 (2.6%) |
| $35,000 to $39,999 | 9 (2.6%) | 38 (11.0%) |
| $40,000 to $44,999 | 42 (12.2%) | 7 (2.0%) |
| $45,000 to $49,999 | 13 (3.8%) | 17 (4.9%) |
| $50,000 to $54,999 | 25 (7.3%) | 0 (0.0%) |
| $55,000 to $64,999 | 40 (11.7%) | 42 (12.1%) |
| $65,000 to $74,999 | 29 (8.5%) | 0 (0.0%) |
| $75,000 to $99,999 | 38 (11.1%) | 35 (10.1%) |
| $100,000+ | 57 (16.6%) | 6 (1.7%) |
| Total | 343 (100.0%) | 347 (100.0%) |
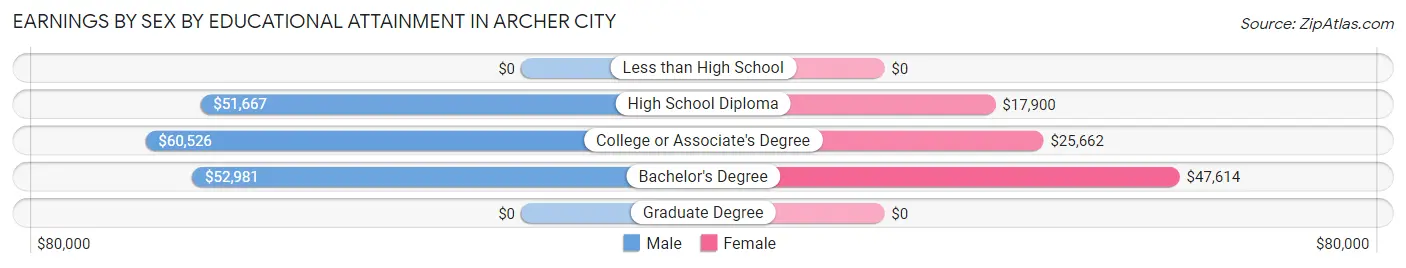
Earnings by Sex by Educational Attainment in Archer City
Average earnings in Archer City are $60,750 for men and $25,294 for women, a difference of 58.4%. Men with an educational attainment of college or associate's degree enjoy the highest average annual earnings of $60,526, while those with high school diploma education earn the least with $51,667. Women with an educational attainment of bachelor's degree earn the most with the average annual earnings of $47,614, while those with high school diploma education have the smallest earnings of $17,900.
| Educational Attainment | Male Income | Female Income |
| Less than High School | - | - |
| High School Diploma | $51,667 | $17,900 |
| College or Associate's Degree | $60,526 | $25,662 |
| Bachelor's Degree | $52,981 | $47,614 |
| Graduate Degree | - | - |
| Total | $60,750 | $25,294 |
Family Income in Archer City
Family Income Brackets in Archer City
According to the Archer City family income data, there are 88 families falling into the $100,000 to $149,999 income range, which is the most common income bracket and makes up 24.6% of all families. Conversely, the $200,000+ income bracket is the least frequent group with only 13 families (3.6%) belonging to this category.
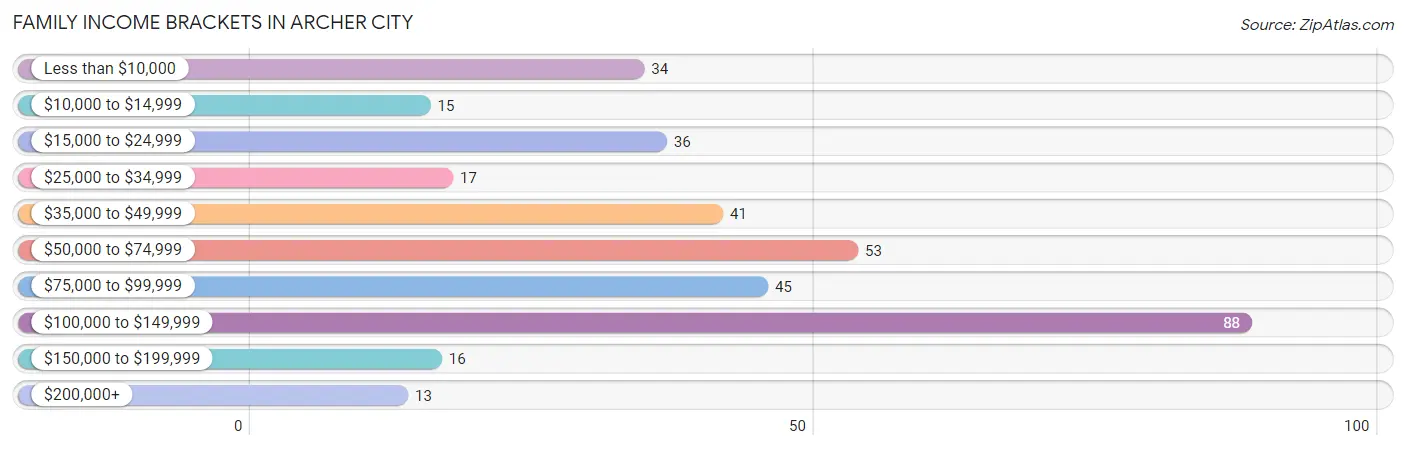
| Income Bracket | # Families | % Families |
| Less than $10,000 | 34 | 9.5% |
| $10,000 to $14,999 | 15 | 4.2% |
| $15,000 to $24,999 | 36 | 10.1% |
| $25,000 to $34,999 | 17 | 4.7% |
| $35,000 to $49,999 | 41 | 11.5% |
| $50,000 to $74,999 | 53 | 14.8% |
| $75,000 to $99,999 | 45 | 12.6% |
| $100,000 to $149,999 | 88 | 24.6% |
| $150,000 to $199,999 | 16 | 4.5% |
| $200,000+ | 13 | 3.6% |
Family Income by Famaliy Size in Archer City
3-person families (111 | 31.0%) account for the highest median family income in Archer City with $75,972 per family, while 2-person families (157 | 43.9%) have the highest median income of $37,292 per family member.
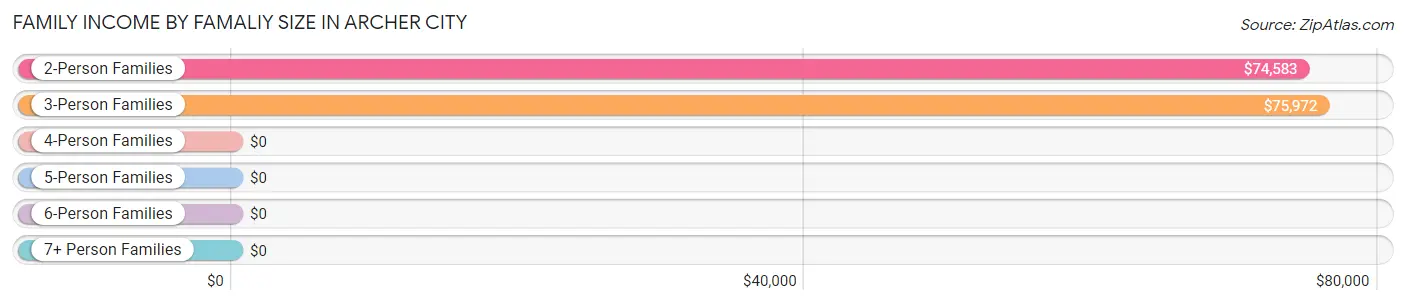
| Income Bracket | # Families | Median Income |
| 2-Person Families | 157 (43.9%) | $74,583 |
| 3-Person Families | 111 (31.0%) | $75,972 |
| 4-Person Families | 53 (14.8%) | $0 |
| 5-Person Families | 0 (0.0%) | $0 |
| 6-Person Families | 16 (4.5%) | $0 |
| 7+ Person Families | 21 (5.9%) | $0 |
| Total | 358 (100.0%) | $71,250 |
Family Income by Number of Earners in Archer City
The median family income in Archer City is $71,250, with families comprising 2 earners (122) having the highest median family income of $106,000, while families with no earners (95) have the lowest median family income of $35,398, accounting for 34.1% and 26.5% of families, respectively.
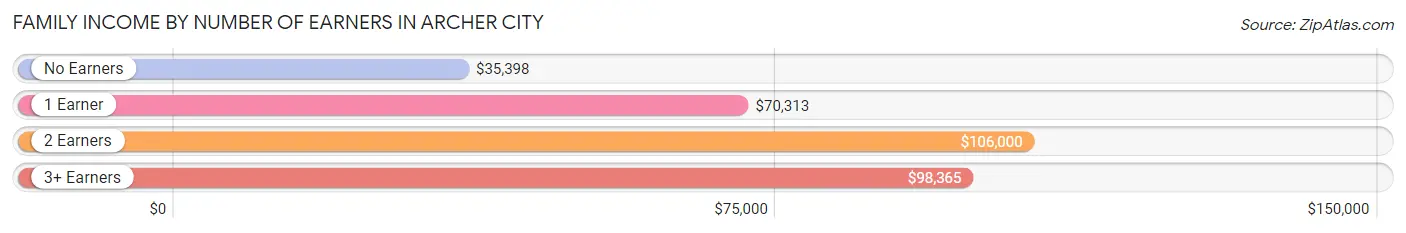
| Number of Earners | # Families | Median Income |
| No Earners | 95 (26.5%) | $35,398 |
| 1 Earner | 100 (27.9%) | $70,313 |
| 2 Earners | 122 (34.1%) | $106,000 |
| 3+ Earners | 41 (11.5%) | $98,365 |
| Total | 358 (100.0%) | $71,250 |
Household Income in Archer City
Household Income Brackets in Archer City
With 100 households falling in the category, the $25,000 to $34,999 income range is the most frequent in Archer City, accounting for 15.8% of all households. In contrast, only 13 households (2.1%) fall into the $200,000+ income bracket, making it the least populous group.
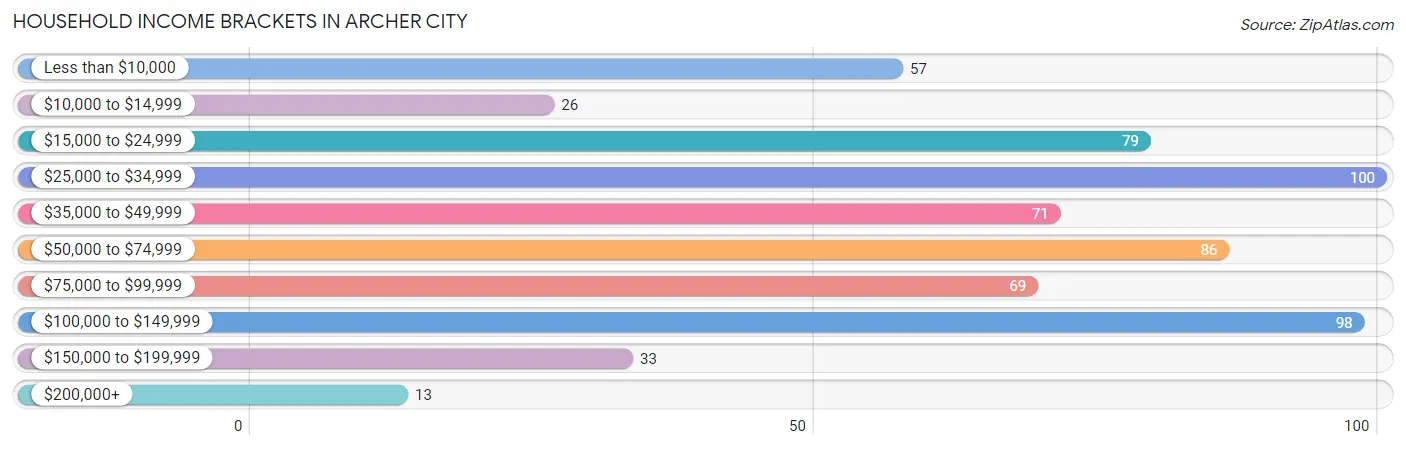
| Income Bracket | # Households | % Households |
| Less than $10,000 | 57 | 9.0% |
| $10,000 to $14,999 | 26 | 4.1% |
| $15,000 to $24,999 | 79 | 12.5% |
| $25,000 to $34,999 | 100 | 15.8% |
| $35,000 to $49,999 | 71 | 11.2% |
| $50,000 to $74,999 | 86 | 13.6% |
| $75,000 to $99,999 | 69 | 10.9% |
| $100,000 to $149,999 | 98 | 15.5% |
| $150,000 to $199,999 | 33 | 5.2% |
| $200,000+ | 13 | 2.1% |
Household Income by Householder Age in Archer City
The median household income in Archer City is $40,714, with the highest median household income of $73,839 found in the 45 to 64 years age bracket for the primary householder. A total of 283 households (44.8%) fall into this category. Meanwhile, the 15 to 24 years age bracket for the primary householder has the lowest median household income of $0, with 12 households (1.9%) in this group.
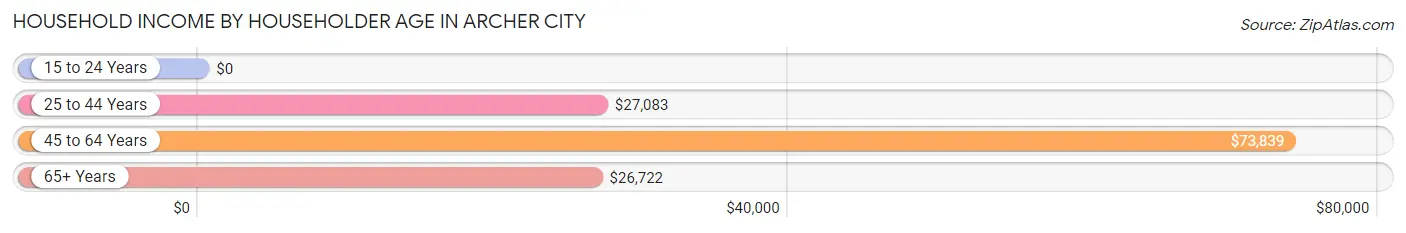
| Income Bracket | # Households | Median Income |
| 15 to 24 Years | 12 (1.9%) | $0 |
| 25 to 44 Years | 153 (24.2%) | $27,083 |
| 45 to 64 Years | 283 (44.8%) | $73,839 |
| 65+ Years | 184 (29.1%) | $26,722 |
| Total | 632 (100.0%) | $40,714 |
Poverty in Archer City
Income Below Poverty by Sex and Age in Archer City
With 25.3% poverty level for males and 24.0% for females among the residents of Archer City, 16 and 17 year old males and 15 year old females are the most vulnerable to poverty, with 55 males (68.8%) and 21 females (72.4%) in their respective age groups living below the poverty level.
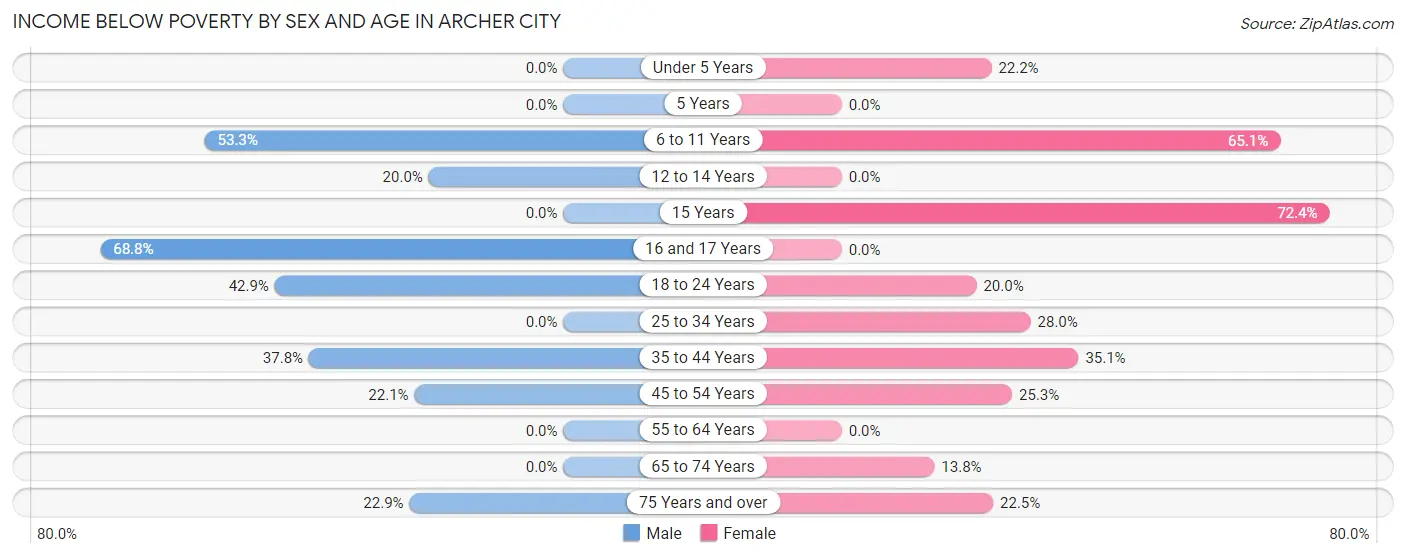
| Age Bracket | Male | Female |
| Under 5 Years | 0 (0.0%) | 8 (22.2%) |
| 5 Years | 0 (0.0%) | 0 (0.0%) |
| 6 to 11 Years | 49 (53.3%) | 41 (65.1%) |
| 12 to 14 Years | 6 (20.0%) | 0 (0.0%) |
| 15 Years | 0 (0.0%) | 21 (72.4%) |
| 16 and 17 Years | 55 (68.8%) | 0 (0.0%) |
| 18 to 24 Years | 21 (42.9%) | 9 (20.0%) |
| 25 to 34 Years | 0 (0.0%) | 30 (28.0%) |
| 35 to 44 Years | 17 (37.8%) | 26 (35.1%) |
| 45 to 54 Years | 23 (22.1%) | 22 (25.3%) |
| 55 to 64 Years | 0 (0.0%) | 0 (0.0%) |
| 65 to 74 Years | 0 (0.0%) | 11 (13.8%) |
| 75 Years and over | 8 (22.9%) | 20 (22.5%) |
| Total | 179 (25.3%) | 188 (24.0%) |
Income Above Poverty by Sex and Age in Archer City
According to the poverty statistics in Archer City, males aged under 5 years and females aged 5 years are the age groups that are most secure financially, with 100.0% of males and 100.0% of females in these age groups living above the poverty line.
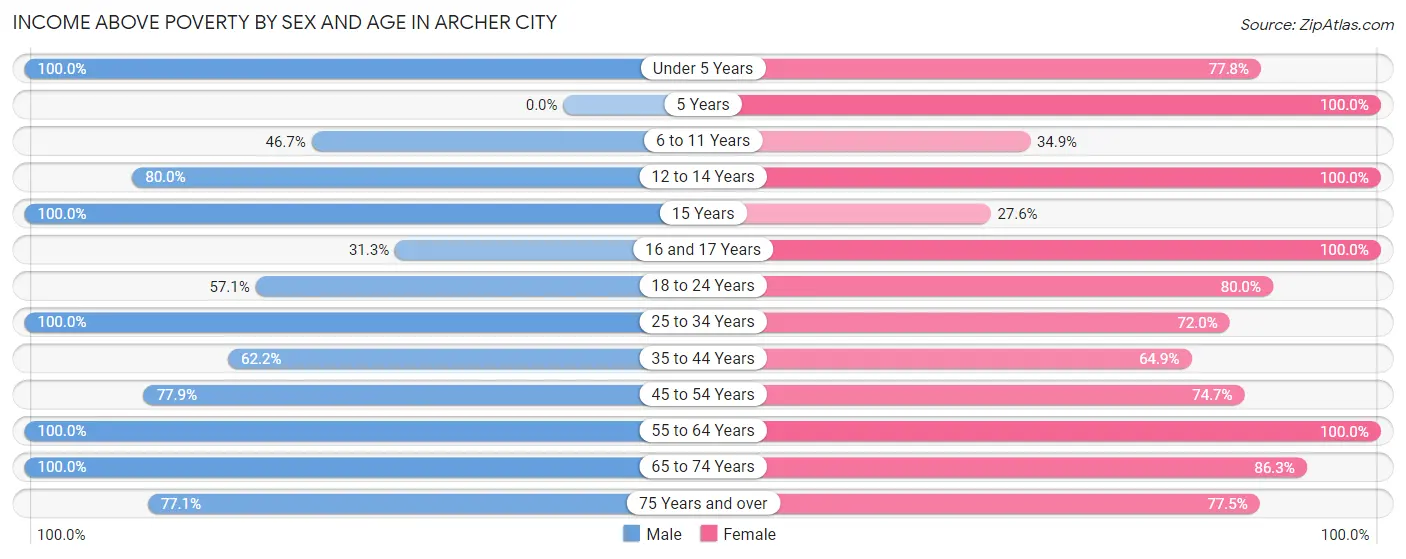
| Age Bracket | Male | Female |
| Under 5 Years | 44 (100.0%) | 28 (77.8%) |
| 5 Years | 0 (0.0%) | 11 (100.0%) |
| 6 to 11 Years | 43 (46.7%) | 22 (34.9%) |
| 12 to 14 Years | 24 (80.0%) | 11 (100.0%) |
| 15 Years | 8 (100.0%) | 8 (27.6%) |
| 16 and 17 Years | 25 (31.2%) | 6 (100.0%) |
| 18 to 24 Years | 28 (57.1%) | 36 (80.0%) |
| 25 to 34 Years | 65 (100.0%) | 77 (72.0%) |
| 35 to 44 Years | 28 (62.2%) | 48 (64.9%) |
| 45 to 54 Years | 81 (77.9%) | 65 (74.7%) |
| 55 to 64 Years | 86 (100.0%) | 144 (100.0%) |
| 65 to 74 Years | 69 (100.0%) | 69 (86.3%) |
| 75 Years and over | 27 (77.1%) | 69 (77.5%) |
| Total | 528 (74.7%) | 594 (76.0%) |
Income Below Poverty Among Married-Couple Families in Archer City
The poverty statistics for married-couple families in Archer City show that 9.3% or 25 of the total 270 families live below the poverty line. Families with 5 or more children have the highest poverty rate of 100.0%, comprising of 7 families. On the other hand, families with 1 or 2 children have the lowest poverty rate of 0.0%, which includes 0 families.
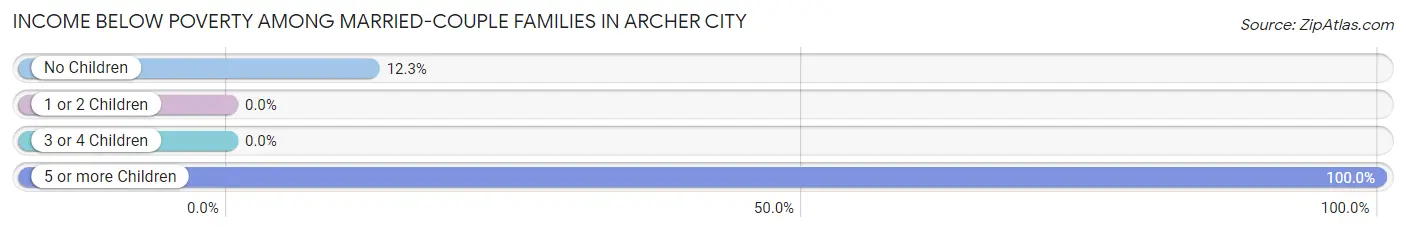
| Children | Above Poverty | Below Poverty |
| No Children | 128 (87.7%) | 18 (12.3%) |
| 1 or 2 Children | 101 (100.0%) | 0 (0.0%) |
| 3 or 4 Children | 16 (100.0%) | 0 (0.0%) |
| 5 or more Children | 0 (0.0%) | 7 (100.0%) |
| Total | 245 (90.7%) | 25 (9.3%) |
Income Below Poverty Among Single-Parent Households in Archer City
According to the poverty data in Archer City, 25.0% or 10 single-father households and 64.6% or 31 single-mother households are living below the poverty line. Among single-father households, those with 3 or 4 children have the highest poverty rate, with 10 households (100.0%) experiencing poverty. Likewise, among single-mother households, those with no children have the highest poverty rate, with 11 households (100.0%) falling below the poverty line.
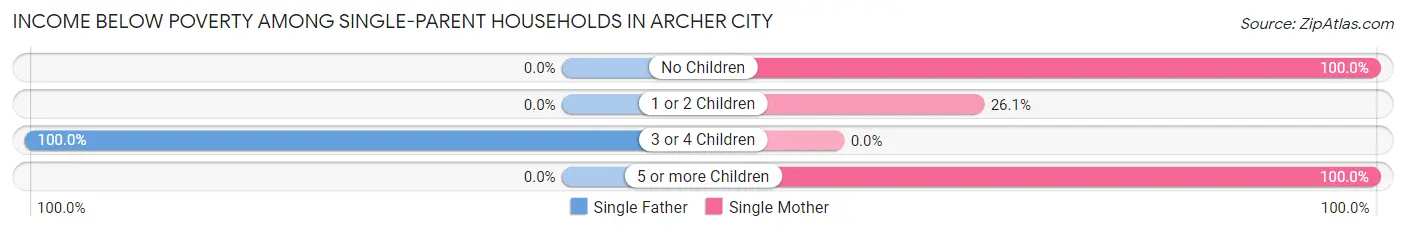
| Children | Single Father | Single Mother |
| No Children | 0 (0.0%) | 11 (100.0%) |
| 1 or 2 Children | 0 (0.0%) | 6 (26.1%) |
| 3 or 4 Children | 10 (100.0%) | 0 (0.0%) |
| 5 or more Children | 0 (0.0%) | 14 (100.0%) |
| Total | 10 (25.0%) | 31 (64.6%) |
Income Below Poverty Among Married-Couple vs Single-Parent Households in Archer City
The poverty data for Archer City shows that 25 of the married-couple family households (9.3%) and 41 of the single-parent households (46.6%) are living below the poverty level. Within the married-couple family households, those with 5 or more children have the highest poverty rate, with 7 households (100.0%) falling below the poverty line. Among the single-parent households, those with 3 or 4 children have the highest poverty rate, with 10 household (100.0%) living below poverty.
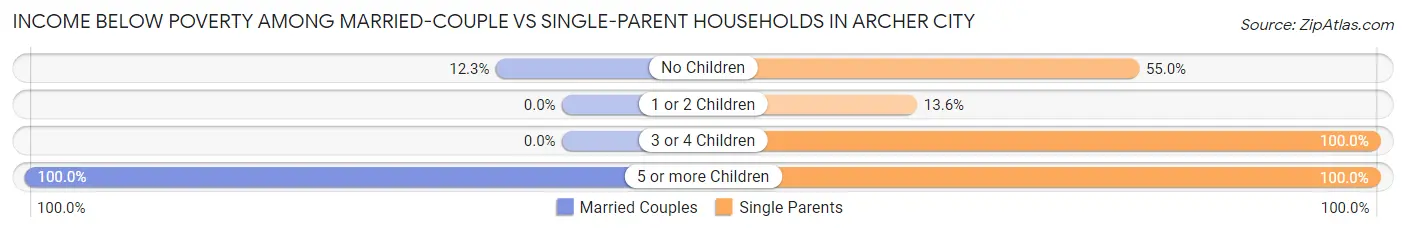
| Children | Married-Couple Families | Single-Parent Households |
| No Children | 18 (12.3%) | 11 (55.0%) |
| 1 or 2 Children | 0 (0.0%) | 6 (13.6%) |
| 3 or 4 Children | 0 (0.0%) | 10 (100.0%) |
| 5 or more Children | 7 (100.0%) | 14 (100.0%) |
| Total | 25 (9.3%) | 41 (46.6%) |
Race in Archer City
The most populous races in Archer City are White / Caucasian (1,406 | 90.8%), Two or more Races (127 | 8.2%), and Hispanic or Latino (110 | 7.1%).
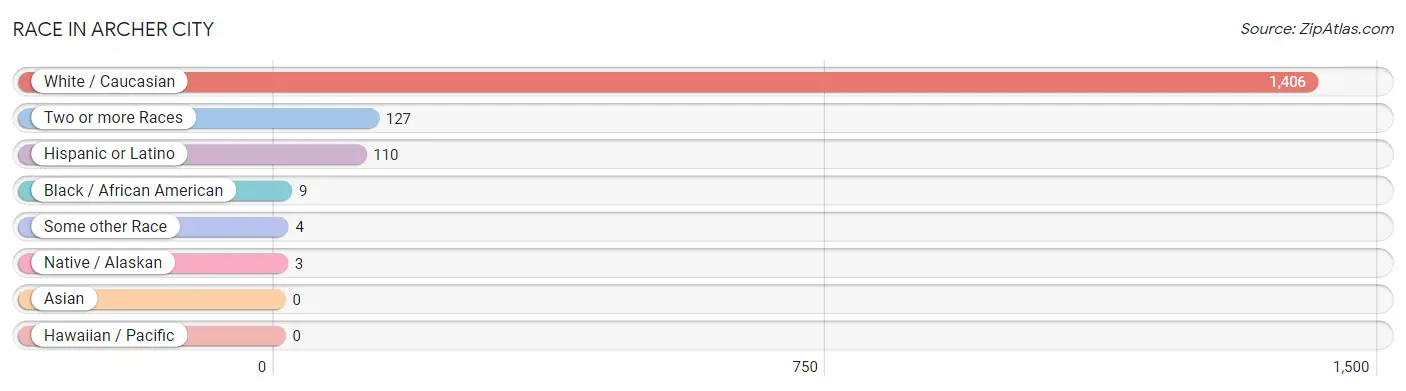
| Race | # Population | % Population |
| Asian | 0 | 0.0% |
| Black / African American | 9 | 0.6% |
| Hawaiian / Pacific | 0 | 0.0% |
| Hispanic or Latino | 110 | 7.1% |
| Native / Alaskan | 3 | 0.2% |
| White / Caucasian | 1,406 | 90.8% |
| Two or more Races | 127 | 8.2% |
| Some other Race | 4 | 0.3% |
| Total | 1,549 | 100.0% |
Ancestry in Archer City
The most populous ancestries reported in Archer City are German (163 | 10.5%), English (147 | 9.5%), Mexican (98 | 6.3%), Irish (70 | 4.5%), and Scottish (42 | 2.7%), together accounting for 33.6% of all Archer City residents.
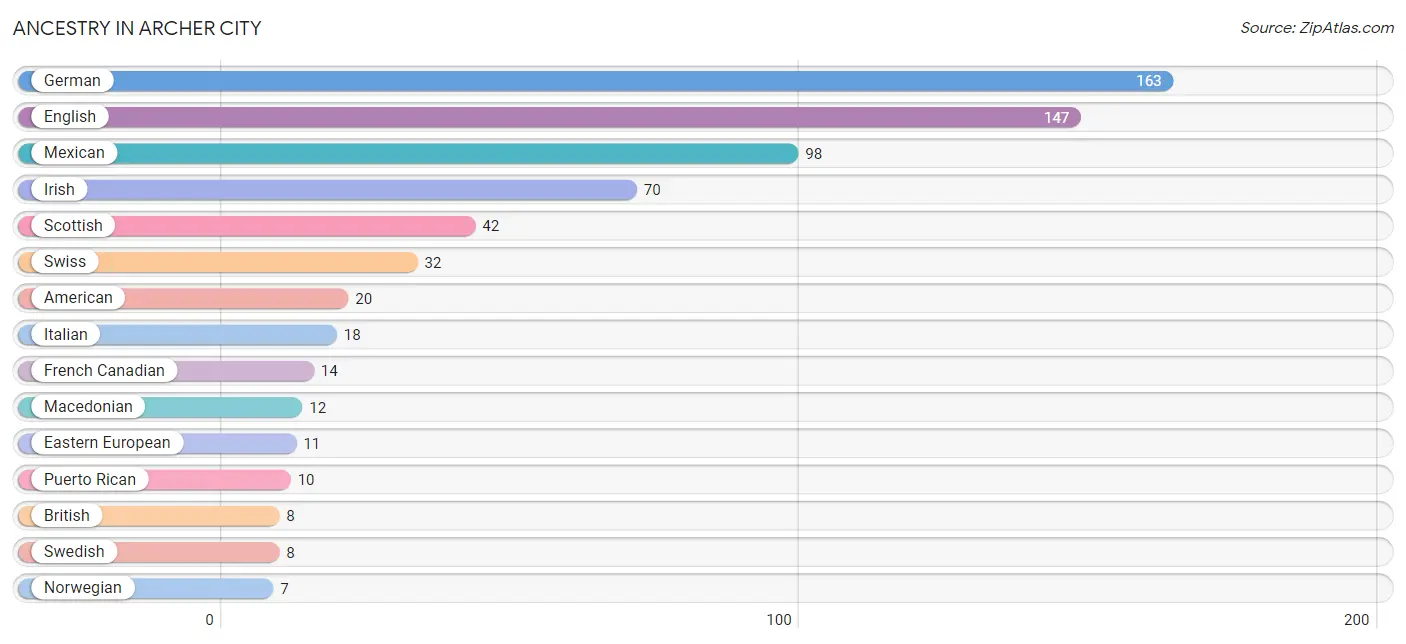
| Ancestry | # Population | % Population |
| American | 20 | 1.3% |
| British | 8 | 0.5% |
| Choctaw | 3 | 0.2% |
| Eastern European | 11 | 0.7% |
| English | 147 | 9.5% |
| French Canadian | 14 | 0.9% |
| German | 163 | 10.5% |
| Irish | 70 | 4.5% |
| Italian | 18 | 1.2% |
| Macedonian | 12 | 0.8% |
| Mexican | 98 | 6.3% |
| Norwegian | 7 | 0.4% |
| Puerto Rican | 10 | 0.6% |
| Scotch-Irish | 2 | 0.1% |
| Scottish | 42 | 2.7% |
| Swedish | 8 | 0.5% |
| Swiss | 32 | 2.1% | View All 17 Rows |
Immigrants in Archer City
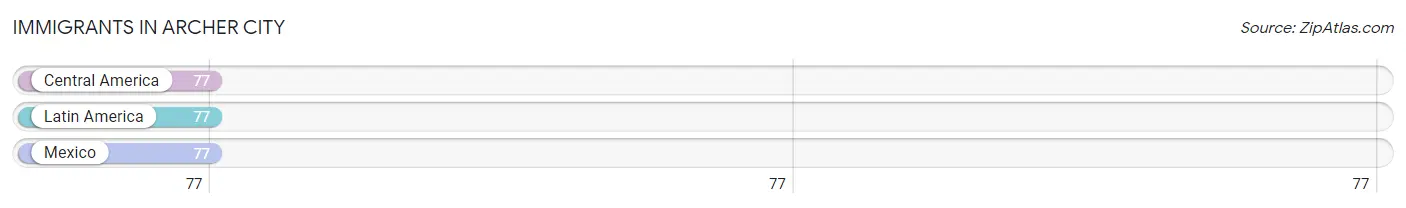
The most numerous immigrant groups reported in Archer City came from Central America (77 | 5.0%), Latin America (77 | 5.0%), and Mexico (77 | 5.0%), together accounting for 14.9% of all Archer City residents.
| Immigration Origin | # Population | % Population |
| Central America | 77 | 5.0% |
| Latin America | 77 | 5.0% |
| Mexico | 77 | 5.0% | View All 3 Rows |
Sex and Age in Archer City
Sex and Age in Archer City
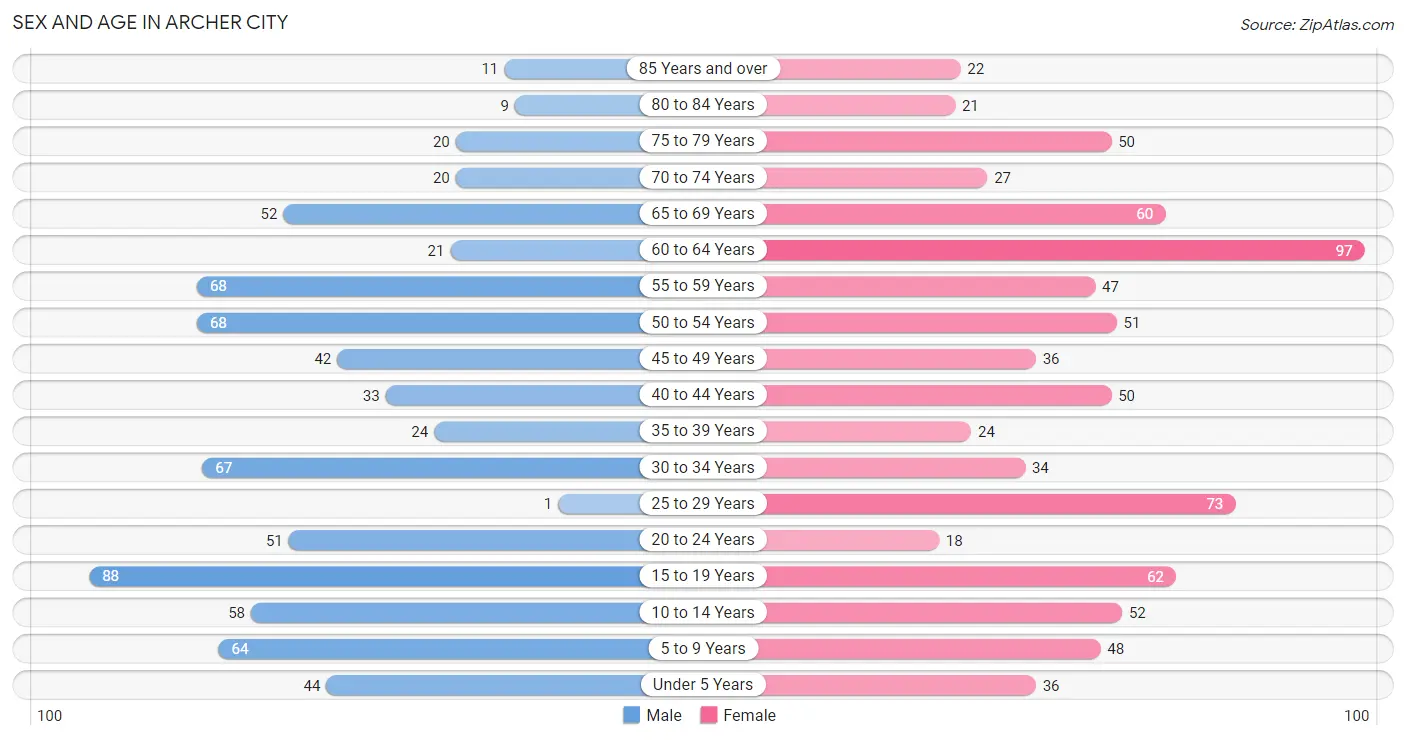
The most populous age groups in Archer City are 15 to 19 Years (88 | 11.9%) for men and 60 to 64 Years (97 | 12.0%) for women.
| Age Bracket | Male | Female |
| Under 5 Years | 44 (5.9%) | 36 (4.5%) |
| 5 to 9 Years | 64 (8.6%) | 48 (5.9%) |
| 10 to 14 Years | 58 (7.8%) | 52 (6.4%) |
| 15 to 19 Years | 88 (11.9%) | 62 (7.7%) |
| 20 to 24 Years | 51 (6.9%) | 18 (2.2%) |
| 25 to 29 Years | 1 (0.1%) | 73 (9.0%) |
| 30 to 34 Years | 67 (9.0%) | 34 (4.2%) |
| 35 to 39 Years | 24 (3.2%) | 24 (3.0%) |
| 40 to 44 Years | 33 (4.4%) | 50 (6.2%) |
| 45 to 49 Years | 42 (5.7%) | 36 (4.5%) |
| 50 to 54 Years | 68 (9.2%) | 51 (6.3%) |
| 55 to 59 Years | 68 (9.2%) | 47 (5.8%) |
| 60 to 64 Years | 21 (2.8%) | 97 (12.0%) |
| 65 to 69 Years | 52 (7.0%) | 60 (7.4%) |
| 70 to 74 Years | 20 (2.7%) | 27 (3.3%) |
| 75 to 79 Years | 20 (2.7%) | 50 (6.2%) |
| 80 to 84 Years | 9 (1.2%) | 21 (2.6%) |
| 85 Years and over | 11 (1.5%) | 22 (2.7%) |
| Total | 741 (100.0%) | 808 (100.0%) |
Families and Households in Archer City
Median Family Size in Archer City
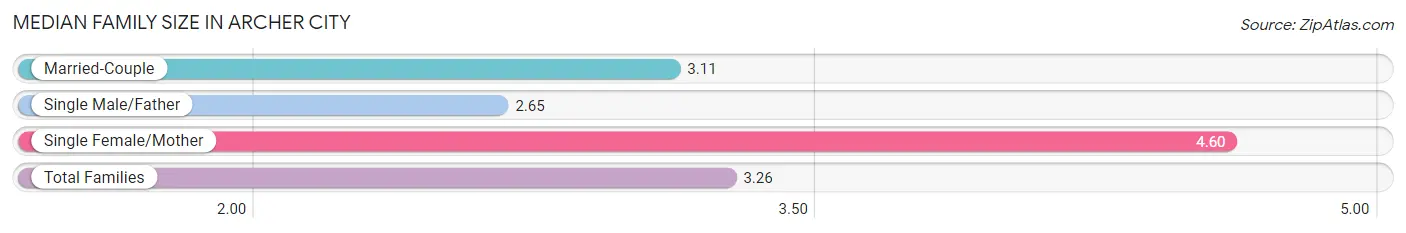
The median family size in Archer City is 3.26 persons per family, with single female/mother families (48 | 13.4%) accounting for the largest median family size of 4.6 persons per family. On the other hand, single male/father families (40 | 11.2%) represent the smallest median family size with 2.65 persons per family.
| Family Type | # Families | Family Size |
| Married-Couple | 270 (75.4%) | 3.11 |
| Single Male/Father | 40 (11.2%) | 2.65 |
| Single Female/Mother | 48 (13.4%) | 4.60 |
| Total Families | 358 (100.0%) | 3.26 |
Median Household Size in Archer City
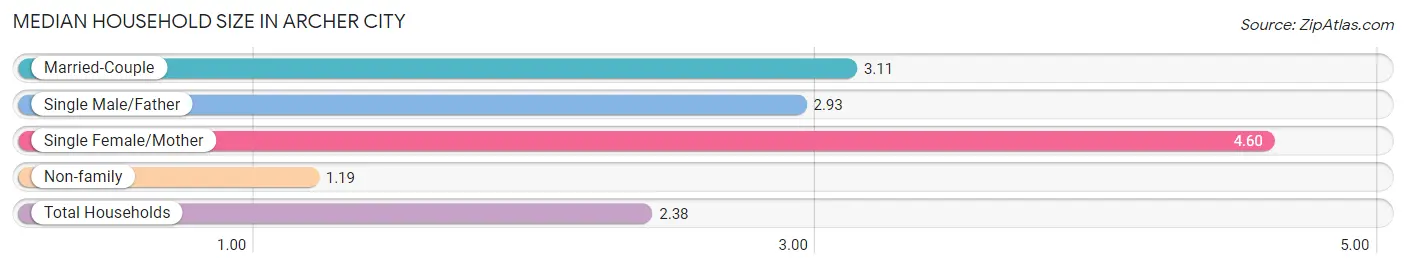
The median household size in Archer City is 2.38 persons per household, with single female/mother households (48 | 7.6%) accounting for the largest median household size of 4.6 persons per household. non-family households (274 | 43.3%) represent the smallest median household size with 1.19 persons per household.
| Household Type | # Households | Household Size |
| Married-Couple | 270 (42.7%) | 3.11 |
| Single Male/Father | 40 (6.3%) | 2.93 |
| Single Female/Mother | 48 (7.6%) | 4.60 |
| Non-family | 274 (43.3%) | 1.19 |
| Total Households | 632 (100.0%) | 2.38 |
Household Size by Marriage Status in Archer City
Out of a total of 632 households in Archer City, 358 (56.7%) are family households, while 274 (43.3%) are nonfamily households. The most numerous type of family households are 2-person households, comprising 157, and the most common type of nonfamily households are 1-person households, comprising 243.
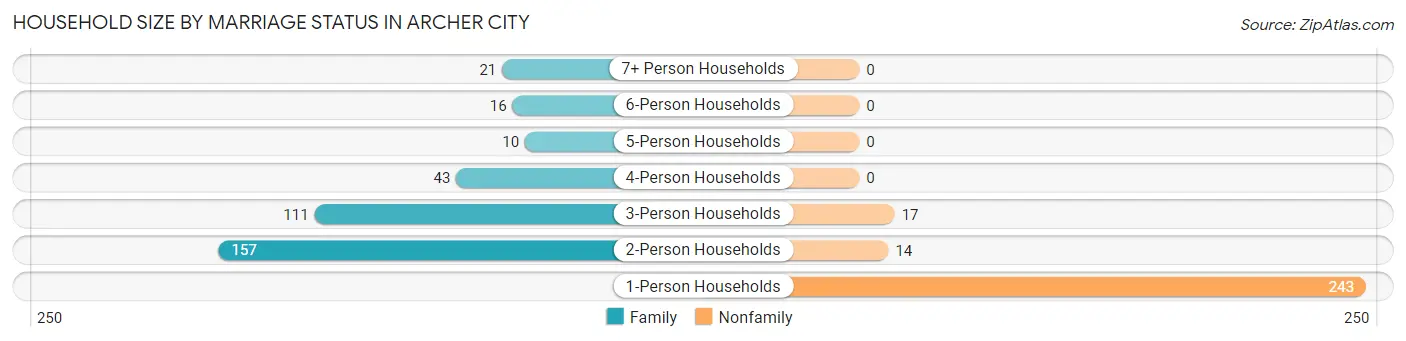
| Household Size | Family Households | Nonfamily Households |
| 1-Person Households | - | 243 (38.5%) |
| 2-Person Households | 157 (24.8%) | 14 (2.2%) |
| 3-Person Households | 111 (17.6%) | 17 (2.7%) |
| 4-Person Households | 43 (6.8%) | 0 (0.0%) |
| 5-Person Households | 10 (1.6%) | 0 (0.0%) |
| 6-Person Households | 16 (2.5%) | 0 (0.0%) |
| 7+ Person Households | 21 (3.3%) | 0 (0.0%) |
| Total | 358 (56.7%) | 274 (43.3%) |
Female Fertility in Archer City
Fertility by Age in Archer City
| Age Bracket | Women with Births | Births / 1,000 Women |
| 15 to 19 years | 0 (0.0%) | 0.0 |
| 20 to 34 years | 0 (0.0%) | 0.0 |
| 35 to 50 years | 0 (0.0%) | 0.0 |
| Total | 0 (0.0%) | 0.0 |
Fertility by Age by Marriage Status in Archer City
| Age Bracket | Married | Unmarried |
| 15 to 19 years | 0 (0.0%) | 0 (0.0%) |
| 20 to 34 years | 0 (0.0%) | 0 (0.0%) |
| 35 to 50 years | 0 (0.0%) | 0 (0.0%) |
| Total | 0 (0.0%) | 0 (0.0%) |
Fertility by Education in Archer City
| Educational Attainment | Women with Births | Births / 1,000 Women |
| Less than High School | 0 (0.0%) | 0.0 |
| High School Diploma | 0 (0.0%) | 0.0 |
| College or Associate's Degree | 0 (0.0%) | 0.0 |
| Bachelor's Degree | 0 (0.0%) | 0.0 |
| Graduate Degree | 0 (0.0%) | 0.0 |
| Total | 0 (0.0%) | 0.0 |
Fertility by Education by Marriage Status in Archer City
| Educational Attainment | Married | Unmarried |
| Less than High School | 0 (0.0%) | 0 (0.0%) |
| High School Diploma | 0 (0.0%) | 0 (0.0%) |
| College or Associate's Degree | 0 (0.0%) | 0 (0.0%) |
| Bachelor's Degree | 0 (0.0%) | 0 (0.0%) |
| Graduate Degree | 0 (0.0%) | 0 (0.0%) |
| Total | 0 (0.0%) | 0 (0.0%) |
Employment Characteristics in Archer City
Employment by Class of Employer in Archer City
Among the 581 employed individuals in Archer City, private company employees (312 | 53.7%), local government employees (81 | 13.9%), and self-employed (not incorporated) (69 | 11.9%) make up the most common classes of employment.
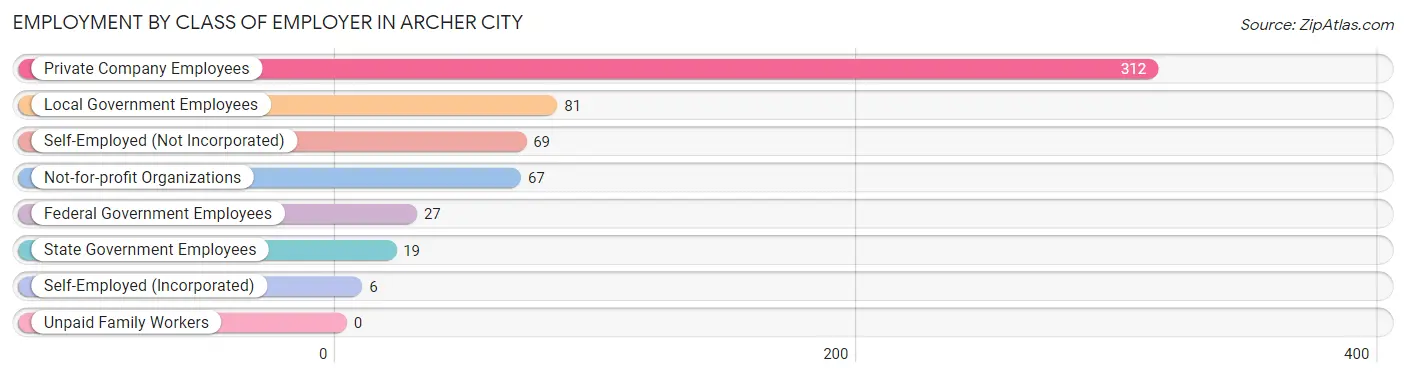
| Employer Class | # Employees | % Employees |
| Private Company Employees | 312 | 53.7% |
| Self-Employed (Incorporated) | 6 | 1.0% |
| Self-Employed (Not Incorporated) | 69 | 11.9% |
| Not-for-profit Organizations | 67 | 11.5% |
| Local Government Employees | 81 | 13.9% |
| State Government Employees | 19 | 3.3% |
| Federal Government Employees | 27 | 4.6% |
| Unpaid Family Workers | 0 | 0.0% |
| Total | 581 | 100.0% |
Employment Status by Age in Archer City
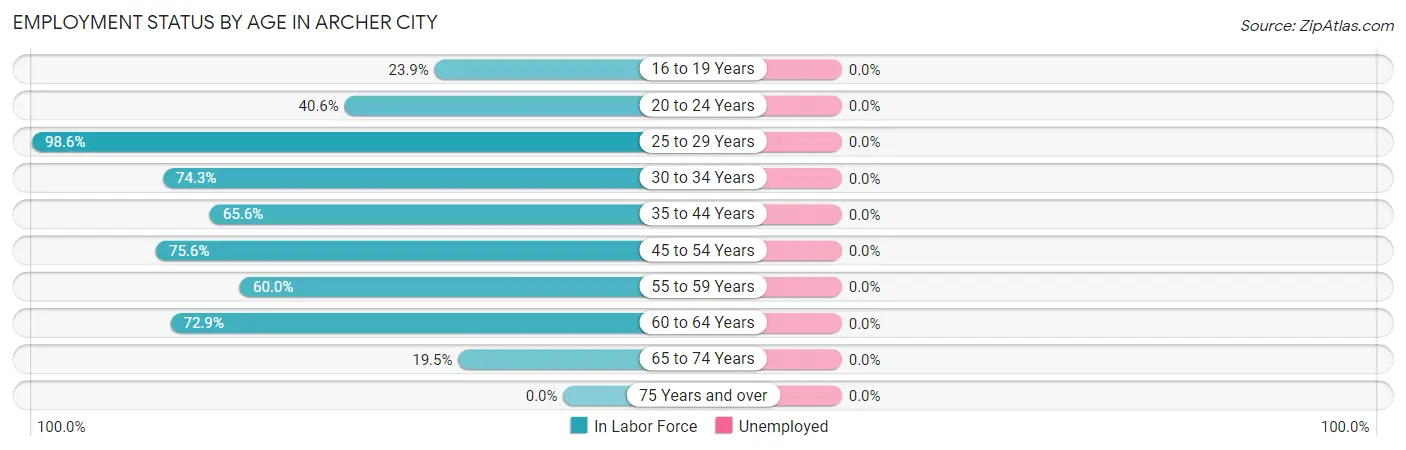
| Age Bracket | In Labor Force | Unemployed |
| 16 to 19 Years | 27 (23.9%) | 0 (0.0%) |
| 20 to 24 Years | 28 (40.6%) | 0 (0.0%) |
| 25 to 29 Years | 73 (98.6%) | 0 (0.0%) |
| 30 to 34 Years | 75 (74.3%) | 0 (0.0%) |
| 35 to 44 Years | 86 (65.6%) | 0 (0.0%) |
| 45 to 54 Years | 149 (75.6%) | 0 (0.0%) |
| 55 to 59 Years | 69 (60.0%) | 0 (0.0%) |
| 60 to 64 Years | 86 (72.9%) | 0 (0.0%) |
| 65 to 74 Years | 31 (19.5%) | 0 (0.0%) |
| 75 Years and over | 0 (0.0%) | 0 (0.0%) |
| Total | 624 (51.6%) | 0 (0.0%) |
Employment Status by Educational Attainment in Archer City
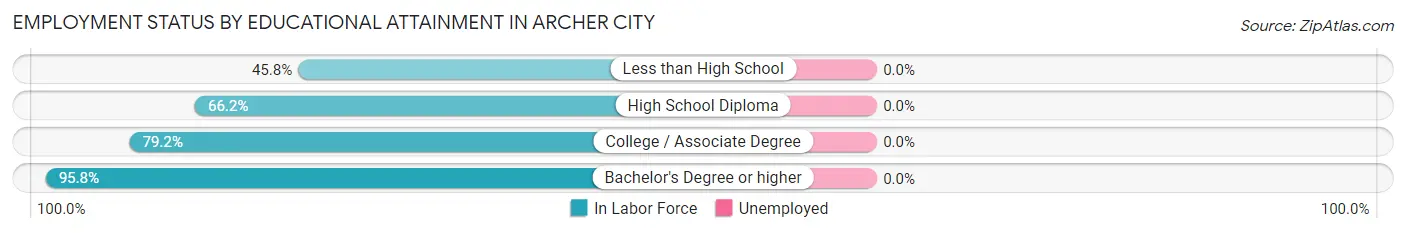
| Educational Attainment | In Labor Force | Unemployed |
| Less than High School | 54 (45.8%) | 0 (0.0%) |
| High School Diploma | 188 (66.2%) | 0 (0.0%) |
| College / Associate Degree | 114 (79.2%) | 0 (0.0%) |
| Bachelor's Degree or higher | 182 (95.8%) | 0 (0.0%) |
| Total | 538 (73.1%) | 0 (0.0%) |
Employment Occupations by Sex in Archer City
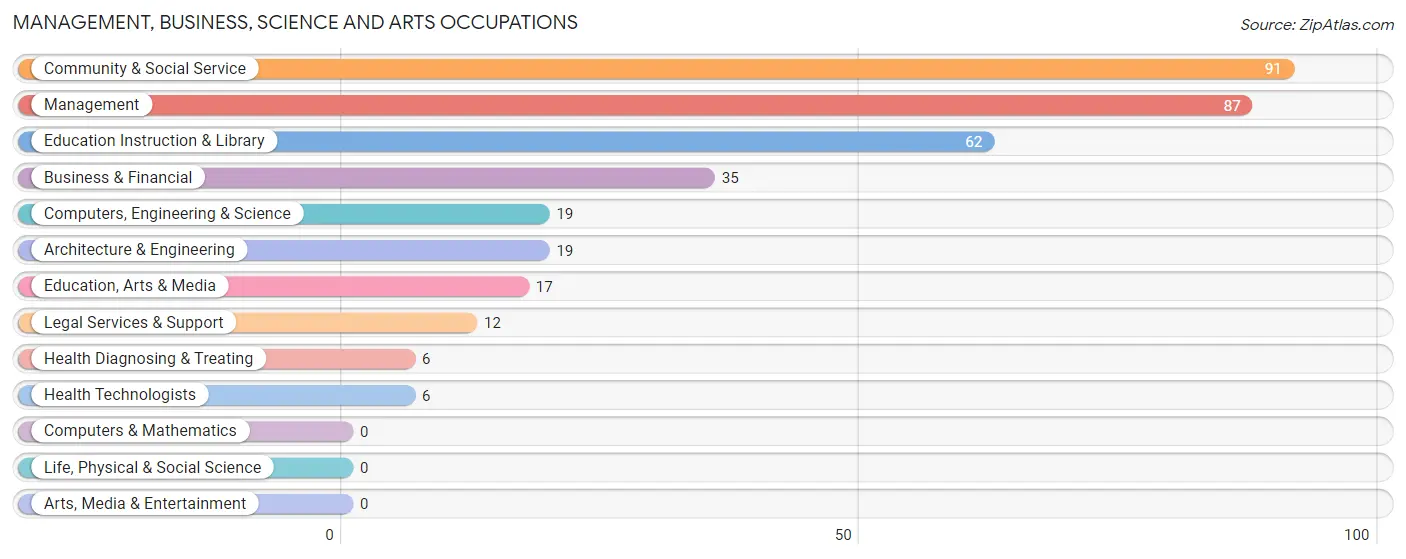
Management, Business, Science and Arts Occupations
The most common Management, Business, Science and Arts occupations in Archer City are Community & Social Service (91 | 14.6%), Management (87 | 13.9%), Education Instruction & Library (62 | 9.9%), Business & Financial (35 | 5.6%), and Computers, Engineering & Science (19 | 3.0%).
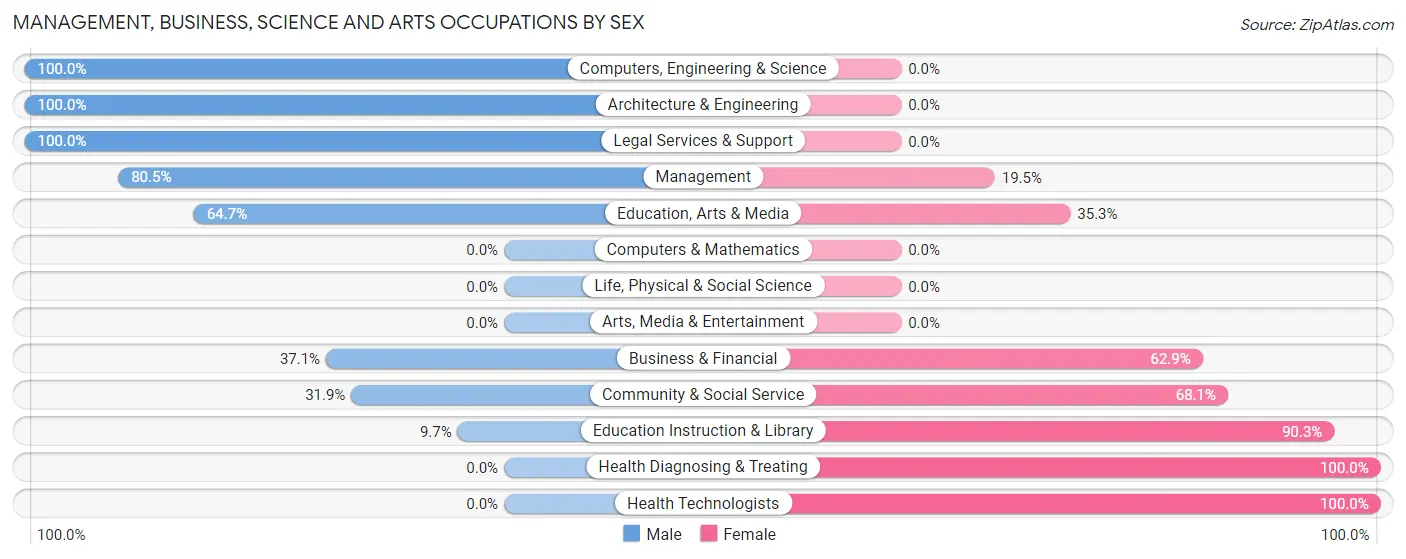
Management, Business, Science and Arts Occupations by Sex
Within the Management, Business, Science and Arts occupations in Archer City, the most male-oriented occupations are Computers, Engineering & Science (100.0%), Architecture & Engineering (100.0%), and Legal Services & Support (100.0%), while the most female-oriented occupations are Health Diagnosing & Treating (100.0%), Health Technologists (100.0%), and Education Instruction & Library (90.3%).
| Occupation | Male | Female |
| Management | 70 (80.5%) | 17 (19.5%) |
| Business & Financial | 13 (37.1%) | 22 (62.9%) |
| Computers, Engineering & Science | 19 (100.0%) | 0 (0.0%) |
| Computers & Mathematics | 0 (0.0%) | 0 (0.0%) |
| Architecture & Engineering | 19 (100.0%) | 0 (0.0%) |
| Life, Physical & Social Science | 0 (0.0%) | 0 (0.0%) |
| Community & Social Service | 29 (31.9%) | 62 (68.1%) |
| Education, Arts & Media | 11 (64.7%) | 6 (35.3%) |
| Legal Services & Support | 12 (100.0%) | 0 (0.0%) |
| Education Instruction & Library | 6 (9.7%) | 56 (90.3%) |
| Arts, Media & Entertainment | 0 (0.0%) | 0 (0.0%) |
| Health Diagnosing & Treating | 0 (0.0%) | 6 (100.0%) |
| Health Technologists | 0 (0.0%) | 6 (100.0%) |
| Total (Category) | 131 (55.0%) | 107 (45.0%) |
| Total (Overall) | 297 (47.6%) | 327 (52.4%) |
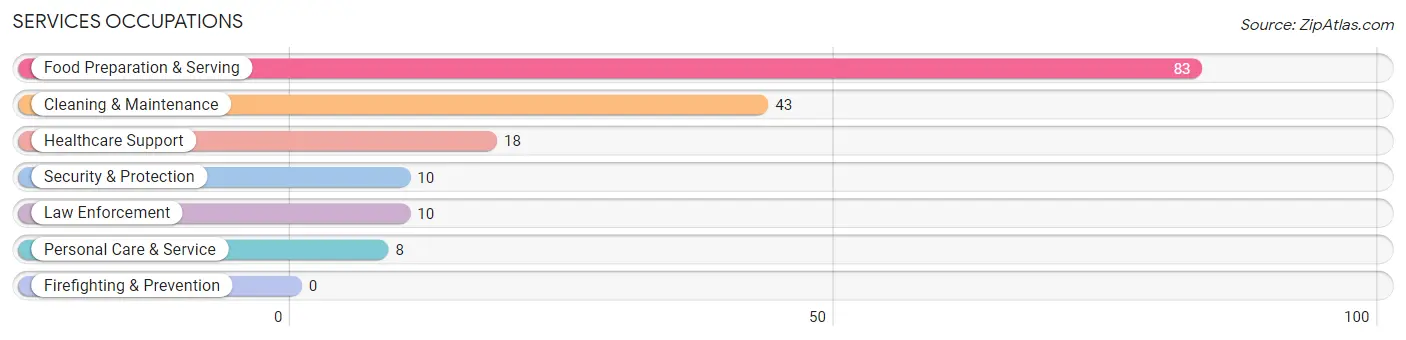
Services Occupations
The most common Services occupations in Archer City are Food Preparation & Serving (83 | 13.3%), Cleaning & Maintenance (43 | 6.9%), Healthcare Support (18 | 2.9%), Security & Protection (10 | 1.6%), and Law Enforcement (10 | 1.6%).
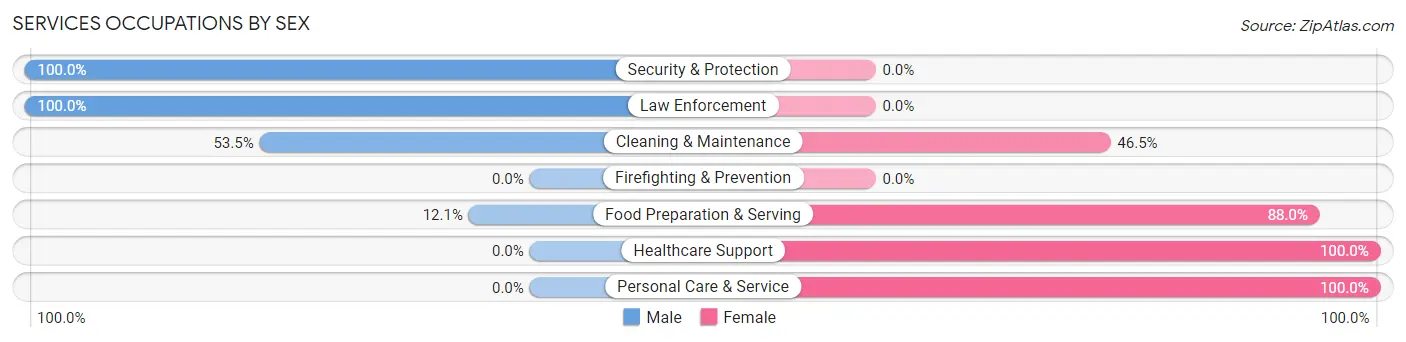
Services Occupations by Sex
Within the Services occupations in Archer City, the most male-oriented occupations are Security & Protection (100.0%), Law Enforcement (100.0%), and Cleaning & Maintenance (53.5%), while the most female-oriented occupations are Healthcare Support (100.0%), Personal Care & Service (100.0%), and Food Preparation & Serving (87.9%).
| Occupation | Male | Female |
| Healthcare Support | 0 (0.0%) | 18 (100.0%) |
| Security & Protection | 10 (100.0%) | 0 (0.0%) |
| Firefighting & Prevention | 0 (0.0%) | 0 (0.0%) |
| Law Enforcement | 10 (100.0%) | 0 (0.0%) |
| Food Preparation & Serving | 10 (12.0%) | 73 (87.9%) |
| Cleaning & Maintenance | 23 (53.5%) | 20 (46.5%) |
| Personal Care & Service | 0 (0.0%) | 8 (100.0%) |
| Total (Category) | 43 (26.5%) | 119 (73.5%) |
| Total (Overall) | 297 (47.6%) | 327 (52.4%) |
Sales and Office Occupations
The most common Sales and Office occupations in Archer City are Office & Administration (69 | 11.1%), and Sales & Related (41 | 6.6%).
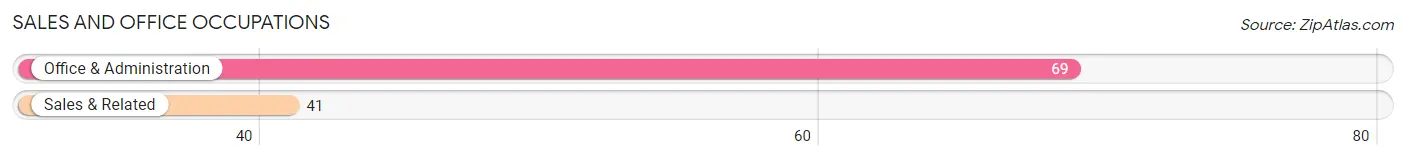
Sales and Office Occupations by Sex
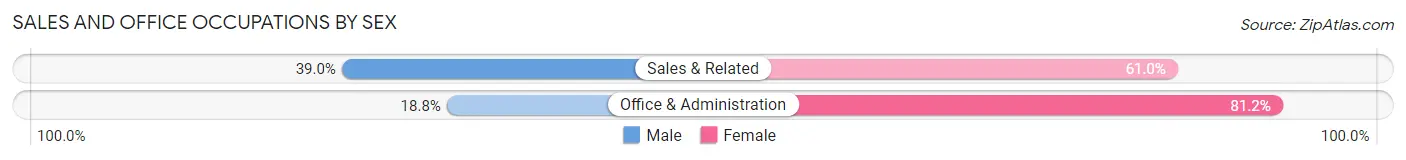
| Occupation | Male | Female |
| Sales & Related | 16 (39.0%) | 25 (61.0%) |
| Office & Administration | 13 (18.8%) | 56 (81.2%) |
| Total (Category) | 29 (26.4%) | 81 (73.6%) |
| Total (Overall) | 297 (47.6%) | 327 (52.4%) |
Natural Resources, Construction and Maintenance Occupations
The most common Natural Resources, Construction and Maintenance occupations in Archer City are Farming, Fishing & Forestry (31 | 5.0%), and Installation, Maintenance & Repair (18 | 2.9%).
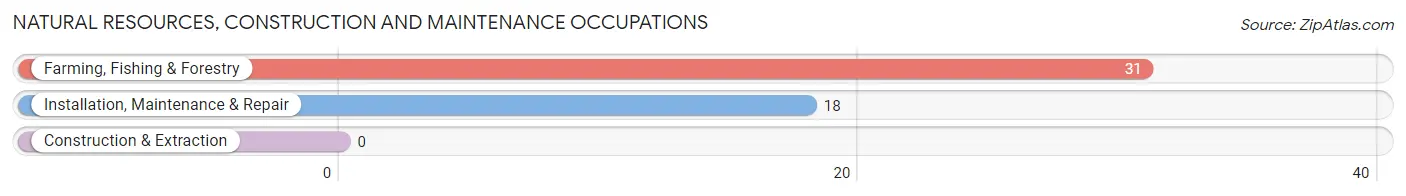
Natural Resources, Construction and Maintenance Occupations by Sex
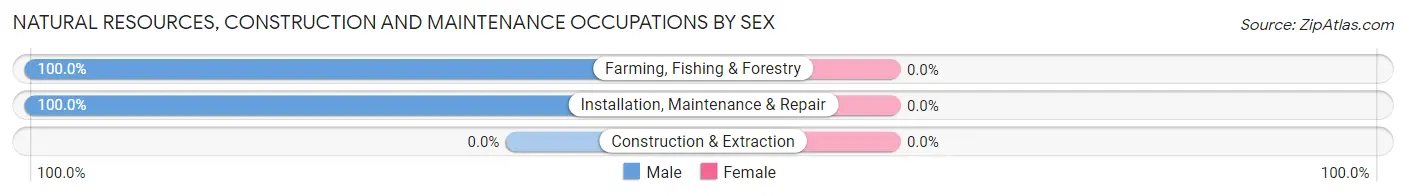
| Occupation | Male | Female |
| Farming, Fishing & Forestry | 31 (100.0%) | 0 (0.0%) |
| Construction & Extraction | 0 (0.0%) | 0 (0.0%) |
| Installation, Maintenance & Repair | 18 (100.0%) | 0 (0.0%) |
| Total (Category) | 49 (100.0%) | 0 (0.0%) |
| Total (Overall) | 297 (47.6%) | 327 (52.4%) |
Production, Transportation and Moving Occupations
The most common Production, Transportation and Moving occupations in Archer City are Production (49 | 7.9%), and Transportation (16 | 2.6%).
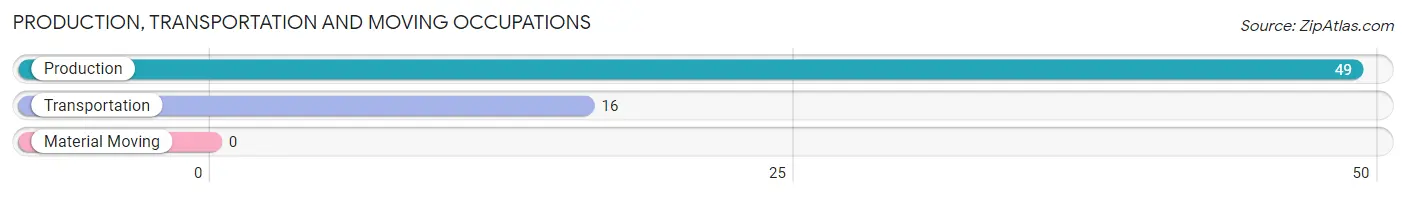
Production, Transportation and Moving Occupations by Sex
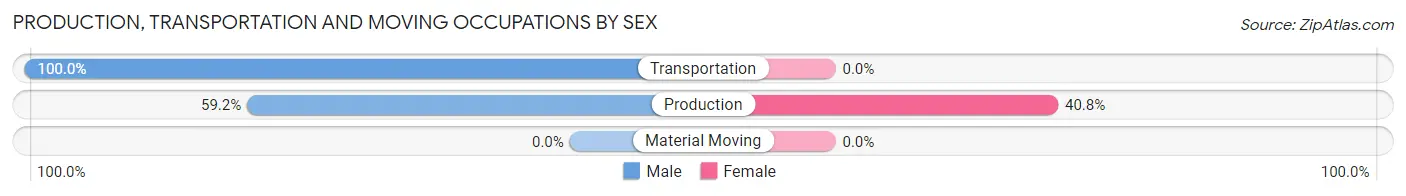
| Occupation | Male | Female |
| Production | 29 (59.2%) | 20 (40.8%) |
| Transportation | 16 (100.0%) | 0 (0.0%) |
| Material Moving | 0 (0.0%) | 0 (0.0%) |
| Total (Category) | 45 (69.2%) | 20 (30.8%) |
| Total (Overall) | 297 (47.6%) | 327 (52.4%) |
Employment Industries by Sex in Archer City
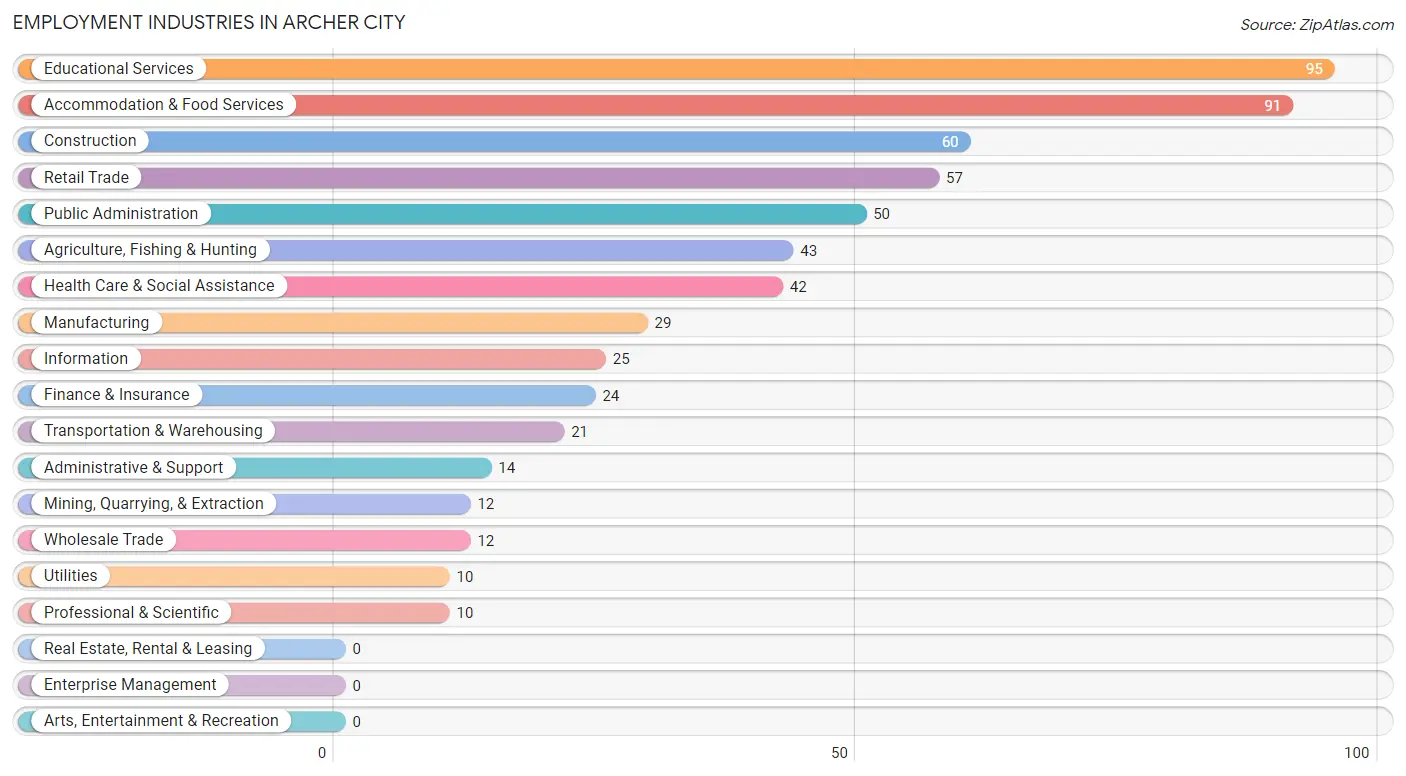
Employment Industries in Archer City
The major employment industries in Archer City include Educational Services (95 | 15.2%), Accommodation & Food Services (91 | 14.6%), Construction (60 | 9.6%), Retail Trade (57 | 9.1%), and Public Administration (50 | 8.0%).
Employment Industries by Sex in Archer City
The Archer City industries that see more men than women are Agriculture, Fishing & Hunting (100.0%), Mining, Quarrying, & Extraction (100.0%), and Utilities (100.0%), whereas the industries that tend to have a higher number of women are Information (100.0%), Professional & Scientific (100.0%), and Health Care & Social Assistance (100.0%).
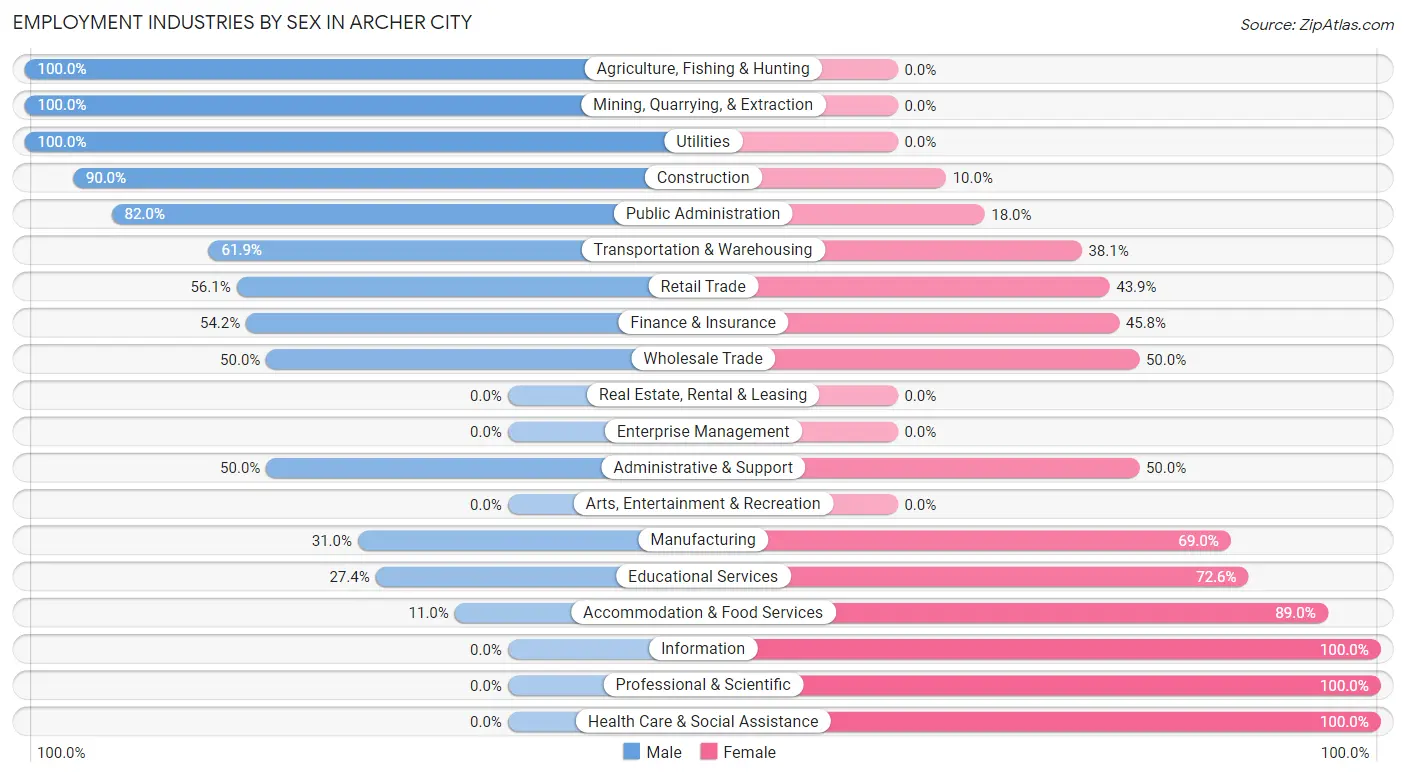
| Industry | Male | Female |
| Agriculture, Fishing & Hunting | 43 (100.0%) | 0 (0.0%) |
| Mining, Quarrying, & Extraction | 12 (100.0%) | 0 (0.0%) |
| Construction | 54 (90.0%) | 6 (10.0%) |
| Manufacturing | 9 (31.0%) | 20 (69.0%) |
| Wholesale Trade | 6 (50.0%) | 6 (50.0%) |
| Retail Trade | 32 (56.1%) | 25 (43.9%) |
| Transportation & Warehousing | 13 (61.9%) | 8 (38.1%) |
| Utilities | 10 (100.0%) | 0 (0.0%) |
| Information | 0 (0.0%) | 25 (100.0%) |
| Finance & Insurance | 13 (54.2%) | 11 (45.8%) |
| Real Estate, Rental & Leasing | 0 (0.0%) | 0 (0.0%) |
| Professional & Scientific | 0 (0.0%) | 10 (100.0%) |
| Enterprise Management | 0 (0.0%) | 0 (0.0%) |
| Administrative & Support | 7 (50.0%) | 7 (50.0%) |
| Educational Services | 26 (27.4%) | 69 (72.6%) |
| Health Care & Social Assistance | 0 (0.0%) | 42 (100.0%) |
| Arts, Entertainment & Recreation | 0 (0.0%) | 0 (0.0%) |
| Accommodation & Food Services | 10 (11.0%) | 81 (89.0%) |
| Public Administration | 41 (82.0%) | 9 (18.0%) |
| Total | 297 (47.6%) | 327 (52.4%) |
Education in Archer City
School Enrollment in Archer City
The most common levels of schooling among the 402 students in Archer City are high school (141 | 35.1%), middle school (99 | 24.6%), and elementary school (74 | 18.4%).
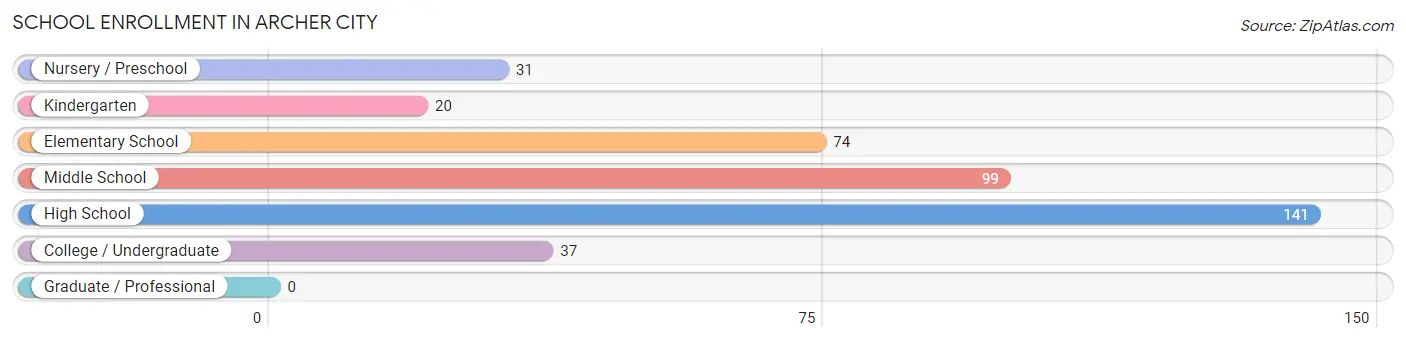
| School Level | # Students | % Students |
| Nursery / Preschool | 31 | 7.7% |
| Kindergarten | 20 | 5.0% |
| Elementary School | 74 | 18.4% |
| Middle School | 99 | 24.6% |
| High School | 141 | 35.1% |
| College / Undergraduate | 37 | 9.2% |
| Graduate / Professional | 0 | 0.0% |
| Total | 402 | 100.0% |
School Enrollment by Age by Funding Source in Archer City
Out of a total of 402 students who are enrolled in schools in Archer City, 25 (6.2%) attend a private institution, while the remaining 377 (93.8%) are enrolled in public schools. The age group of 18 to 19 year olds has the highest likelihood of being enrolled in private schools, with 18 (66.7% in the age bracket) enrolled. Conversely, the age group of 3 to 4 year olds has the lowest likelihood of being enrolled in a private school, with 31 (100.0% in the age bracket) attending a public institution.
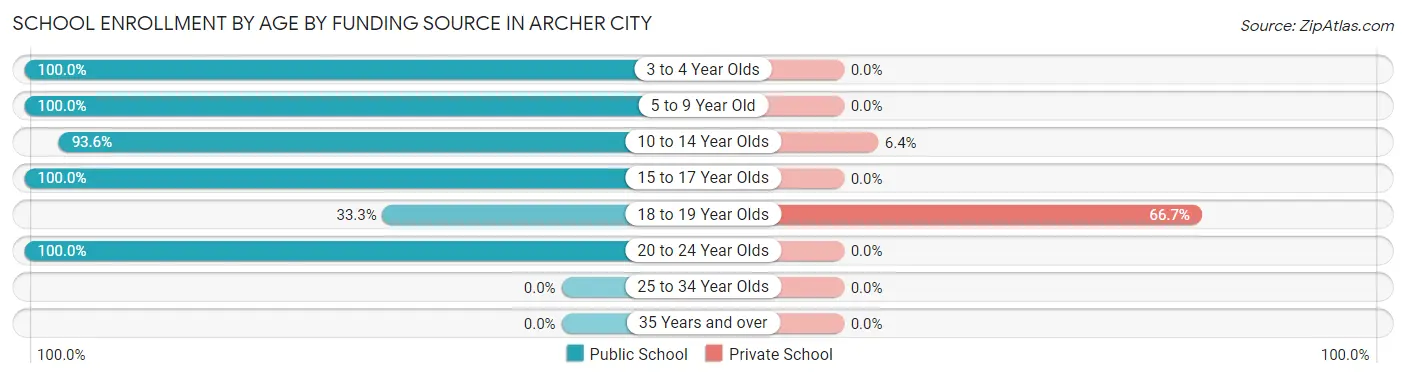
| Age Bracket | Public School | Private School |
| 3 to 4 Year Olds | 31 (100.0%) | 0 (0.0%) |
| 5 to 9 Year Old | 101 (100.0%) | 0 (0.0%) |
| 10 to 14 Year Olds | 103 (93.6%) | 7 (6.4%) |
| 15 to 17 Year Olds | 123 (100.0%) | 0 (0.0%) |
| 18 to 19 Year Olds | 9 (33.3%) | 18 (66.7%) |
| 20 to 24 Year Olds | 10 (100.0%) | 0 (0.0%) |
| 25 to 34 Year Olds | 0 (0.0%) | 0 (0.0%) |
| 35 Years and over | 0 (0.0%) | 0 (0.0%) |
| Total | 377 (93.8%) | 25 (6.2%) |
Educational Attainment by Field of Study in Archer City
Education (67 | 28.6%), business (56 | 23.9%), social sciences (21 | 9.0%), communications (18 | 7.7%), and science & technology (16 | 6.8%) are the most common fields of study among 234 individuals in Archer City who have obtained a bachelor's degree or higher.
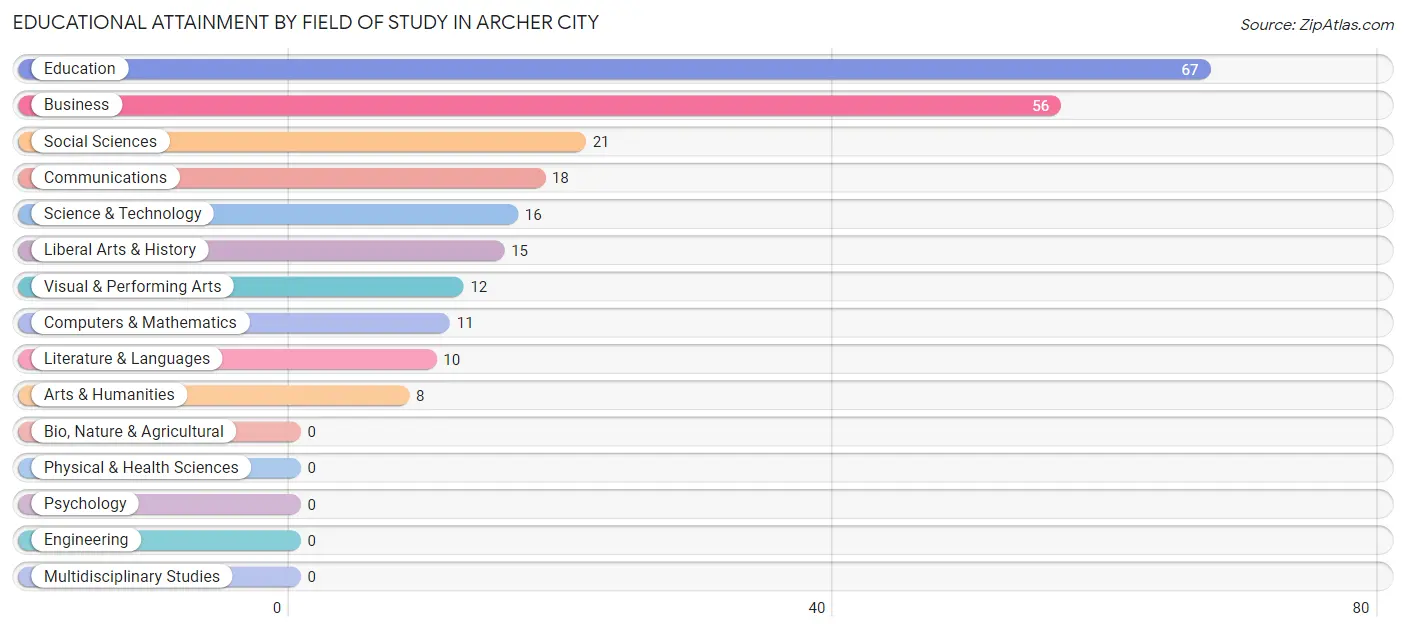
| Field of Study | # Graduates | % Graduates |
| Computers & Mathematics | 11 | 4.7% |
| Bio, Nature & Agricultural | 0 | 0.0% |
| Physical & Health Sciences | 0 | 0.0% |
| Psychology | 0 | 0.0% |
| Social Sciences | 21 | 9.0% |
| Engineering | 0 | 0.0% |
| Multidisciplinary Studies | 0 | 0.0% |
| Science & Technology | 16 | 6.8% |
| Business | 56 | 23.9% |
| Education | 67 | 28.6% |
| Literature & Languages | 10 | 4.3% |
| Liberal Arts & History | 15 | 6.4% |
| Visual & Performing Arts | 12 | 5.1% |
| Communications | 18 | 7.7% |
| Arts & Humanities | 8 | 3.4% |
| Total | 234 | 100.0% |
Transportation & Commute in Archer City
Vehicle Availability by Sex in Archer City
The most prevalent vehicle ownership categories in Archer City are males with 2 vehicles (181, accounting for 60.9%) and females with 2 vehicles (137, making up 63.7%).
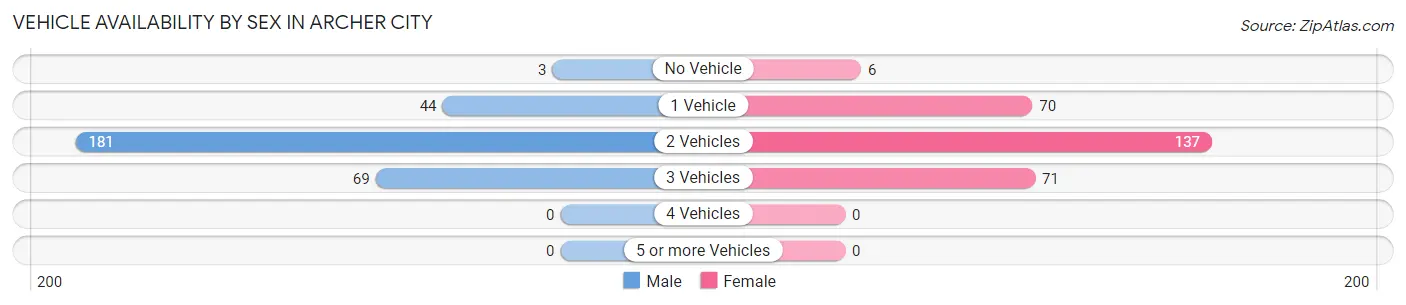
| Vehicles Available | Male | Female |
| No Vehicle | 3 (1.0%) | 6 (2.1%) |
| 1 Vehicle | 44 (14.8%) | 70 (24.6%) |
| 2 Vehicles | 181 (60.9%) | 137 (48.2%) |
| 3 Vehicles | 69 (23.2%) | 71 (25.0%) |
| 4 Vehicles | 0 (0.0%) | 0 (0.0%) |
| 5 or more Vehicles | 0 (0.0%) | 0 (0.0%) |
| Total | 297 (100.0%) | 284 (100.0%) |
Commute Time in Archer City
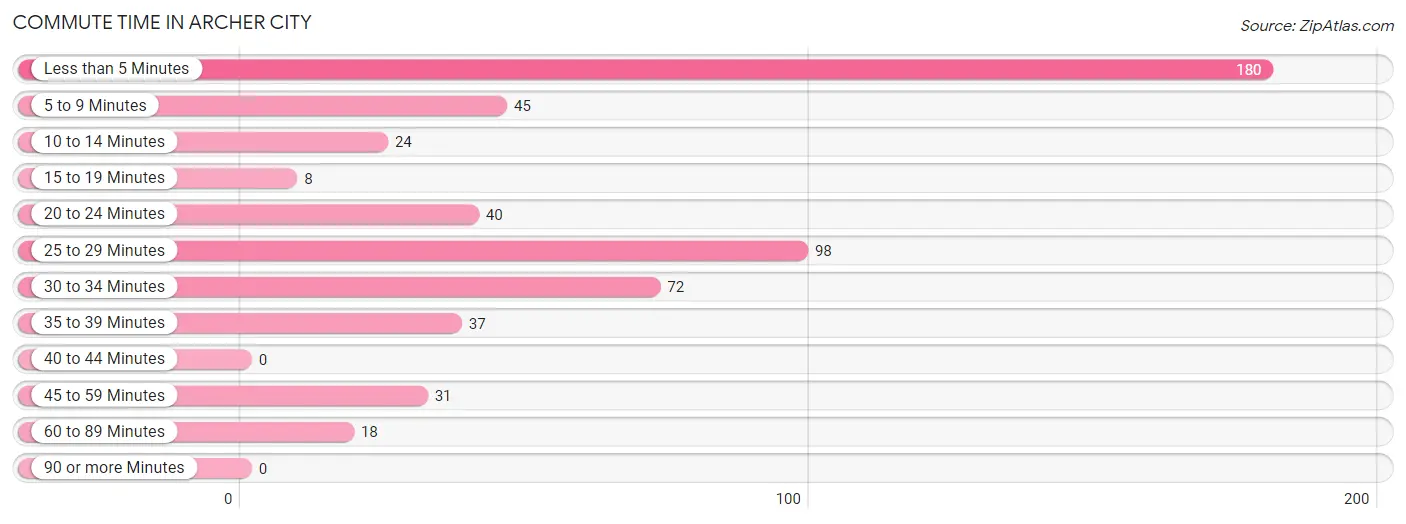
The most frequently occuring commute durations in Archer City are less than 5 minutes (180 commuters, 32.6%), 25 to 29 minutes (98 commuters, 17.7%), and 30 to 34 minutes (72 commuters, 13.0%).
| Commute Time | # Commuters | % Commuters |
| Less than 5 Minutes | 180 | 32.6% |
| 5 to 9 Minutes | 45 | 8.1% |
| 10 to 14 Minutes | 24 | 4.3% |
| 15 to 19 Minutes | 8 | 1.5% |
| 20 to 24 Minutes | 40 | 7.2% |
| 25 to 29 Minutes | 98 | 17.7% |
| 30 to 34 Minutes | 72 | 13.0% |
| 35 to 39 Minutes | 37 | 6.7% |
| 40 to 44 Minutes | 0 | 0.0% |
| 45 to 59 Minutes | 31 | 5.6% |
| 60 to 89 Minutes | 18 | 3.3% |
| 90 or more Minutes | 0 | 0.0% |
Commute Time by Sex in Archer City
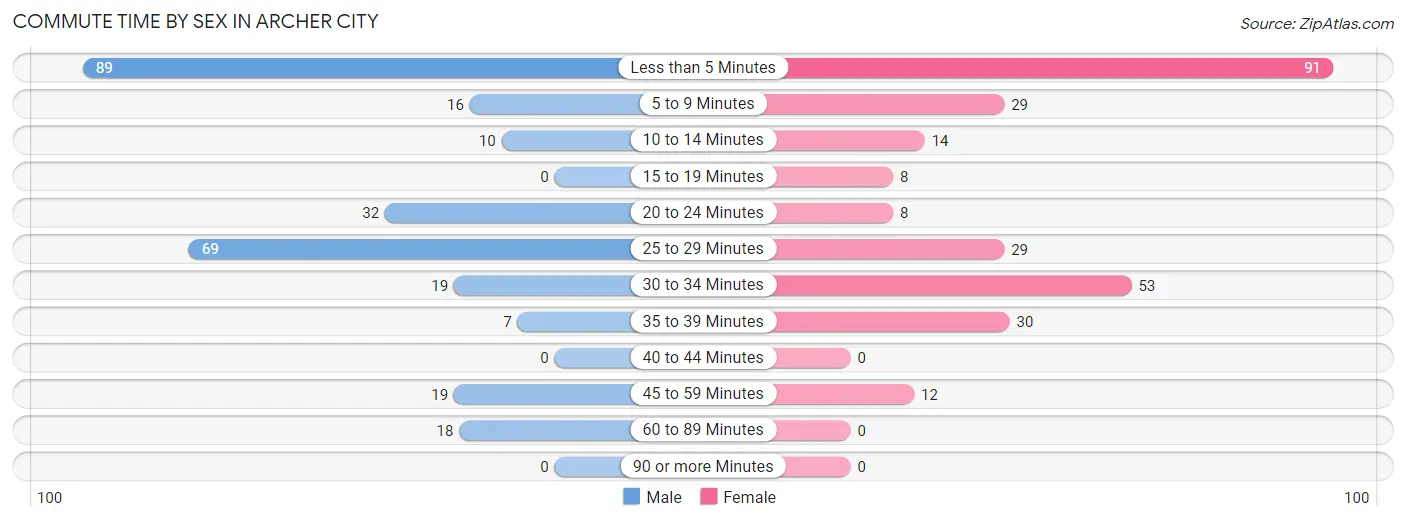
The most common commute times in Archer City are less than 5 minutes (89 commuters, 31.9%) for males and less than 5 minutes (91 commuters, 33.2%) for females.
| Commute Time | Male | Female |
| Less than 5 Minutes | 89 (31.9%) | 91 (33.2%) |
| 5 to 9 Minutes | 16 (5.7%) | 29 (10.6%) |
| 10 to 14 Minutes | 10 (3.6%) | 14 (5.1%) |
| 15 to 19 Minutes | 0 (0.0%) | 8 (2.9%) |
| 20 to 24 Minutes | 32 (11.5%) | 8 (2.9%) |
| 25 to 29 Minutes | 69 (24.7%) | 29 (10.6%) |
| 30 to 34 Minutes | 19 (6.8%) | 53 (19.3%) |
| 35 to 39 Minutes | 7 (2.5%) | 30 (11.0%) |
| 40 to 44 Minutes | 0 (0.0%) | 0 (0.0%) |
| 45 to 59 Minutes | 19 (6.8%) | 12 (4.4%) |
| 60 to 89 Minutes | 18 (6.5%) | 0 (0.0%) |
| 90 or more Minutes | 0 (0.0%) | 0 (0.0%) |
Time of Departure to Work by Sex in Archer City
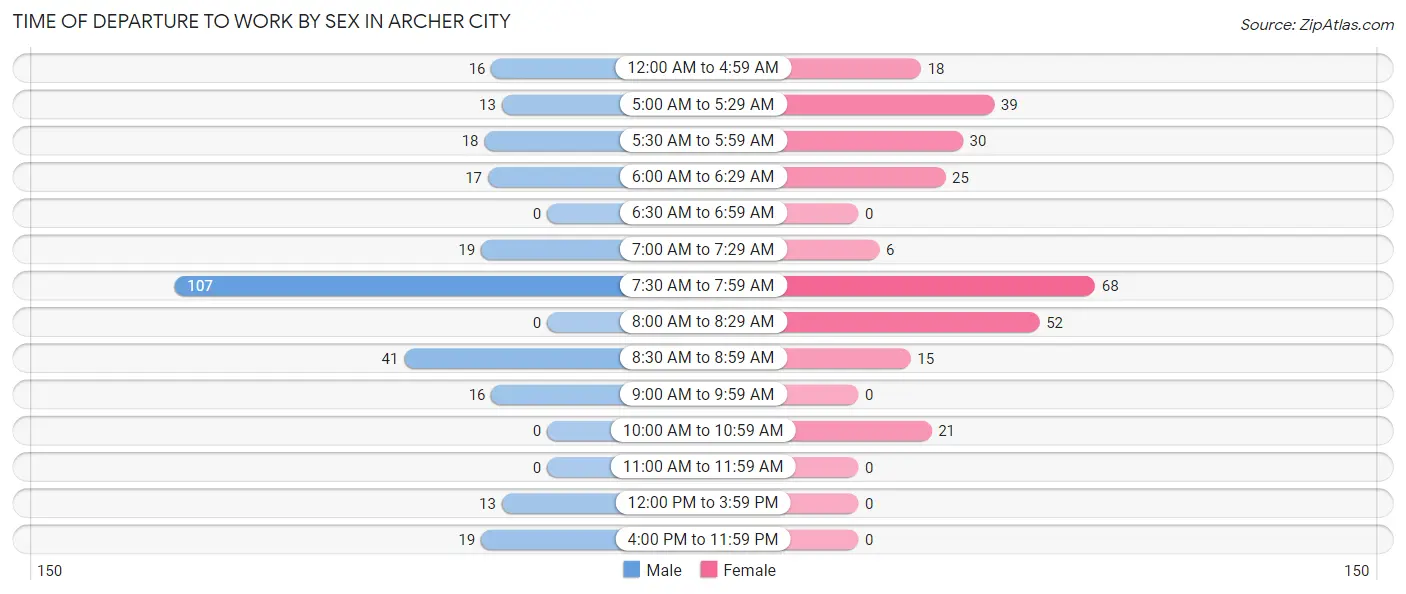
The most frequent times of departure to work in Archer City are 7:30 AM to 7:59 AM (107, 38.4%) for males and 7:30 AM to 7:59 AM (68, 24.8%) for females.
| Time of Departure | Male | Female |
| 12:00 AM to 4:59 AM | 16 (5.7%) | 18 (6.6%) |
| 5:00 AM to 5:29 AM | 13 (4.7%) | 39 (14.2%) |
| 5:30 AM to 5:59 AM | 18 (6.5%) | 30 (11.0%) |
| 6:00 AM to 6:29 AM | 17 (6.1%) | 25 (9.1%) |
| 6:30 AM to 6:59 AM | 0 (0.0%) | 0 (0.0%) |
| 7:00 AM to 7:29 AM | 19 (6.8%) | 6 (2.2%) |
| 7:30 AM to 7:59 AM | 107 (38.4%) | 68 (24.8%) |
| 8:00 AM to 8:29 AM | 0 (0.0%) | 52 (19.0%) |
| 8:30 AM to 8:59 AM | 41 (14.7%) | 15 (5.5%) |
| 9:00 AM to 9:59 AM | 16 (5.7%) | 0 (0.0%) |
| 10:00 AM to 10:59 AM | 0 (0.0%) | 21 (7.7%) |
| 11:00 AM to 11:59 AM | 0 (0.0%) | 0 (0.0%) |
| 12:00 PM to 3:59 PM | 13 (4.7%) | 0 (0.0%) |
| 4:00 PM to 11:59 PM | 19 (6.8%) | 0 (0.0%) |
| Total | 279 (100.0%) | 274 (100.0%) |
Housing Occupancy in Archer City
Occupancy by Ownership in Archer City
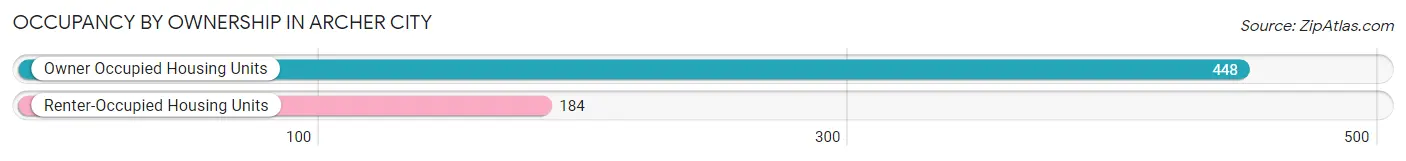
Of the total 632 dwellings in Archer City, owner-occupied units account for 448 (70.9%), while renter-occupied units make up 184 (29.1%).
| Occupancy | # Housing Units | % Housing Units |
| Owner Occupied Housing Units | 448 | 70.9% |
| Renter-Occupied Housing Units | 184 | 29.1% |
| Total Occupied Housing Units | 632 | 100.0% |
Occupancy by Household Size in Archer City
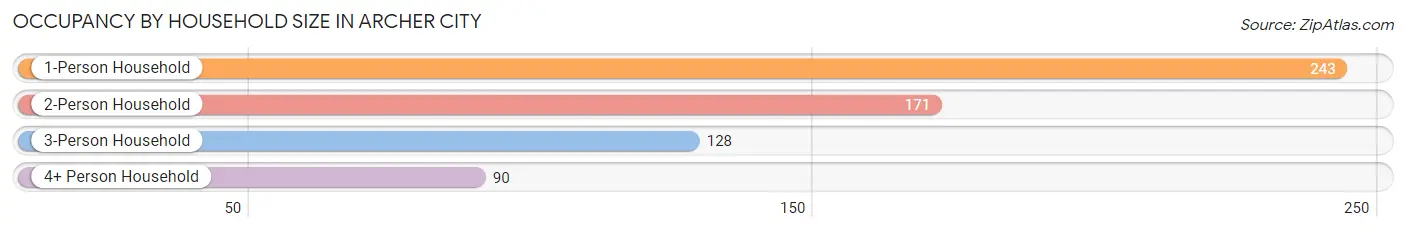
| Household Size | # Housing Units | % Housing Units |
| 1-Person Household | 243 | 38.5% |
| 2-Person Household | 171 | 27.1% |
| 3-Person Household | 128 | 20.3% |
| 4+ Person Household | 90 | 14.2% |
| Total Housing Units | 632 | 100.0% |
Occupancy by Ownership by Household Size in Archer City
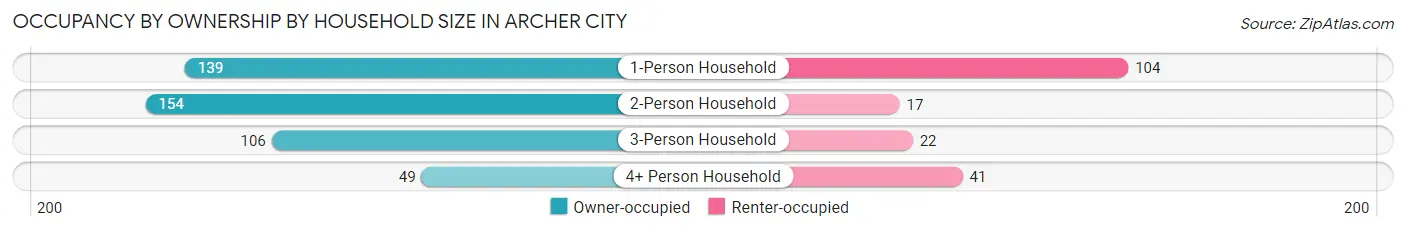
| Household Size | Owner-occupied | Renter-occupied |
| 1-Person Household | 139 (57.2%) | 104 (42.8%) |
| 2-Person Household | 154 (90.1%) | 17 (9.9%) |
| 3-Person Household | 106 (82.8%) | 22 (17.2%) |
| 4+ Person Household | 49 (54.4%) | 41 (45.6%) |
| Total Housing Units | 448 (70.9%) | 184 (29.1%) |
Occupancy by Educational Attainment in Archer City
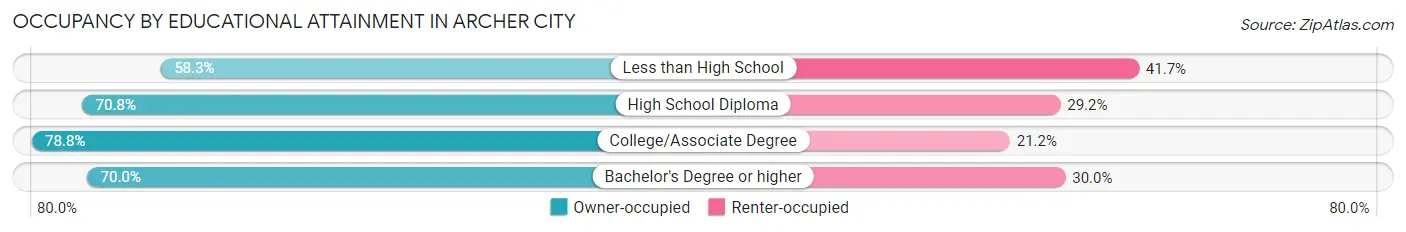
| Household Size | Owner-occupied | Renter-occupied |
| Less than High School | 49 (58.3%) | 35 (41.7%) |
| High School Diploma | 189 (70.8%) | 78 (29.2%) |
| College/Associate Degree | 119 (78.8%) | 32 (21.2%) |
| Bachelor's Degree or higher | 91 (70.0%) | 39 (30.0%) |
Occupancy by Age of Householder in Archer City
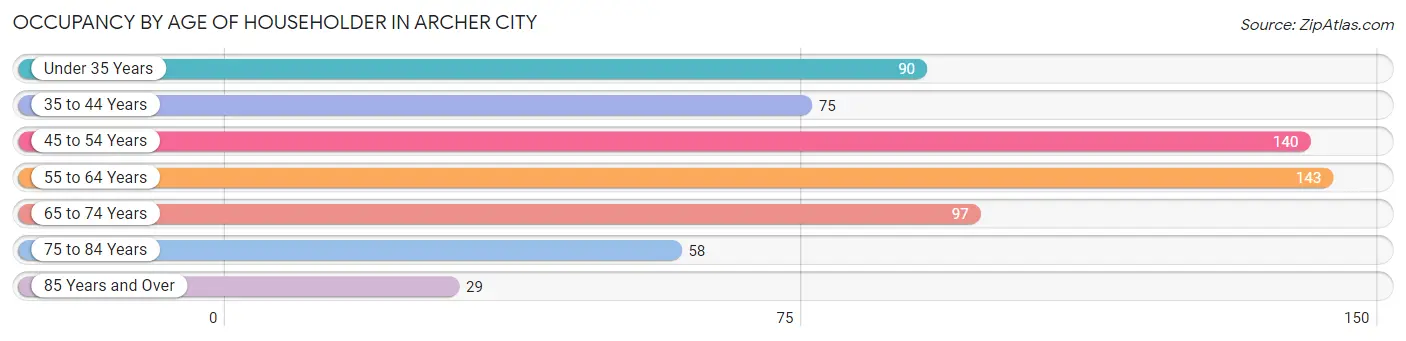
| Age Bracket | # Households | % Households |
| Under 35 Years | 90 | 14.2% |
| 35 to 44 Years | 75 | 11.9% |
| 45 to 54 Years | 140 | 22.2% |
| 55 to 64 Years | 143 | 22.6% |
| 65 to 74 Years | 97 | 15.3% |
| 75 to 84 Years | 58 | 9.2% |
| 85 Years and Over | 29 | 4.6% |
| Total | 632 | 100.0% |
Housing Finances in Archer City
Median Income by Occupancy in Archer City
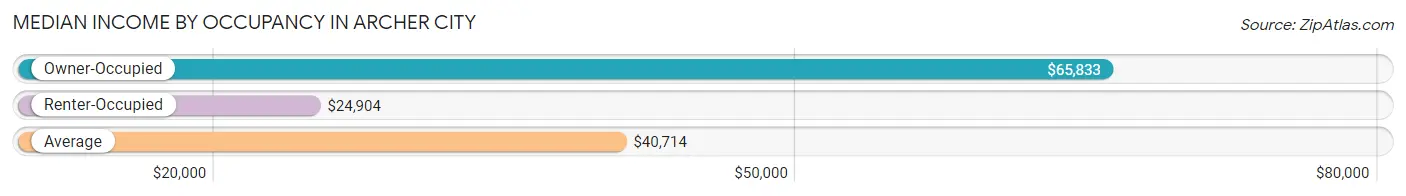
| Occupancy Type | # Households | Median Income |
| Owner-Occupied | 448 (70.9%) | $65,833 |
| Renter-Occupied | 184 (29.1%) | $24,904 |
| Average | 632 (100.0%) | $40,714 |
Occupancy by Householder Income Bracket in Archer City
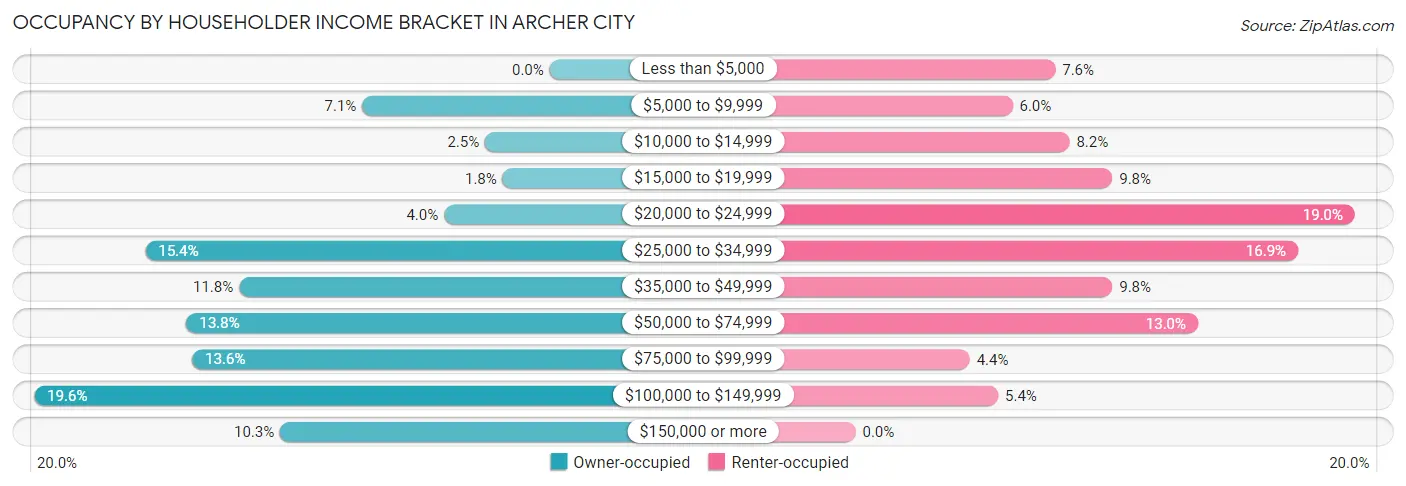
| Income Bracket | Owner-occupied | Renter-occupied |
| Less than $5,000 | 0 (0.0%) | 14 (7.6%) |
| $5,000 to $9,999 | 32 (7.1%) | 11 (6.0%) |
| $10,000 to $14,999 | 11 (2.5%) | 15 (8.2%) |
| $15,000 to $19,999 | 8 (1.8%) | 18 (9.8%) |
| $20,000 to $24,999 | 18 (4.0%) | 35 (19.0%) |
| $25,000 to $34,999 | 69 (15.4%) | 31 (16.9%) |
| $35,000 to $49,999 | 53 (11.8%) | 18 (9.8%) |
| $50,000 to $74,999 | 62 (13.8%) | 24 (13.0%) |
| $75,000 to $99,999 | 61 (13.6%) | 8 (4.3%) |
| $100,000 to $149,999 | 88 (19.6%) | 10 (5.4%) |
| $150,000 or more | 46 (10.3%) | 0 (0.0%) |
| Total | 448 (100.0%) | 184 (100.0%) |
Monthly Housing Cost Tiers in Archer City
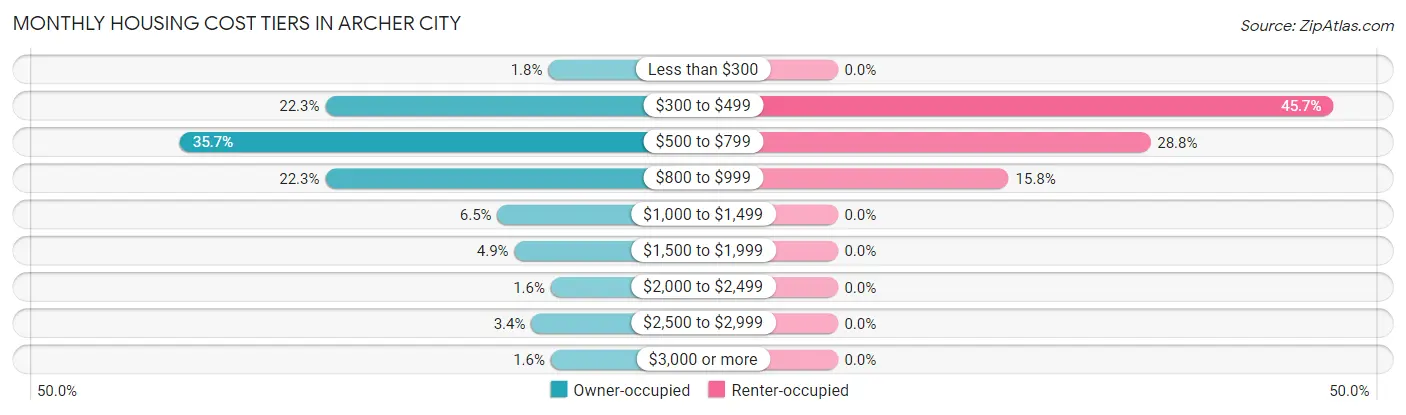
| Monthly Cost | Owner-occupied | Renter-occupied |
| Less than $300 | 8 (1.8%) | 0 (0.0%) |
| $300 to $499 | 100 (22.3%) | 84 (45.7%) |
| $500 to $799 | 160 (35.7%) | 53 (28.8%) |
| $800 to $999 | 100 (22.3%) | 29 (15.8%) |
| $1,000 to $1,499 | 29 (6.5%) | 0 (0.0%) |
| $1,500 to $1,999 | 22 (4.9%) | 0 (0.0%) |
| $2,000 to $2,499 | 7 (1.6%) | 0 (0.0%) |
| $2,500 to $2,999 | 15 (3.4%) | 0 (0.0%) |
| $3,000 or more | 7 (1.6%) | 0 (0.0%) |
| Total | 448 (100.0%) | 184 (100.0%) |
Physical Housing Characteristics in Archer City
Housing Structures in Archer City
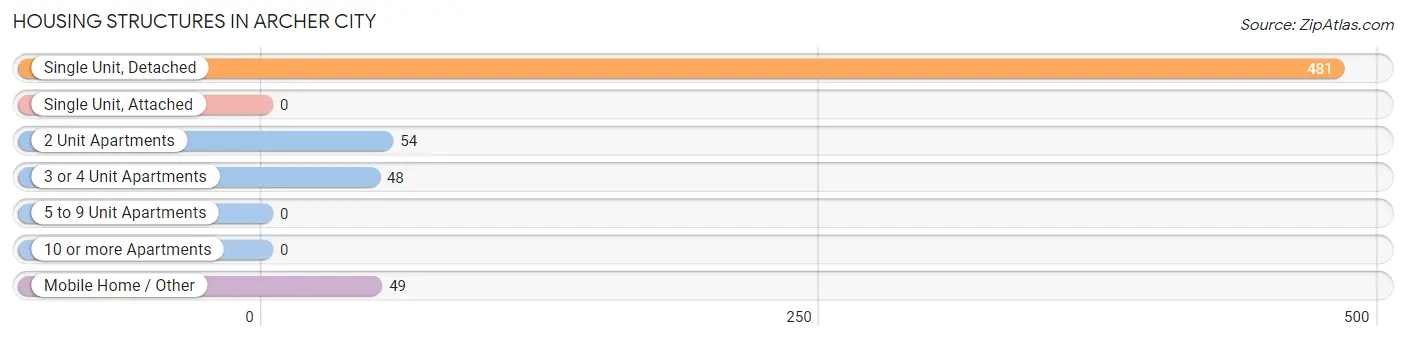
| Structure Type | # Housing Units | % Housing Units |
| Single Unit, Detached | 481 | 76.1% |
| Single Unit, Attached | 0 | 0.0% |
| 2 Unit Apartments | 54 | 8.5% |
| 3 or 4 Unit Apartments | 48 | 7.6% |
| 5 to 9 Unit Apartments | 0 | 0.0% |
| 10 or more Apartments | 0 | 0.0% |
| Mobile Home / Other | 49 | 7.7% |
| Total | 632 | 100.0% |
Housing Structures by Occupancy in Archer City
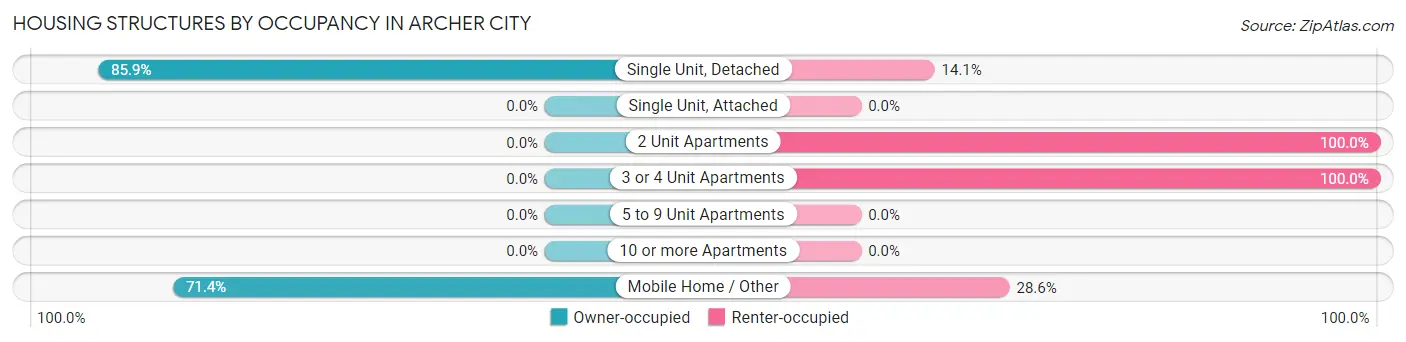
| Structure Type | Owner-occupied | Renter-occupied |
| Single Unit, Detached | 413 (85.9%) | 68 (14.1%) |
| Single Unit, Attached | 0 (0.0%) | 0 (0.0%) |
| 2 Unit Apartments | 0 (0.0%) | 54 (100.0%) |
| 3 or 4 Unit Apartments | 0 (0.0%) | 48 (100.0%) |
| 5 to 9 Unit Apartments | 0 (0.0%) | 0 (0.0%) |
| 10 or more Apartments | 0 (0.0%) | 0 (0.0%) |
| Mobile Home / Other | 35 (71.4%) | 14 (28.6%) |
| Total | 448 (70.9%) | 184 (29.1%) |
Housing Structures by Number of Rooms in Archer City
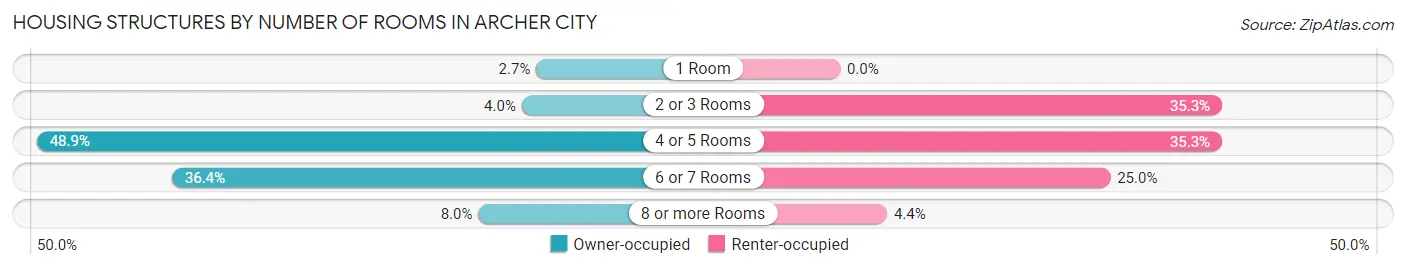
| Number of Rooms | Owner-occupied | Renter-occupied |
| 1 Room | 12 (2.7%) | 0 (0.0%) |
| 2 or 3 Rooms | 18 (4.0%) | 65 (35.3%) |
| 4 or 5 Rooms | 219 (48.9%) | 65 (35.3%) |
| 6 or 7 Rooms | 163 (36.4%) | 46 (25.0%) |
| 8 or more Rooms | 36 (8.0%) | 8 (4.3%) |
| Total | 448 (100.0%) | 184 (100.0%) |
Housing Structure by Heating Type in Archer City
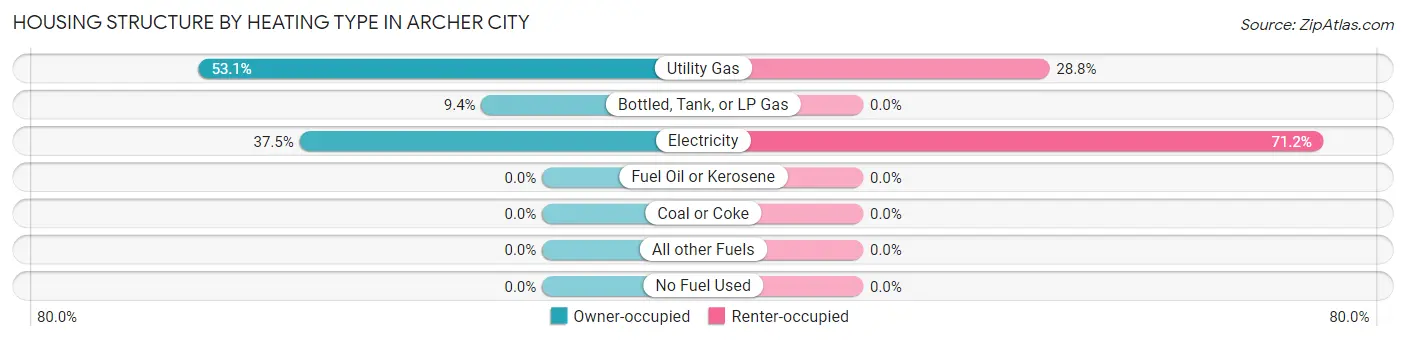
| Heating Type | Owner-occupied | Renter-occupied |
| Utility Gas | 238 (53.1%) | 53 (28.8%) |
| Bottled, Tank, or LP Gas | 42 (9.4%) | 0 (0.0%) |
| Electricity | 168 (37.5%) | 131 (71.2%) |
| Fuel Oil or Kerosene | 0 (0.0%) | 0 (0.0%) |
| Coal or Coke | 0 (0.0%) | 0 (0.0%) |
| All other Fuels | 0 (0.0%) | 0 (0.0%) |
| No Fuel Used | 0 (0.0%) | 0 (0.0%) |
| Total | 448 (100.0%) | 184 (100.0%) |
Household Vehicle Usage in Archer City
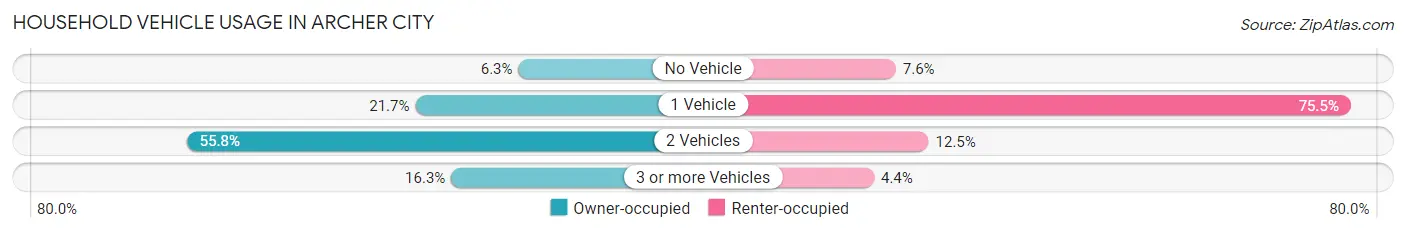
| Vehicles per Household | Owner-occupied | Renter-occupied |
| No Vehicle | 28 (6.2%) | 14 (7.6%) |
| 1 Vehicle | 97 (21.6%) | 139 (75.5%) |
| 2 Vehicles | 250 (55.8%) | 23 (12.5%) |
| 3 or more Vehicles | 73 (16.3%) | 8 (4.3%) |
| Total | 448 (100.0%) | 184 (100.0%) |
Real Estate & Mortgages in Archer City
Real Estate and Mortgage Overview in Archer City
| Characteristic | Without Mortgage | With Mortgage |
| Housing Units | 299 | 149 |
| Median Property Value | $108,800 | $91,900 |
| Median Household Income | $43,854 | $13 |
| Monthly Housing Costs | $578 | $7 |
| Real Estate Taxes | $1,920 | $0 |
Property Value by Mortgage Status in Archer City
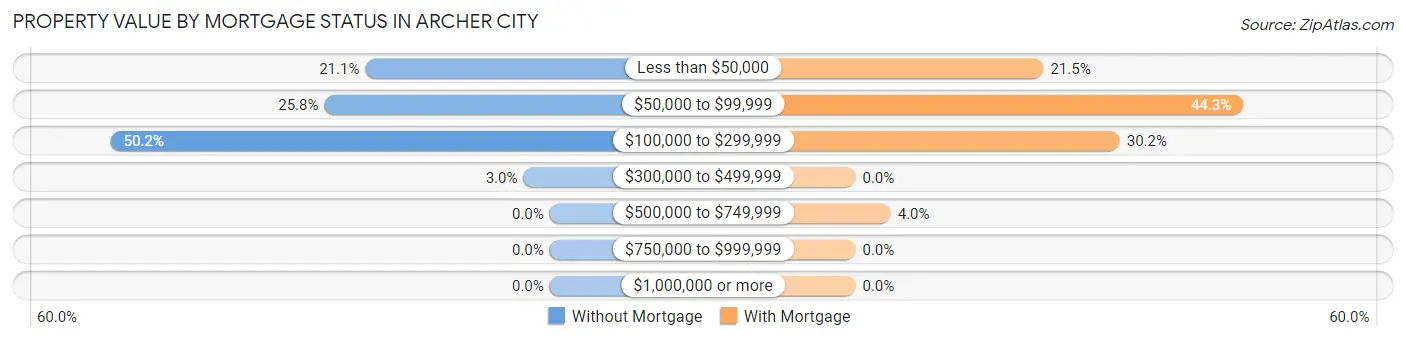
| Property Value | Without Mortgage | With Mortgage |
| Less than $50,000 | 63 (21.1%) | 32 (21.5%) |
| $50,000 to $99,999 | 77 (25.8%) | 66 (44.3%) |
| $100,000 to $299,999 | 150 (50.2%) | 45 (30.2%) |
| $300,000 to $499,999 | 9 (3.0%) | 0 (0.0%) |
| $500,000 to $749,999 | 0 (0.0%) | 6 (4.0%) |
| $750,000 to $999,999 | 0 (0.0%) | 0 (0.0%) |
| $1,000,000 or more | 0 (0.0%) | 0 (0.0%) |
| Total | 299 (100.0%) | 149 (100.0%) |
Household Income by Mortgage Status in Archer City
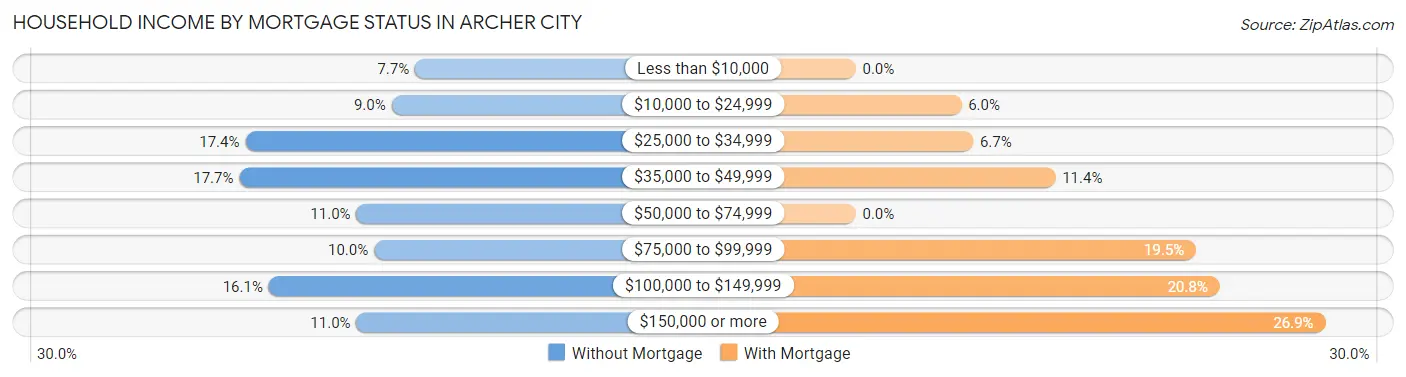
| Household Income | Without Mortgage | With Mortgage |
| Less than $10,000 | 23 (7.7%) | 0 (0.0%) |
| $10,000 to $24,999 | 27 (9.0%) | 9 (6.0%) |
| $25,000 to $34,999 | 52 (17.4%) | 10 (6.7%) |
| $35,000 to $49,999 | 53 (17.7%) | 17 (11.4%) |
| $50,000 to $74,999 | 33 (11.0%) | 0 (0.0%) |
| $75,000 to $99,999 | 30 (10.0%) | 29 (19.5%) |
| $100,000 to $149,999 | 48 (16.1%) | 31 (20.8%) |
| $150,000 or more | 33 (11.0%) | 40 (26.9%) |
| Total | 299 (100.0%) | 149 (100.0%) |
Property Value to Household Income Ratio in Archer City
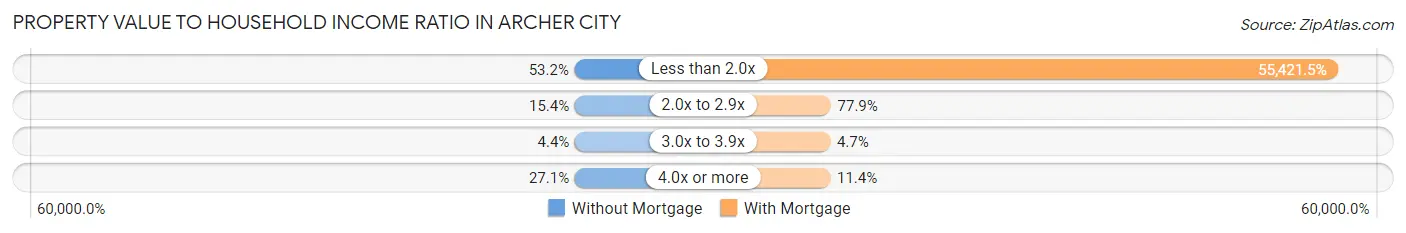
| Value-to-Income Ratio | Without Mortgage | With Mortgage |
| Less than 2.0x | 159 (53.2%) | 82,578 (55,421.5%) |
| 2.0x to 2.9x | 46 (15.4%) | 116 (77.8%) |
| 3.0x to 3.9x | 13 (4.3%) | 7 (4.7%) |
| 4.0x or more | 81 (27.1%) | 17 (11.4%) |
| Total | 299 (100.0%) | 149 (100.0%) |
Real Estate Taxes by Mortgage Status in Archer City
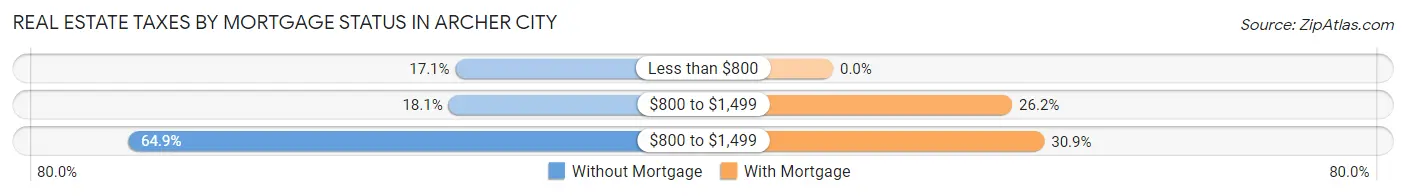
| Property Taxes | Without Mortgage | With Mortgage |
| Less than $800 | 51 (17.1%) | 0 (0.0%) |
| $800 to $1,499 | 54 (18.1%) | 39 (26.2%) |
| $800 to $1,499 | 194 (64.9%) | 46 (30.9%) |
| Total | 299 (100.0%) | 149 (100.0%) |
Health & Disability in Archer City
Health Insurance Coverage by Age in Archer City
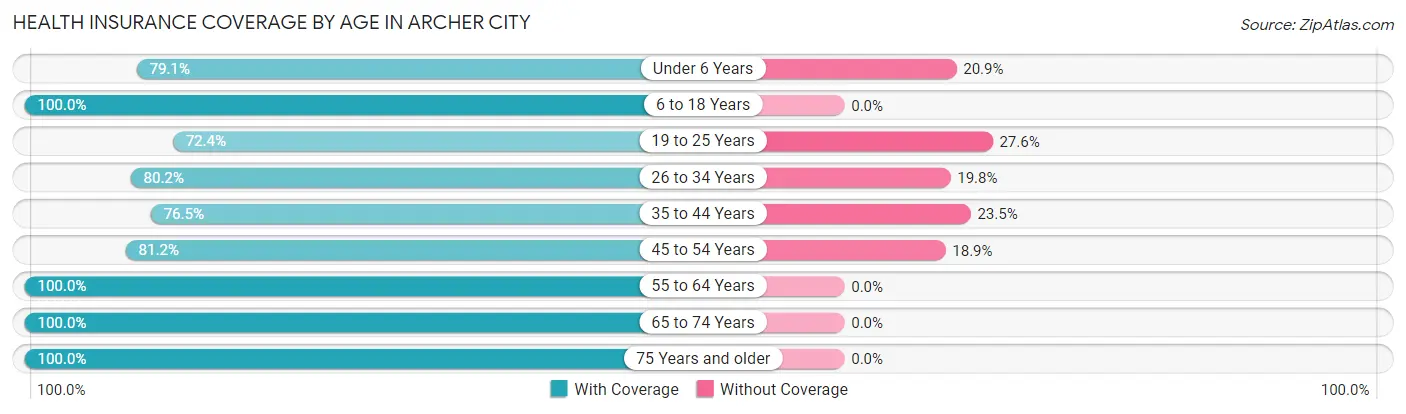
| Age Bracket | With Coverage | Without Coverage |
| Under 6 Years | 72 (79.1%) | 19 (20.9%) |
| 6 to 18 Years | 352 (100.0%) | 0 (0.0%) |
| 19 to 25 Years | 55 (72.4%) | 21 (27.6%) |
| 26 to 34 Years | 138 (80.2%) | 34 (19.8%) |
| 35 to 44 Years | 91 (76.5%) | 28 (23.5%) |
| 45 to 54 Years | 155 (81.1%) | 36 (18.9%) |
| 55 to 64 Years | 230 (100.0%) | 0 (0.0%) |
| 65 to 74 Years | 149 (100.0%) | 0 (0.0%) |
| 75 Years and older | 124 (100.0%) | 0 (0.0%) |
| Total | 1,366 (90.8%) | 138 (9.2%) |
Health Insurance Coverage by Citizenship Status in Archer City
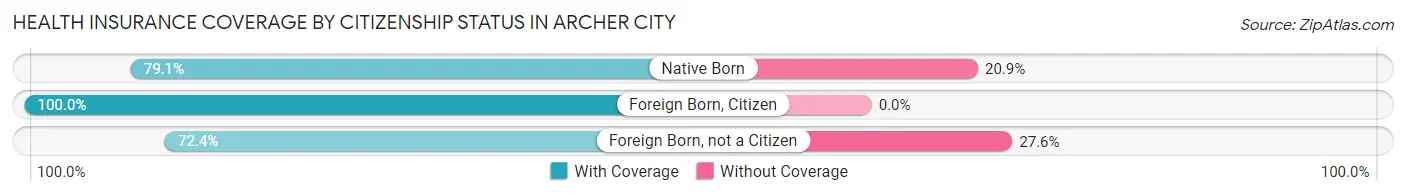
| Citizenship Status | With Coverage | Without Coverage |
| Native Born | 72 (79.1%) | 19 (20.9%) |
| Foreign Born, Citizen | 352 (100.0%) | 0 (0.0%) |
| Foreign Born, not a Citizen | 55 (72.4%) | 21 (27.6%) |
Health Insurance Coverage by Household Income in Archer City
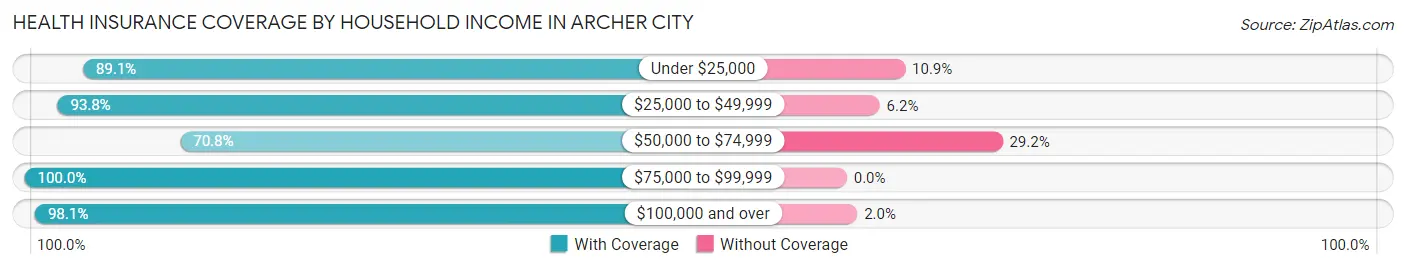
| Household Income | With Coverage | Without Coverage |
| Under $25,000 | 326 (89.1%) | 40 (10.9%) |
| $25,000 to $49,999 | 320 (93.8%) | 21 (6.2%) |
| $50,000 to $74,999 | 170 (70.8%) | 70 (29.2%) |
| $75,000 to $99,999 | 198 (100.0%) | 0 (0.0%) |
| $100,000 and over | 352 (98.1%) | 7 (1.9%) |
Public vs Private Health Insurance Coverage by Age in Archer City
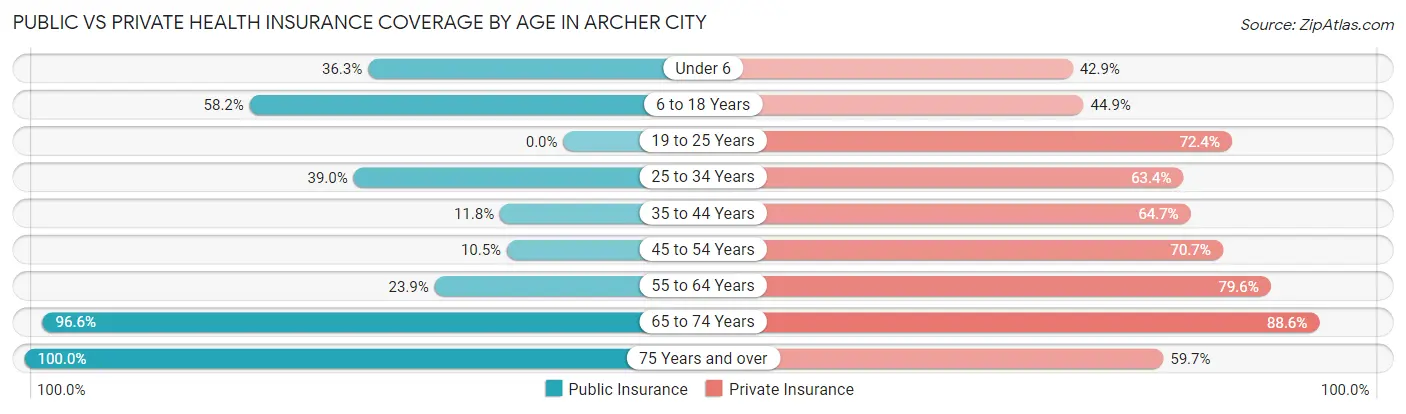
| Age Bracket | Public Insurance | Private Insurance |
| Under 6 | 33 (36.3%) | 39 (42.9%) |
| 6 to 18 Years | 205 (58.2%) | 158 (44.9%) |
| 19 to 25 Years | 0 (0.0%) | 55 (72.4%) |
| 25 to 34 Years | 67 (39.0%) | 109 (63.4%) |
| 35 to 44 Years | 14 (11.8%) | 77 (64.7%) |
| 45 to 54 Years | 20 (10.5%) | 135 (70.7%) |
| 55 to 64 Years | 55 (23.9%) | 183 (79.6%) |
| 65 to 74 Years | 144 (96.6%) | 132 (88.6%) |
| 75 Years and over | 124 (100.0%) | 74 (59.7%) |
| Total | 662 (44.0%) | 962 (64.0%) |
Disability Status by Sex by Age in Archer City
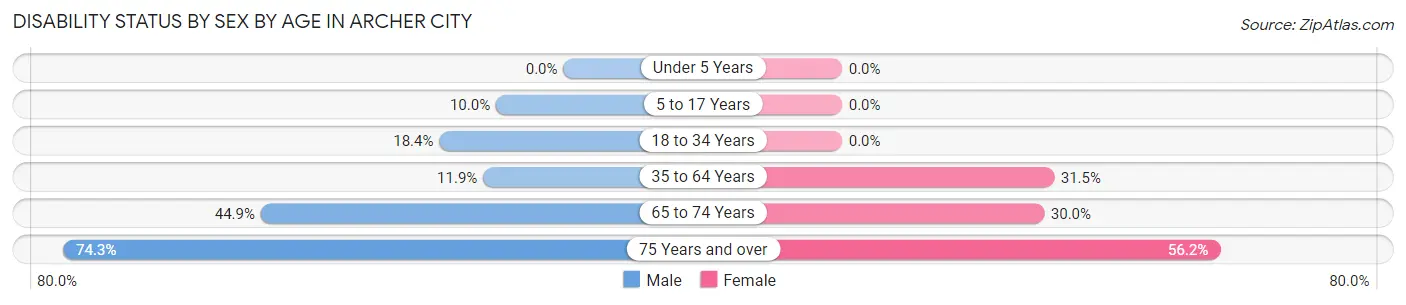
| Age Bracket | Male | Female |
| Under 5 Years | 0 (0.0%) | 0 (0.0%) |
| 5 to 17 Years | 21 (10.0%) | 0 (0.0%) |
| 18 to 34 Years | 21 (18.4%) | 0 (0.0%) |
| 35 to 64 Years | 28 (11.9%) | 96 (31.5%) |
| 65 to 74 Years | 31 (44.9%) | 24 (30.0%) |
| 75 Years and over | 26 (74.3%) | 50 (56.2%) |
Disability Class by Sex by Age in Archer City
Disability Class: Hearing Difficulty
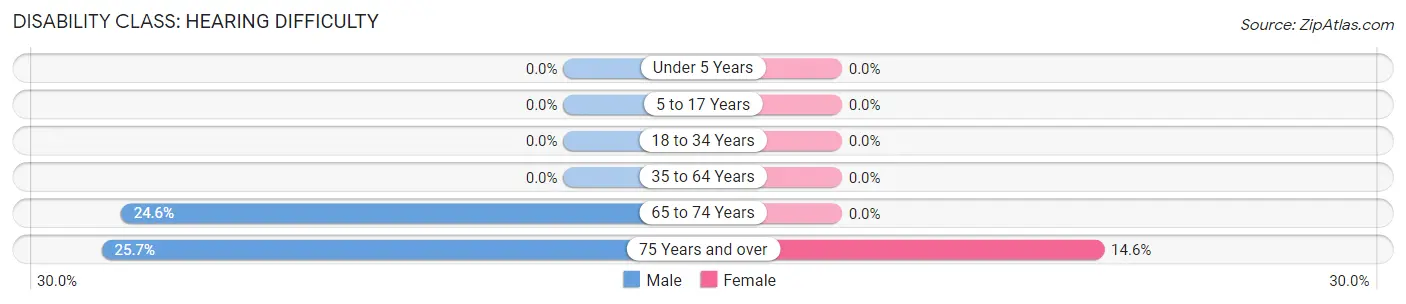
| Age Bracket | Male | Female |
| Under 5 Years | 0 (0.0%) | 0 (0.0%) |
| 5 to 17 Years | 0 (0.0%) | 0 (0.0%) |
| 18 to 34 Years | 0 (0.0%) | 0 (0.0%) |
| 35 to 64 Years | 0 (0.0%) | 0 (0.0%) |
| 65 to 74 Years | 17 (24.6%) | 0 (0.0%) |
| 75 Years and over | 9 (25.7%) | 13 (14.6%) |
Disability Class: Vision Difficulty
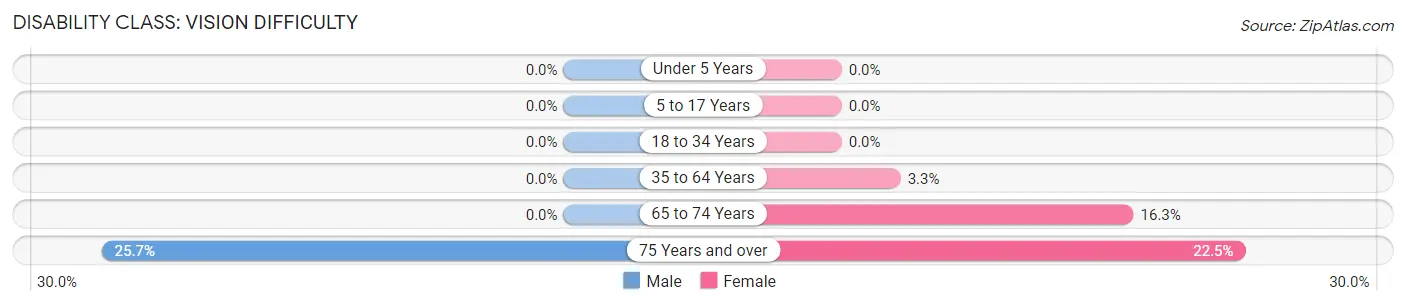
| Age Bracket | Male | Female |
| Under 5 Years | 0 (0.0%) | 0 (0.0%) |
| 5 to 17 Years | 0 (0.0%) | 0 (0.0%) |
| 18 to 34 Years | 0 (0.0%) | 0 (0.0%) |
| 35 to 64 Years | 0 (0.0%) | 10 (3.3%) |
| 65 to 74 Years | 0 (0.0%) | 13 (16.3%) |
| 75 Years and over | 9 (25.7%) | 20 (22.5%) |
Disability Class: Cognitive Difficulty
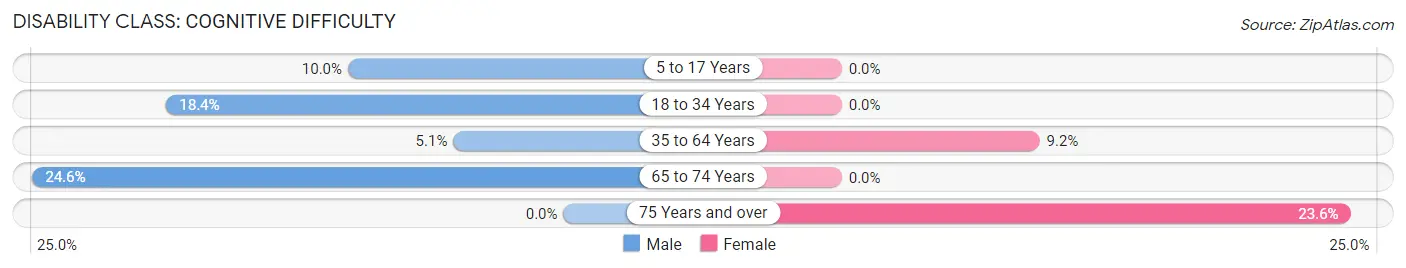
| Age Bracket | Male | Female |
| 5 to 17 Years | 21 (10.0%) | 0 (0.0%) |
| 18 to 34 Years | 21 (18.4%) | 0 (0.0%) |
| 35 to 64 Years | 12 (5.1%) | 28 (9.2%) |
| 65 to 74 Years | 17 (24.6%) | 0 (0.0%) |
| 75 Years and over | 0 (0.0%) | 21 (23.6%) |
Disability Class: Ambulatory Difficulty
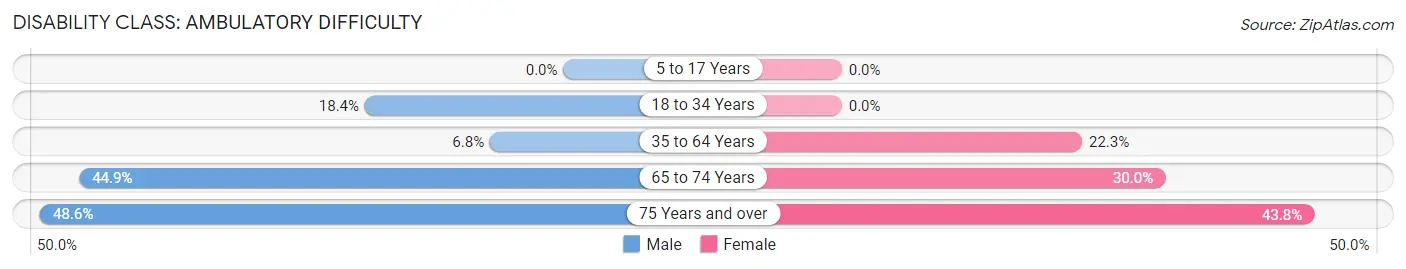
| Age Bracket | Male | Female |
| 5 to 17 Years | 0 (0.0%) | 0 (0.0%) |
| 18 to 34 Years | 21 (18.4%) | 0 (0.0%) |
| 35 to 64 Years | 16 (6.8%) | 68 (22.3%) |
| 65 to 74 Years | 31 (44.9%) | 24 (30.0%) |
| 75 Years and over | 17 (48.6%) | 39 (43.8%) |
Disability Class: Self-Care Difficulty
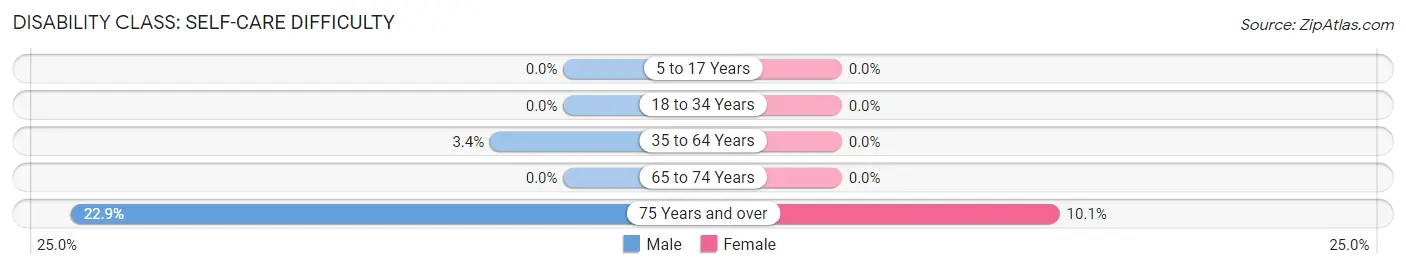
| Age Bracket | Male | Female |
| 5 to 17 Years | 0 (0.0%) | 0 (0.0%) |
| 18 to 34 Years | 0 (0.0%) | 0 (0.0%) |
| 35 to 64 Years | 8 (3.4%) | 0 (0.0%) |
| 65 to 74 Years | 0 (0.0%) | 0 (0.0%) |
| 75 Years and over | 8 (22.9%) | 9 (10.1%) |
Technology Access in Archer City
Computing Device Access in Archer City
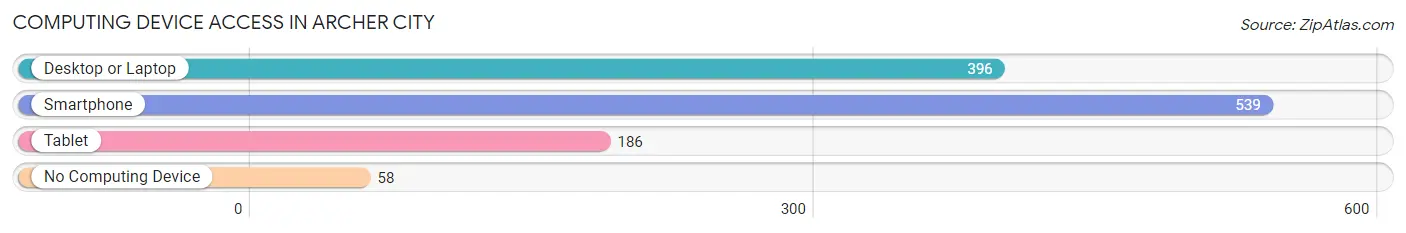
| Device Type | # Households | % Households |
| Desktop or Laptop | 396 | 62.7% |
| Smartphone | 539 | 85.3% |
| Tablet | 186 | 29.4% |
| No Computing Device | 58 | 9.2% |
| Total | 632 | 100.0% |
Internet Access in Archer City
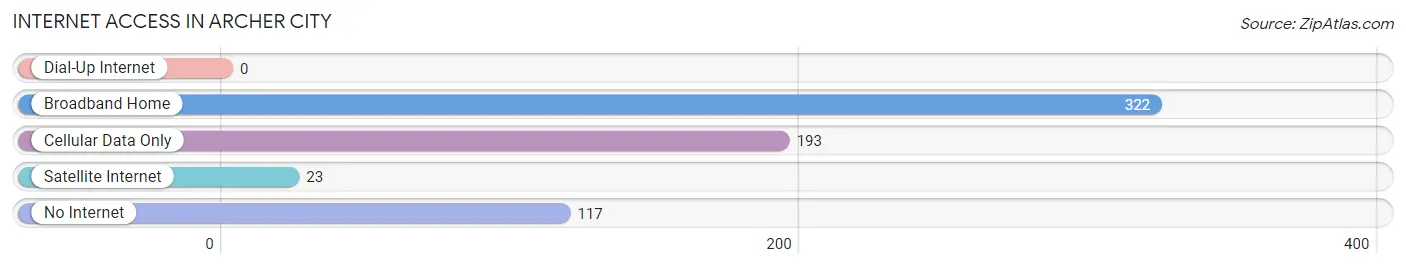
| Internet Type | # Households | % Households |
| Dial-Up Internet | 0 | 0.0% |
| Broadband Home | 322 | 50.9% |
| Cellular Data Only | 193 | 30.5% |
| Satellite Internet | 23 | 3.6% |
| No Internet | 117 | 18.5% |
| Total | 632 | 100.0% |
Archer City Summary
Archer City is a small town located in Archer County, Texas, United States. It is situated in the northern part of the state, about 100 miles northwest of Dallas. The town was founded in 1881 and has a population of 1,834 as of the 2010 census.
History
Archer City was founded in 1881 by a group of settlers from Archer County, Kentucky. The town was named after the county in Kentucky, and the first post office was established in 1882. The town grew slowly, but by the early 1900s, it had become a thriving community with a population of over 1,000.
The town was an important stop on the Texas and Pacific Railway, and it was also the site of a large cattle ranch. In the early 1900s, the town was home to several businesses, including a bank, a hotel, a general store, and a blacksmith shop.
In the 1920s, the town experienced a period of growth, and several new businesses were established. The town also became a popular tourist destination, and several hotels and resorts were built.
In the 1950s, the town experienced a decline in population, and many of the businesses closed. However, the town has since experienced a resurgence, and many of the businesses have reopened.
Geography
Archer City is located in the northern part of Archer County, Texas, about 100 miles northwest of Dallas. The town is situated on the banks of the Wichita River, and it is surrounded by rolling hills and prairies. The town has a total area of 1.3 square miles, all of which is land.
Economy
The economy of Archer City is largely based on agriculture and tourism. The town is home to several farms, and the surrounding area is known for its cattle and sheep ranches. The town is also a popular tourist destination, and it is home to several hotels and resorts.
The town is also home to several small businesses, including a bank, a general store, and a blacksmith shop. The town is also home to several restaurants and bars.
Demographics
As of the 2010 census, the population of Archer City was 1,834. The racial makeup of the town was 94.3% White, 0.3% African American, 0.2% Native American, 0.2% Asian, 0.1% Pacific Islander, 3.3% from other races, and 1.6% from two or more races. Hispanic or Latino of any race were 6.2% of the population.
The median income for a household in the town was $35,000, and the median income for a family was $41,000. The per capita income for the town was $17,000. About 11.2% of families and 14.2% of the population were below the poverty line, including 18.2% of those under age 18 and 8.3% of those age 65 or over.
Common Questions
What is Per Capita Income in Archer City?
Per Capita income in Archer City is $27,096.
What is the Median Family Income in Archer City?
Median Family Income in Archer City is $71,250.
What is the Median Household income in Archer City?
Median Household Income in Archer City is $40,714.
What is Income or Wage Gap in Archer City?
Income or Wage Gap in Archer City is 59.7%.
Women in Archer City earn 40.3 cents for every dollar earned by a man.
What is Inequality or Gini Index in Archer City?
Inequality or Gini Index in Archer City is 0.44.
What is the Total Population of Archer City?
Total Population of Archer City is 1,549.
What is the Total Male Population of Archer City?
Total Male Population of Archer City is 741.
What is the Total Female Population of Archer City?
Total Female Population of Archer City is 808.
What is the Ratio of Males per 100 Females in Archer City?
There are 91.71 Males per 100 Females in Archer City.
What is the Ratio of Females per 100 Males in Archer City?
There are 109.04 Females per 100 Males in Archer City.
What is the Median Population Age in Archer City?
Median Population Age in Archer City is 42.1 Years.
What is the Average Family Size in Archer City
Average Family Size in Archer City is 3.3 People.
What is the Average Household Size in Archer City
Average Household Size in Archer City is 2.4 People.
How Large is the Labor Force in Archer City?
There are 624 People in the Labor Forcein in Archer City.
What is the Percentage of People in the Labor Force in Archer City?
51.6% of People are in the Labor Force in Archer City.