Agua Dulce, TX Map & Demographics
Agua Dulce Map
Agua Dulce Overview
$24,184
PER CAPITA INCOME
$67,750
AVG FAMILY INCOME
$53,173
AVG HOUSEHOLD INCOME
43.7%
WAGE / INCOME GAP [ % ]
56.3¢/ $1
WAGE / INCOME GAP [ $ ]
0.35
INEQUALITY / GINI INDEX
436
TOTAL POPULATION
213
MALE POPULATION
223
FEMALE POPULATION
95.52
MALES / 100 FEMALES
104.69
FEMALES / 100 MALES
43.4
MEDIAN AGE
3.0
AVG FAMILY SIZE
2.7
AVG HOUSEHOLD SIZE
184
LABOR FORCE [ PEOPLE ]
51.1%
PERCENT IN LABOR FORCE
13.0%
UNEMPLOYMENT RATE
Agua Dulce Zip Codes
Agua Dulce Area Codes
Income in Agua Dulce
Income Overview in Agua Dulce
Per Capita Income in Agua Dulce is $24,184, while median incomes of families and households are $67,750 and $53,173 respectively.
| Characteristic | Number | Measure |
| Per Capita Income | 436 | $24,184 |
| Median Family Income | 127 | $67,750 |
| Mean Family Income | 127 | $69,844 |
| Median Household Income | 163 | $53,173 |
| Mean Household Income | 163 | $62,871 |
| Income Deficit | 127 | $0 |
| Wage / Income Gap (%) | 436 | 43.72% |
| Wage / Income Gap ($) | 436 | 56.28¢ per $1 |
| Gini / Inequality Index | 436 | 0.35 |
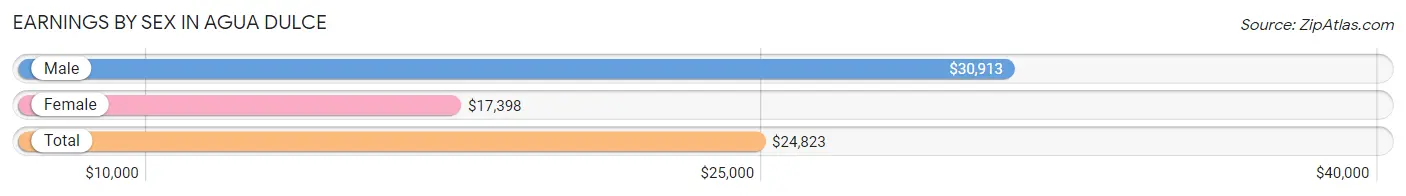
Earnings by Sex in Agua Dulce
Average Earnings in Agua Dulce are $24,823, $30,913 for men and $17,398 for women, a difference of 43.7%.
| Sex | Number | Average Earnings |
| Male | 126 (68.9%) | $30,913 |
| Female | 57 (31.1%) | $17,398 |
| Total | 183 (100.0%) | $24,823 |
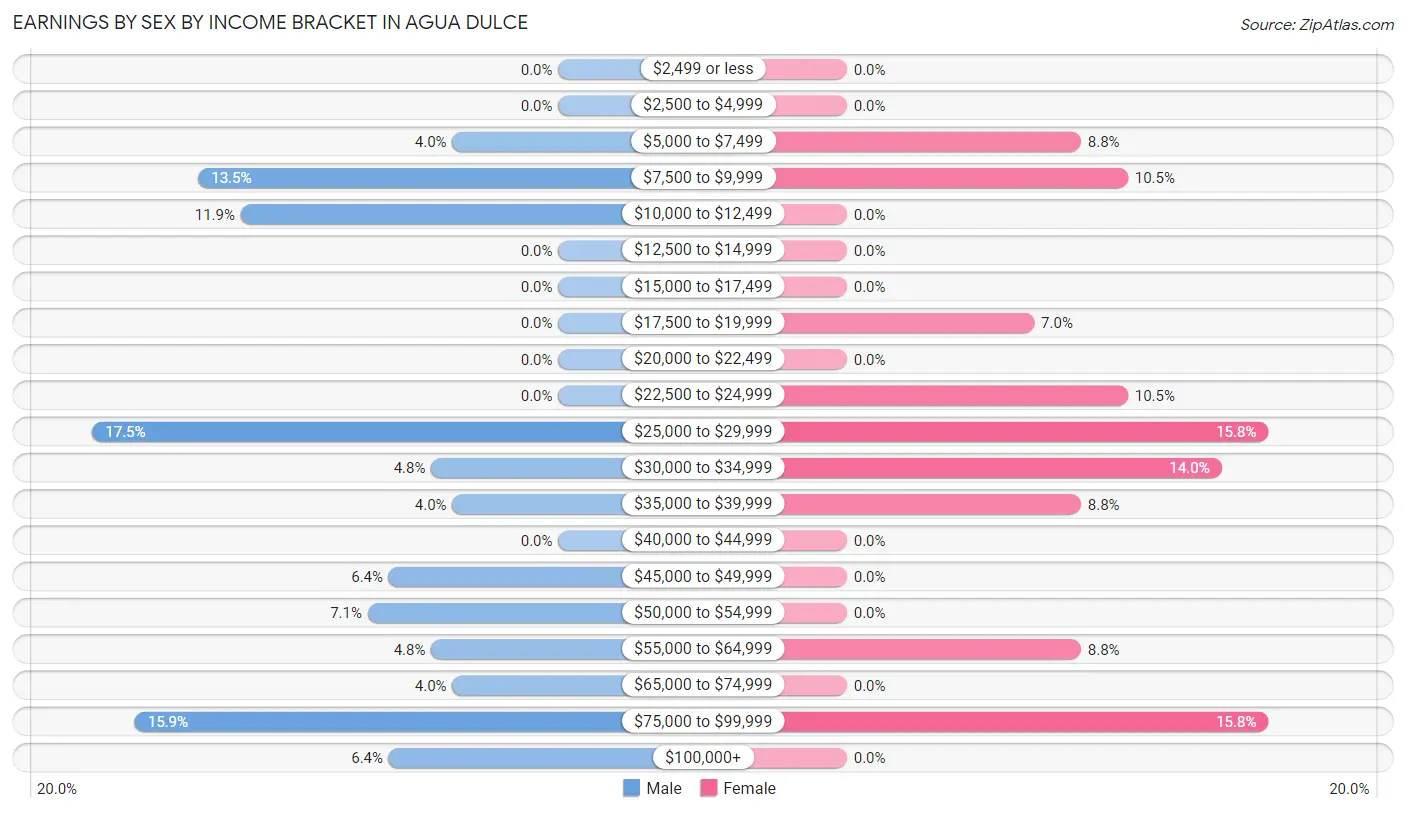
Earnings by Sex by Income Bracket in Agua Dulce
The most common earnings brackets in Agua Dulce are $25,000 to $29,999 for men (22 | 17.5%) and $25,000 to $29,999 for women (9 | 15.8%).
| Income | Male | Female |
| $2,499 or less | 0 (0.0%) | 0 (0.0%) |
| $2,500 to $4,999 | 0 (0.0%) | 0 (0.0%) |
| $5,000 to $7,499 | 5 (4.0%) | 5 (8.8%) |
| $7,500 to $9,999 | 17 (13.5%) | 6 (10.5%) |
| $10,000 to $12,499 | 15 (11.9%) | 0 (0.0%) |
| $12,500 to $14,999 | 0 (0.0%) | 0 (0.0%) |
| $15,000 to $17,499 | 0 (0.0%) | 0 (0.0%) |
| $17,500 to $19,999 | 0 (0.0%) | 4 (7.0%) |
| $20,000 to $22,499 | 0 (0.0%) | 0 (0.0%) |
| $22,500 to $24,999 | 0 (0.0%) | 6 (10.5%) |
| $25,000 to $29,999 | 22 (17.5%) | 9 (15.8%) |
| $30,000 to $34,999 | 6 (4.8%) | 8 (14.0%) |
| $35,000 to $39,999 | 5 (4.0%) | 5 (8.8%) |
| $40,000 to $44,999 | 0 (0.0%) | 0 (0.0%) |
| $45,000 to $49,999 | 8 (6.4%) | 0 (0.0%) |
| $50,000 to $54,999 | 9 (7.1%) | 0 (0.0%) |
| $55,000 to $64,999 | 6 (4.8%) | 5 (8.8%) |
| $65,000 to $74,999 | 5 (4.0%) | 0 (0.0%) |
| $75,000 to $99,999 | 20 (15.9%) | 9 (15.8%) |
| $100,000+ | 8 (6.4%) | 0 (0.0%) |
| Total | 126 (100.0%) | 57 (100.0%) |
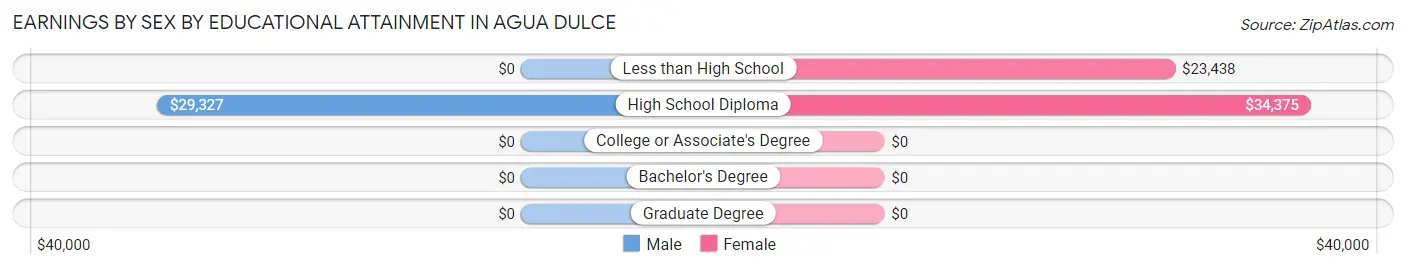
Earnings by Sex by Educational Attainment in Agua Dulce
Average earnings in Agua Dulce are $37,750 for men and $29,583 for women, a difference of 21.6%. Men with an educational attainment of high school diploma enjoy the highest average annual earnings of $29,327, while those with high school diploma education earn the least with $29,327. Women with an educational attainment of high school diploma earn the most with the average annual earnings of $34,375, while those with less than high school education have the smallest earnings of $23,438.
| Educational Attainment | Male Income | Female Income |
| Less than High School | - | - |
| High School Diploma | $29,327 | $34,375 |
| College or Associate's Degree | - | - |
| Bachelor's Degree | - | - |
| Graduate Degree | - | - |
| Total | $37,750 | $29,583 |
Family Income in Agua Dulce
Family Income Brackets in Agua Dulce
According to the Agua Dulce family income data, there are 31 families falling into the $35,000 to $49,999 income range, which is the most common income bracket and makes up 24.4% of all families.
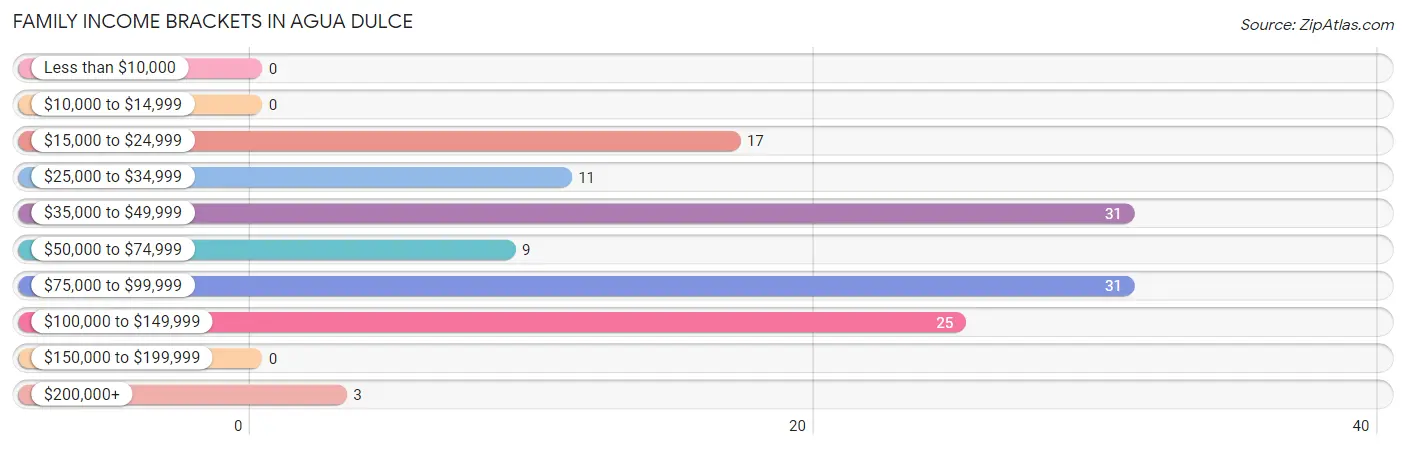
| Income Bracket | # Families | % Families |
| Less than $10,000 | 0 | 0.0% |
| $10,000 to $14,999 | 0 | 0.0% |
| $15,000 to $24,999 | 17 | 13.4% |
| $25,000 to $34,999 | 11 | 8.7% |
| $35,000 to $49,999 | 31 | 24.4% |
| $50,000 to $74,999 | 9 | 7.1% |
| $75,000 to $99,999 | 31 | 24.4% |
| $100,000 to $149,999 | 25 | 19.7% |
| $150,000 to $199,999 | 0 | 0.0% |
| $200,000+ | 3 | 2.4% |
Family Income by Famaliy Size in Agua Dulce
2-person families (59 | 46.5%) account for the highest median family income in Agua Dulce with $68,250 per family, while 2-person families (59 | 46.5%) have the highest median income of $34,125 per family member.
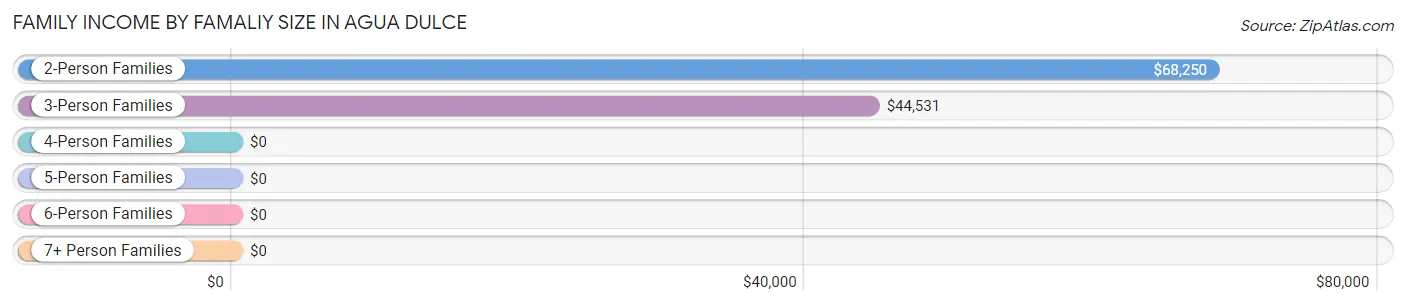
| Income Bracket | # Families | Median Income |
| 2-Person Families | 59 (46.5%) | $68,250 |
| 3-Person Families | 45 (35.4%) | $44,531 |
| 4-Person Families | 11 (8.7%) | $0 |
| 5-Person Families | 12 (9.5%) | $0 |
| 6-Person Families | 0 (0.0%) | $0 |
| 7+ Person Families | 0 (0.0%) | $0 |
| Total | 127 (100.0%) | $67,750 |
Family Income by Number of Earners in Agua Dulce
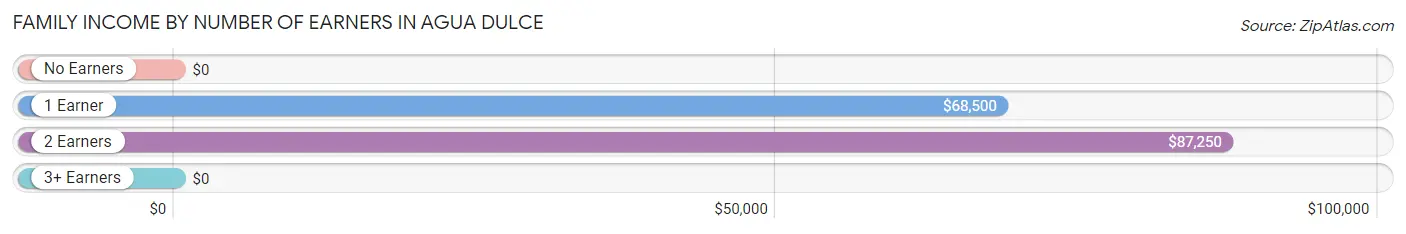
| Number of Earners | # Families | Median Income |
| No Earners | 28 (22.1%) | $0 |
| 1 Earner | 52 (40.9%) | $68,500 |
| 2 Earners | 47 (37.0%) | $87,250 |
| 3+ Earners | 0 (0.0%) | $0 |
| Total | 127 (100.0%) | $67,750 |
Household Income in Agua Dulce
Household Income Brackets in Agua Dulce
With 37 households falling in the category, the $15,000 to $24,999 income range is the most frequent in Agua Dulce, accounting for 22.7% of all households.
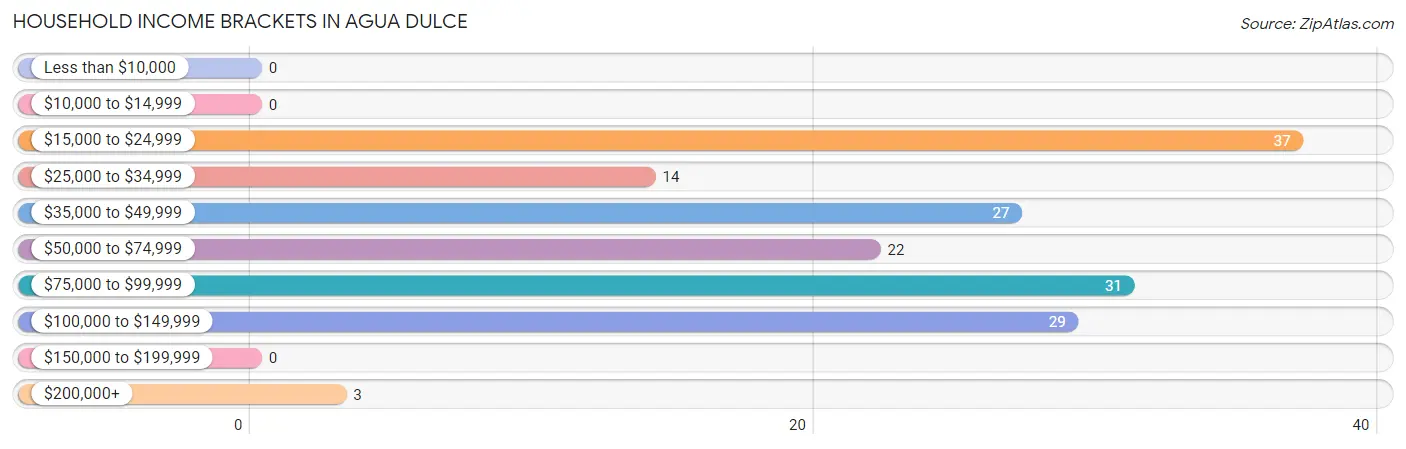
| Income Bracket | # Households | % Households |
| Less than $10,000 | 0 | 0.0% |
| $10,000 to $14,999 | 0 | 0.0% |
| $15,000 to $24,999 | 37 | 22.7% |
| $25,000 to $34,999 | 14 | 8.6% |
| $35,000 to $49,999 | 27 | 16.6% |
| $50,000 to $74,999 | 22 | 13.5% |
| $75,000 to $99,999 | 31 | 19.0% |
| $100,000 to $149,999 | 29 | 17.8% |
| $150,000 to $199,999 | 0 | 0.0% |
| $200,000+ | 3 | 1.8% |
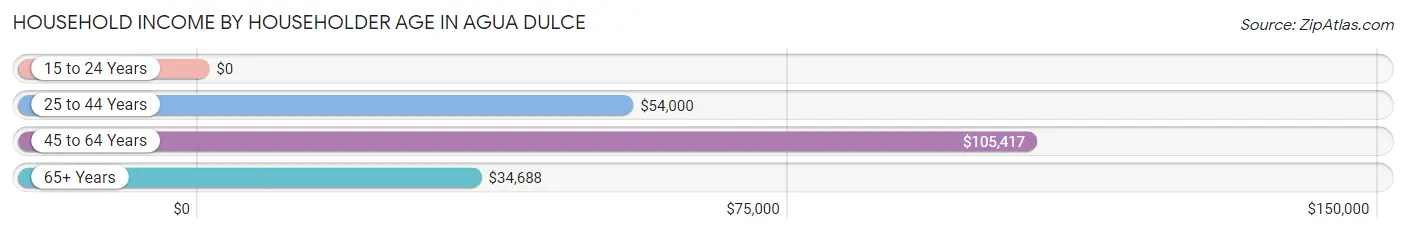
Household Income by Householder Age in Agua Dulce
The median household income in Agua Dulce is $53,173, with the highest median household income of $105,417 found in the 45 to 64 years age bracket for the primary householder. A total of 43 households (26.4%) fall into this category.
| Income Bracket | # Households | Median Income |
| 15 to 24 Years | 0 (0.0%) | $0 |
| 25 to 44 Years | 44 (27.0%) | $54,000 |
| 45 to 64 Years | 43 (26.4%) | $105,417 |
| 65+ Years | 76 (46.6%) | $34,688 |
| Total | 163 (100.0%) | $53,173 |
Poverty in Agua Dulce
Income Below Poverty by Sex and Age in Agua Dulce
With 7.0% poverty level for males and 7.2% for females among the residents of Agua Dulce, 15 year old males and 25 to 34 year old females are the most vulnerable to poverty, with 6 males (42.9%) and 6 females (25.0%) in their respective age groups living below the poverty level.
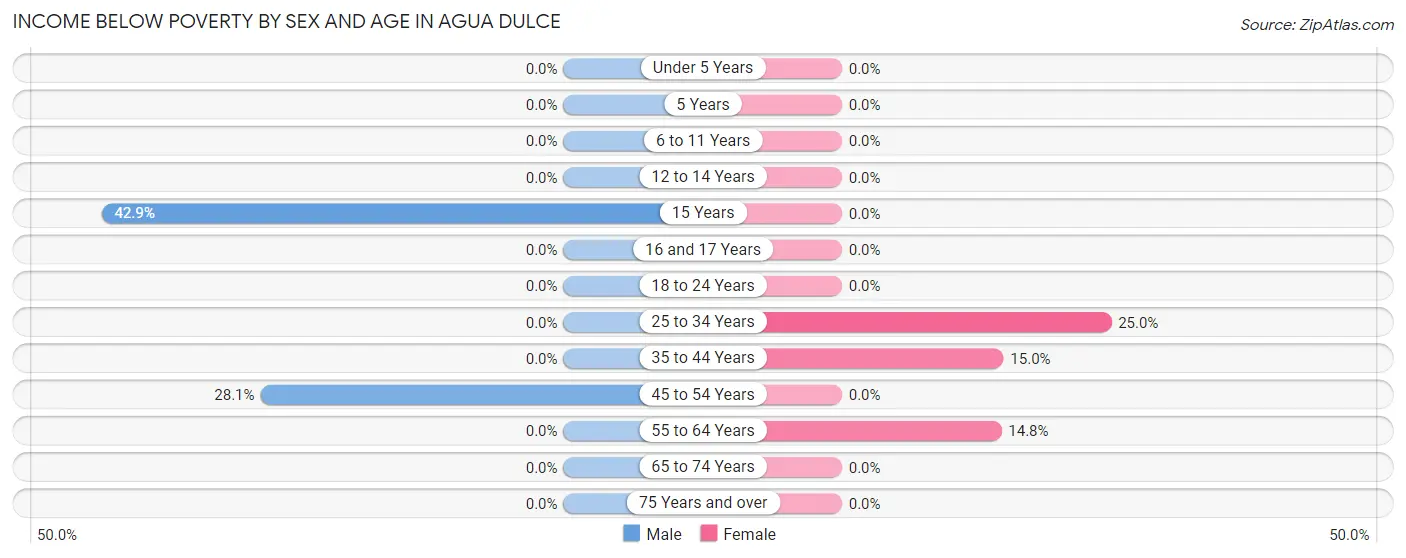
| Age Bracket | Male | Female |
| Under 5 Years | 0 (0.0%) | 0 (0.0%) |
| 5 Years | 0 (0.0%) | 0 (0.0%) |
| 6 to 11 Years | 0 (0.0%) | 0 (0.0%) |
| 12 to 14 Years | 0 (0.0%) | 0 (0.0%) |
| 15 Years | 6 (42.9%) | 0 (0.0%) |
| 16 and 17 Years | 0 (0.0%) | 0 (0.0%) |
| 18 to 24 Years | 0 (0.0%) | 0 (0.0%) |
| 25 to 34 Years | 0 (0.0%) | 6 (25.0%) |
| 35 to 44 Years | 0 (0.0%) | 6 (15.0%) |
| 45 to 54 Years | 9 (28.1%) | 0 (0.0%) |
| 55 to 64 Years | 0 (0.0%) | 4 (14.8%) |
| 65 to 74 Years | 0 (0.0%) | 0 (0.0%) |
| 75 Years and over | 0 (0.0%) | 0 (0.0%) |
| Total | 15 (7.0%) | 16 (7.2%) |
Income Above Poverty by Sex and Age in Agua Dulce
According to the poverty statistics in Agua Dulce, males aged under 5 years and females aged under 5 years are the age groups that are most secure financially, with 100.0% of males and 100.0% of females in these age groups living above the poverty line.
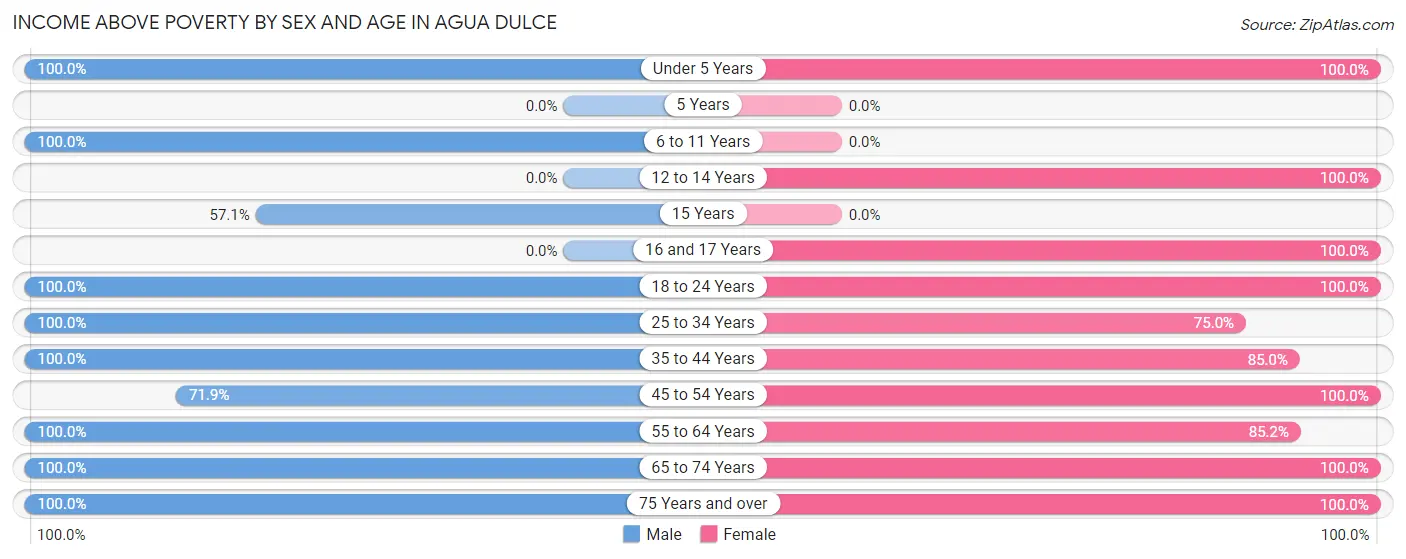
| Age Bracket | Male | Female |
| Under 5 Years | 24 (100.0%) | 23 (100.0%) |
| 5 Years | 0 (0.0%) | 0 (0.0%) |
| 6 to 11 Years | 9 (100.0%) | 0 (0.0%) |
| 12 to 14 Years | 0 (0.0%) | 6 (100.0%) |
| 15 Years | 8 (57.1%) | 0 (0.0%) |
| 16 and 17 Years | 0 (0.0%) | 13 (100.0%) |
| 18 to 24 Years | 9 (100.0%) | 6 (100.0%) |
| 25 to 34 Years | 13 (100.0%) | 18 (75.0%) |
| 35 to 44 Years | 43 (100.0%) | 34 (85.0%) |
| 45 to 54 Years | 23 (71.9%) | 13 (100.0%) |
| 55 to 64 Years | 19 (100.0%) | 23 (85.2%) |
| 65 to 74 Years | 33 (100.0%) | 44 (100.0%) |
| 75 Years and over | 17 (100.0%) | 27 (100.0%) |
| Total | 198 (93.0%) | 207 (92.8%) |
Income Below Poverty Among Married-Couple Families in Agua Dulce
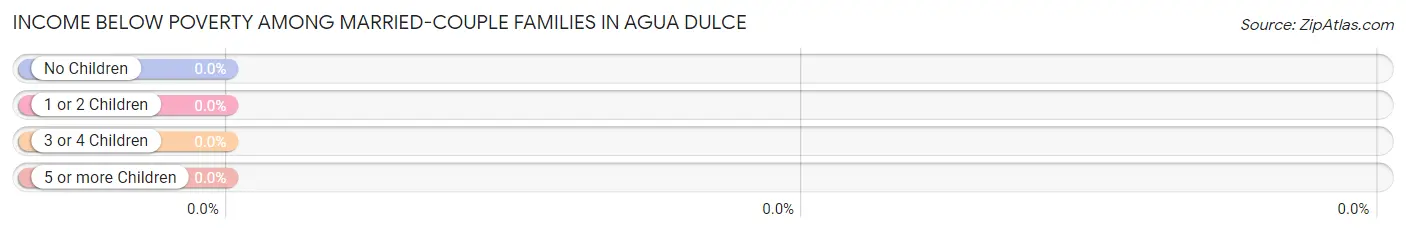
| Children | Above Poverty | Below Poverty |
| No Children | 65 (100.0%) | 0 (0.0%) |
| 1 or 2 Children | 18 (100.0%) | 0 (0.0%) |
| 3 or 4 Children | 12 (100.0%) | 0 (0.0%) |
| 5 or more Children | 0 (0.0%) | 0 (0.0%) |
| Total | 95 (100.0%) | 0 (0.0%) |
Income Below Poverty Among Single-Parent Households in Agua Dulce
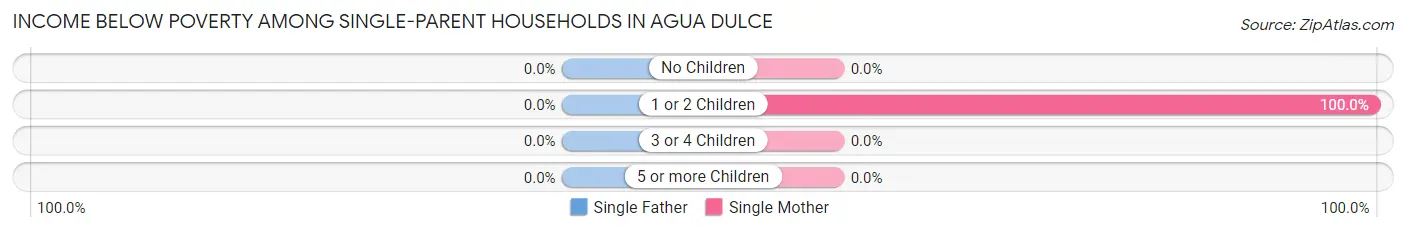
| Children | Single Father | Single Mother |
| No Children | 0 (0.0%) | 0 (0.0%) |
| 1 or 2 Children | 0 (0.0%) | 6 (100.0%) |
| 3 or 4 Children | 0 (0.0%) | 0 (0.0%) |
| 5 or more Children | 0 (0.0%) | 0 (0.0%) |
| Total | 0 (0.0%) | 6 (28.6%) |
Income Below Poverty Among Married-Couple vs Single-Parent Households in Agua Dulce
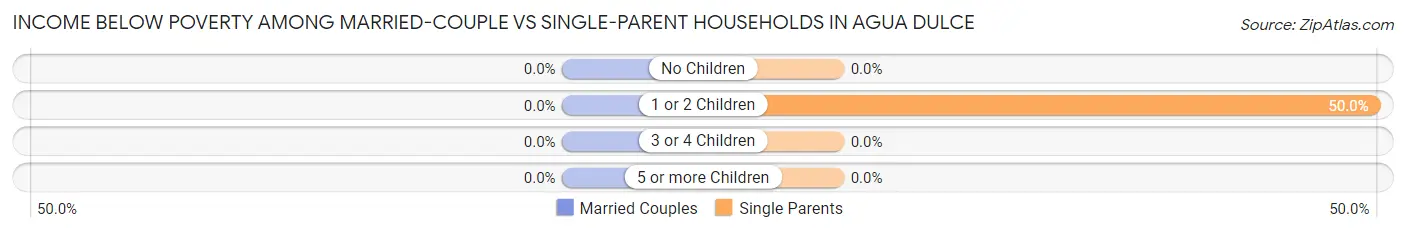
| Children | Married-Couple Families | Single-Parent Households |
| No Children | 0 (0.0%) | 0 (0.0%) |
| 1 or 2 Children | 0 (0.0%) | 6 (50.0%) |
| 3 or 4 Children | 0 (0.0%) | 0 (0.0%) |
| 5 or more Children | 0 (0.0%) | 0 (0.0%) |
| Total | 0 (0.0%) | 6 (18.8%) |
Race in Agua Dulce
The most populous races in Agua Dulce are White / Caucasian (377 | 86.5%), Hispanic or Latino (306 | 70.2%), and Two or more Races (59 | 13.5%).
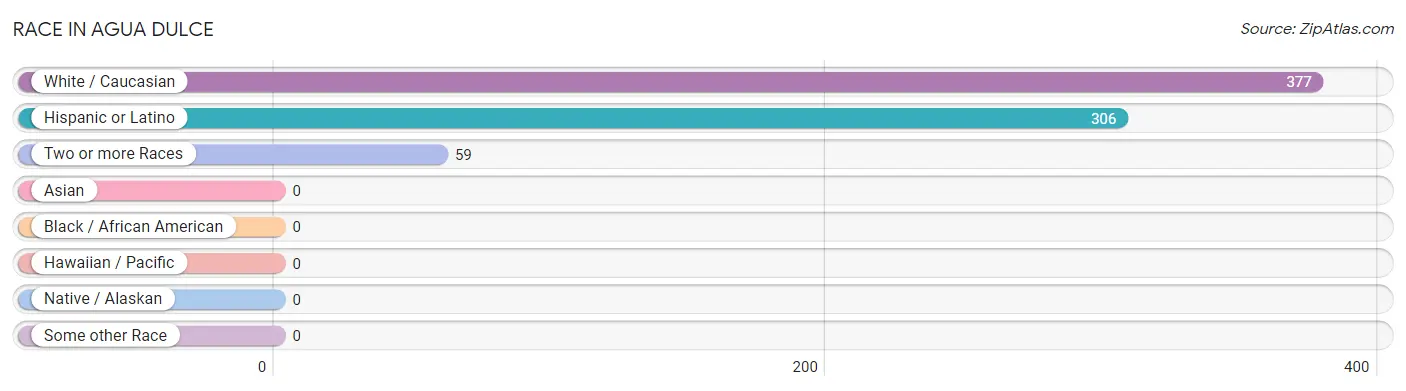
| Race | # Population | % Population |
| Asian | 0 | 0.0% |
| Black / African American | 0 | 0.0% |
| Hawaiian / Pacific | 0 | 0.0% |
| Hispanic or Latino | 306 | 70.2% |
| Native / Alaskan | 0 | 0.0% |
| White / Caucasian | 377 | 86.5% |
| Two or more Races | 59 | 13.5% |
| Some other Race | 0 | 0.0% |
| Total | 436 | 100.0% |
Ancestry in Agua Dulce
The most populous ancestries reported in Agua Dulce are Mexican (306 | 70.2%), German (37 | 8.5%), Irish (22 | 5.1%), French (9 | 2.1%), and Scottish (6 | 1.4%), together accounting for 87.2% of all Agua Dulce residents.
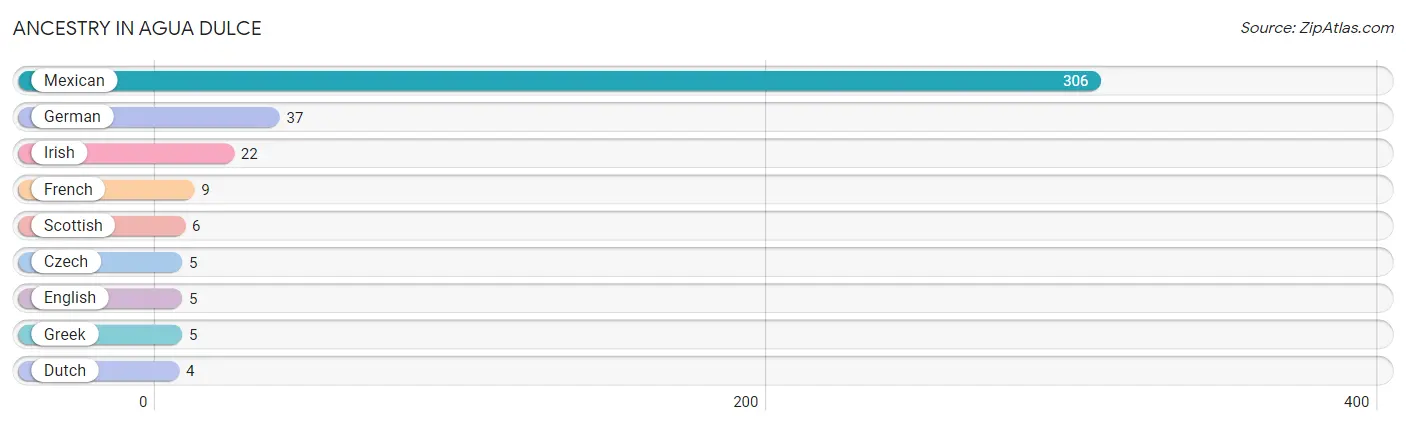
| Ancestry | # Population | % Population |
| Czech | 5 | 1.1% |
| Dutch | 4 | 0.9% |
| English | 5 | 1.1% |
| French | 9 | 2.1% |
| German | 37 | 8.5% |
| Greek | 5 | 1.1% |
| Irish | 22 | 5.1% |
| Mexican | 306 | 70.2% |
| Scottish | 6 | 1.4% | View All 9 Rows |
Immigrants in Agua Dulce
The most numerous immigrant groups reported in Agua Dulce came from Central America (3 | 0.7%), Latin America (3 | 0.7%), and Mexico (3 | 0.7%), together accounting for 2.1% of all Agua Dulce residents.
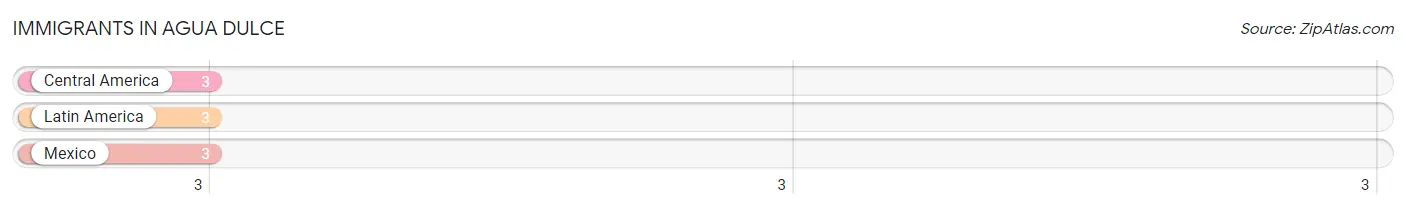
| Immigration Origin | # Population | % Population |
| Central America | 3 | 0.7% |
| Latin America | 3 | 0.7% |
| Mexico | 3 | 0.7% | View All 3 Rows |
Sex and Age in Agua Dulce
Sex and Age in Agua Dulce
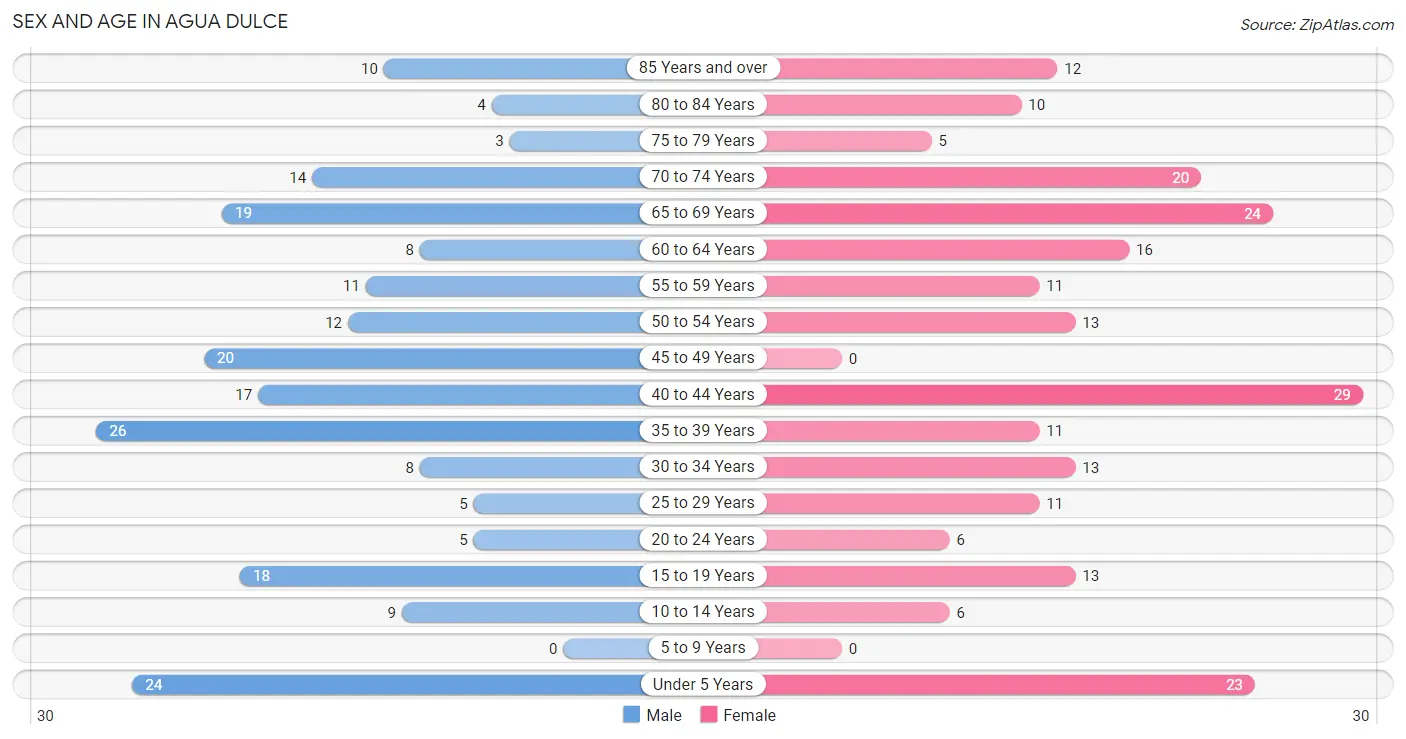
The most populous age groups in Agua Dulce are 35 to 39 Years (26 | 12.2%) for men and 40 to 44 Years (29 | 13.0%) for women.
| Age Bracket | Male | Female |
| Under 5 Years | 24 (11.3%) | 23 (10.3%) |
| 5 to 9 Years | 0 (0.0%) | 0 (0.0%) |
| 10 to 14 Years | 9 (4.2%) | 6 (2.7%) |
| 15 to 19 Years | 18 (8.5%) | 13 (5.8%) |
| 20 to 24 Years | 5 (2.4%) | 6 (2.7%) |
| 25 to 29 Years | 5 (2.4%) | 11 (4.9%) |
| 30 to 34 Years | 8 (3.8%) | 13 (5.8%) |
| 35 to 39 Years | 26 (12.2%) | 11 (4.9%) |
| 40 to 44 Years | 17 (8.0%) | 29 (13.0%) |
| 45 to 49 Years | 20 (9.4%) | 0 (0.0%) |
| 50 to 54 Years | 12 (5.6%) | 13 (5.8%) |
| 55 to 59 Years | 11 (5.2%) | 11 (4.9%) |
| 60 to 64 Years | 8 (3.8%) | 16 (7.2%) |
| 65 to 69 Years | 19 (8.9%) | 24 (10.8%) |
| 70 to 74 Years | 14 (6.6%) | 20 (9.0%) |
| 75 to 79 Years | 3 (1.4%) | 5 (2.2%) |
| 80 to 84 Years | 4 (1.9%) | 10 (4.5%) |
| 85 Years and over | 10 (4.7%) | 12 (5.4%) |
| Total | 213 (100.0%) | 223 (100.0%) |
Families and Households in Agua Dulce
Median Family Size in Agua Dulce
The median family size in Agua Dulce is 3.00 persons per family, with single male/father families (11 | 8.7%) accounting for the largest median family size of 3.18 persons per family. On the other hand, single female/mother families (21 | 16.5%) represent the smallest median family size with 2.90 persons per family.
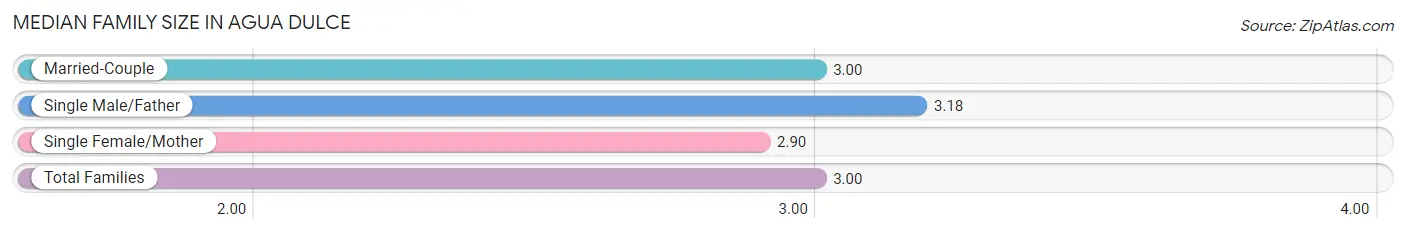
| Family Type | # Families | Family Size |
| Married-Couple | 95 (74.8%) | 3.00 |
| Single Male/Father | 11 (8.7%) | 3.18 |
| Single Female/Mother | 21 (16.5%) | 2.90 |
| Total Families | 127 (100.0%) | 3.00 |
Median Household Size in Agua Dulce
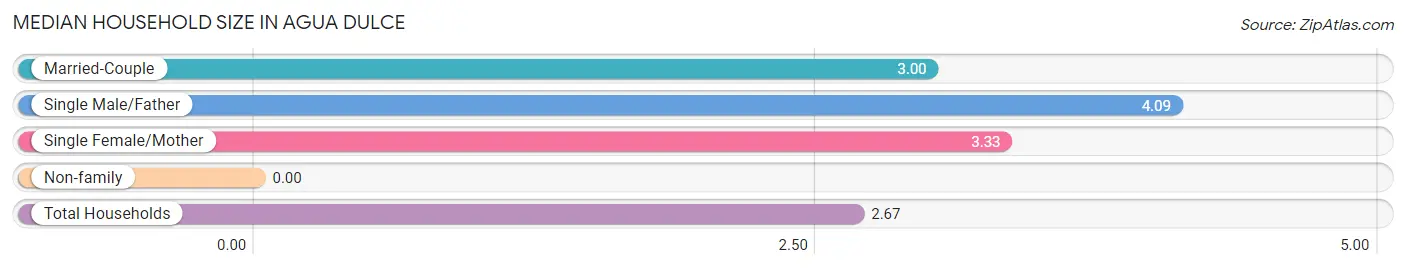
| Household Type | # Households | Household Size |
| Married-Couple | 95 (58.3%) | 3.00 |
| Single Male/Father | 11 (6.8%) | 4.09 |
| Single Female/Mother | 21 (12.9%) | 3.33 |
| Non-family | 36 (22.1%) | - |
| Total Households | 163 (100.0%) | 2.67 |
Household Size by Marriage Status in Agua Dulce
Out of a total of 163 households in Agua Dulce, 127 (77.9%) are family households, while 36 (22.1%) are nonfamily households. The most numerous type of family households are 2-person households, comprising 59, and the most common type of nonfamily households are 1-person households, comprising 36.
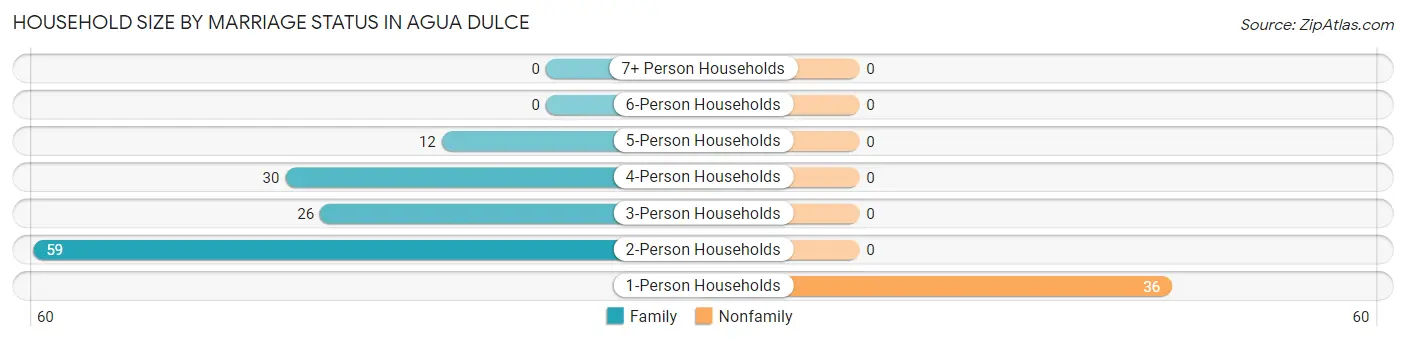
| Household Size | Family Households | Nonfamily Households |
| 1-Person Households | - | 36 (22.1%) |
| 2-Person Households | 59 (36.2%) | 0 (0.0%) |
| 3-Person Households | 26 (16.0%) | 0 (0.0%) |
| 4-Person Households | 30 (18.4%) | 0 (0.0%) |
| 5-Person Households | 12 (7.4%) | 0 (0.0%) |
| 6-Person Households | 0 (0.0%) | 0 (0.0%) |
| 7+ Person Households | 0 (0.0%) | 0 (0.0%) |
| Total | 127 (77.9%) | 36 (22.1%) |
Female Fertility in Agua Dulce
Fertility by Age in Agua Dulce
Average fertility rate in Agua Dulce is 289.0 births per 1,000 women. Women in the age bracket of 20 to 34 years have the highest fertility rate with 567.0 births per 1,000 women. Women in the age bracket of 20 to 34 years acount for 70.8% of all women with births.
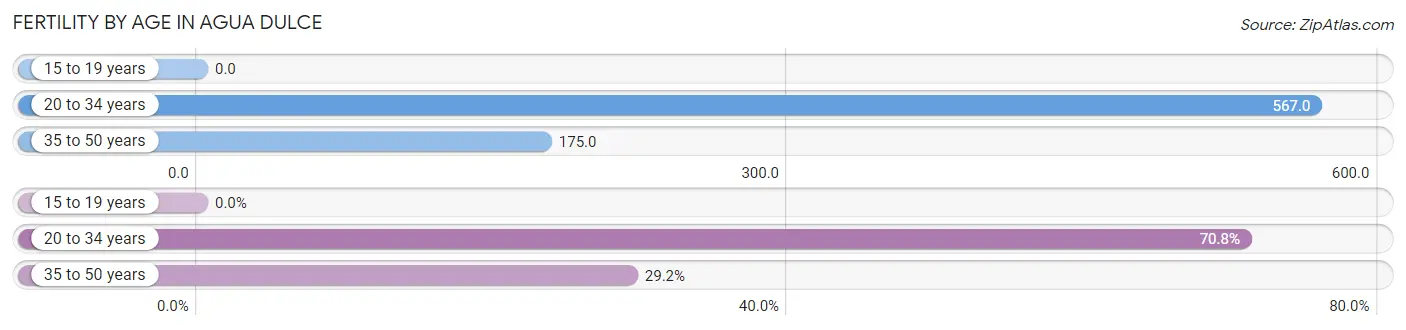
| Age Bracket | Women with Births | Births / 1,000 Women |
| 15 to 19 years | 0 (0.0%) | 0.0 |
| 20 to 34 years | 17 (70.8%) | 567.0 |
| 35 to 50 years | 7 (29.2%) | 175.0 |
| Total | 24 (100.0%) | 289.0 |
Fertility by Age by Marriage Status in Agua Dulce
50.0% of women with births (24) in Agua Dulce are married. The highest percentage of unmarried women with births falls into 20 to 34 years age bracket with 70.6% of them unmarried at the time of birth, while the lowest percentage of unmarried women with births belong to 35 to 50 years age bracket with 0.0% of them unmarried.
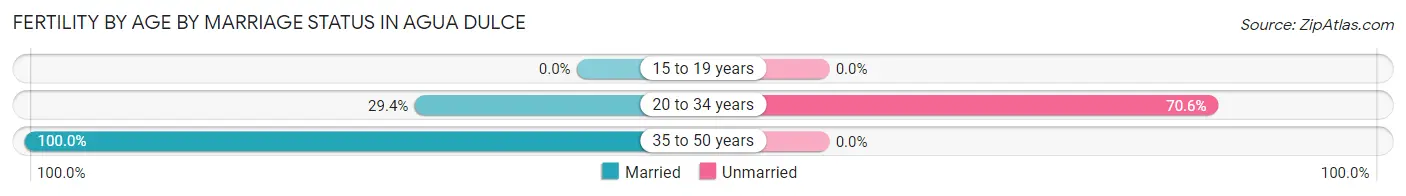
| Age Bracket | Married | Unmarried |
| 15 to 19 years | 0 (0.0%) | 0 (0.0%) |
| 20 to 34 years | 5 (29.4%) | 12 (70.6%) |
| 35 to 50 years | 7 (100.0%) | 0 (0.0%) |
| Total | 12 (50.0%) | 12 (50.0%) |
Fertility by Education in Agua Dulce
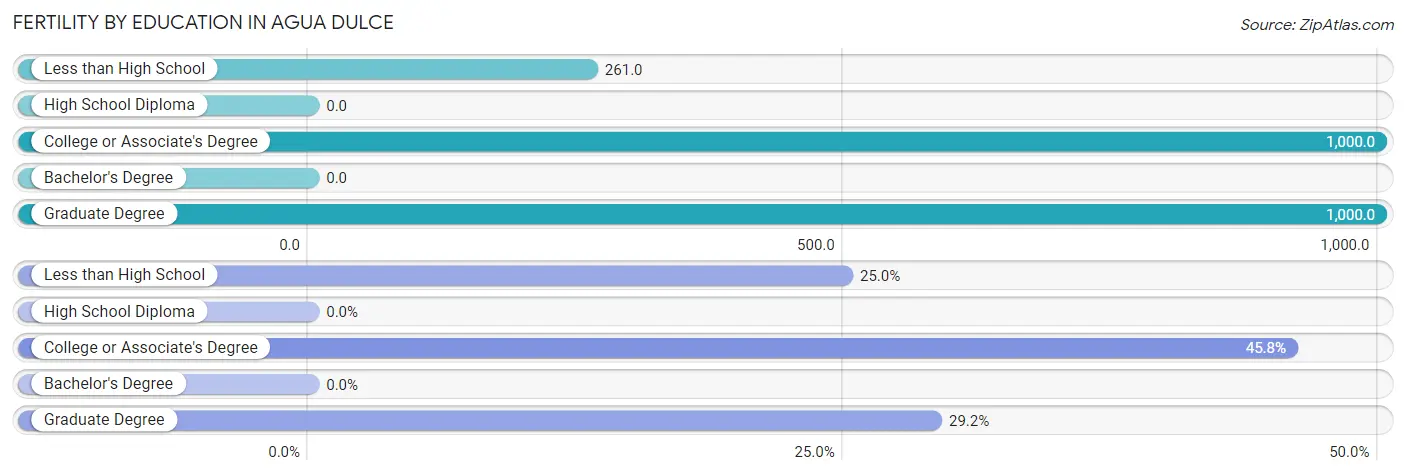
| Educational Attainment | Women with Births | Births / 1,000 Women |
| Less than High School | 6 (25.0%) | 261.0 |
| High School Diploma | 0 (0.0%) | 0.0 |
| College or Associate's Degree | 11 (45.8%) | 1,000.0 |
| Bachelor's Degree | 0 (0.0%) | 0.0 |
| Graduate Degree | 7 (29.2%) | 1,000.0 |
| Total | 24 (100.0%) | 289.0 |
Fertility by Education by Marriage Status in Agua Dulce
50.0% of women with births in Agua Dulce are unmarried. Women with the educational attainment of graduate degree are most likely to be married with 100.0% of them married at childbirth, while women with the educational attainment of less than high school are least likely to be married with 100.0% of them unmarried at childbirth.
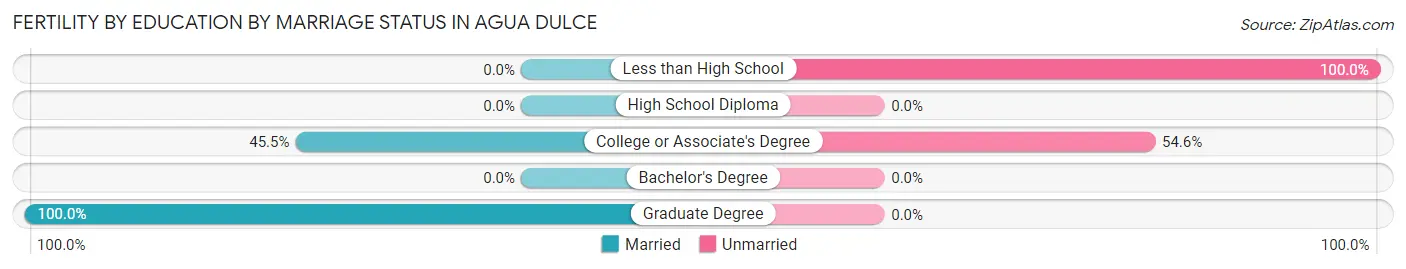
| Educational Attainment | Married | Unmarried |
| Less than High School | 0 (0.0%) | 6 (100.0%) |
| High School Diploma | 0 (0.0%) | 0 (0.0%) |
| College or Associate's Degree | 5 (45.5%) | 6 (54.5%) |
| Bachelor's Degree | 0 (0.0%) | 0 (0.0%) |
| Graduate Degree | 7 (100.0%) | 0 (0.0%) |
| Total | 12 (50.0%) | 12 (50.0%) |
Employment Characteristics in Agua Dulce
Employment by Class of Employer in Agua Dulce
Among the 158 employed individuals in Agua Dulce, private company employees (83 | 52.5%), self-employed (not incorporated) (31 | 19.6%), and state government employees (21 | 13.3%) make up the most common classes of employment.
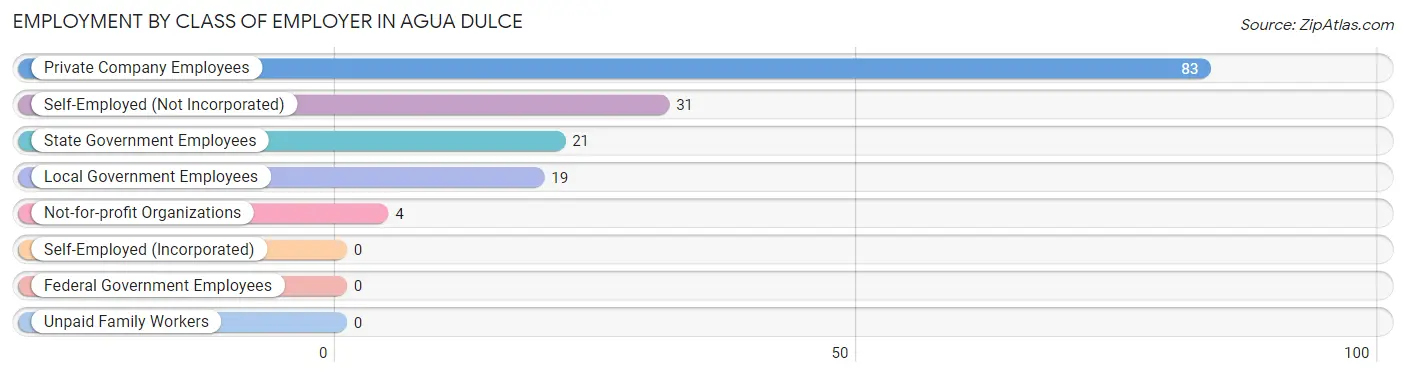
| Employer Class | # Employees | % Employees |
| Private Company Employees | 83 | 52.5% |
| Self-Employed (Incorporated) | 0 | 0.0% |
| Self-Employed (Not Incorporated) | 31 | 19.6% |
| Not-for-profit Organizations | 4 | 2.5% |
| Local Government Employees | 19 | 12.0% |
| State Government Employees | 21 | 13.3% |
| Federal Government Employees | 0 | 0.0% |
| Unpaid Family Workers | 0 | 0.0% |
| Total | 158 | 100.0% |
Employment Status by Age in Agua Dulce
According to the labor force statistics for Agua Dulce, out of the total population over 16 years of age (360), 51.1% or 184 individuals are in the labor force, with 13.0% or 24 of them unemployed. The age group with the highest labor force participation rate is 55 to 59 years, with 100.0% or 22 individuals in the labor force. Within the labor force, the 30 to 34 years age range has the highest percentage of unemployed individuals, with 42.9% or 6 of them being unemployed.
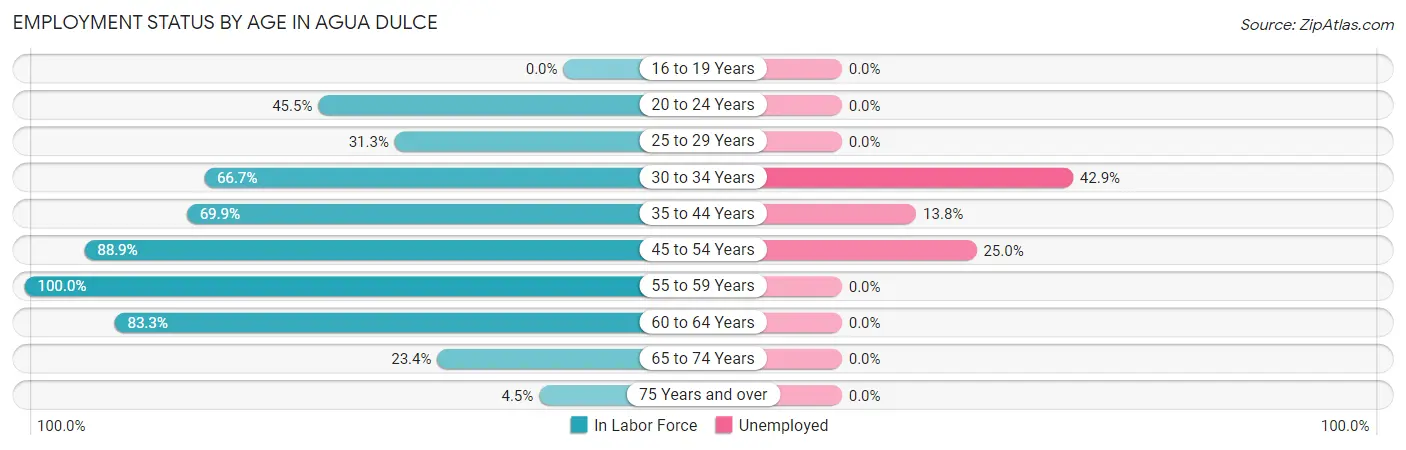
| Age Bracket | In Labor Force | Unemployed |
| 16 to 19 Years | 0 (0.0%) | 0 (0.0%) |
| 20 to 24 Years | 5 (45.5%) | 0 (0.0%) |
| 25 to 29 Years | 5 (31.3%) | 0 (0.0%) |
| 30 to 34 Years | 14 (66.7%) | 6 (42.9%) |
| 35 to 44 Years | 58 (69.9%) | 8 (13.8%) |
| 45 to 54 Years | 40 (88.9%) | 10 (25.0%) |
| 55 to 59 Years | 22 (100.0%) | 0 (0.0%) |
| 60 to 64 Years | 20 (83.3%) | 0 (0.0%) |
| 65 to 74 Years | 18 (23.4%) | 0 (0.0%) |
| 75 Years and over | 2 (4.5%) | 0 (0.0%) |
| Total | 184 (51.1%) | 24 (13.0%) |
Employment Status by Educational Attainment in Agua Dulce
According to labor force statistics for Agua Dulce, 75.4% of individuals (159) out of the total population between 25 and 64 years of age (211) are in the labor force, with 15.1% or 24 of them being unemployed. The group with the highest labor force participation rate are those with the educational attainment of less than high school, with 89.5% or 34 individuals in the labor force. Within the labor force, individuals with high school diploma education have the highest percentage of unemployment, with 18.4% or 18 of them being unemployed.
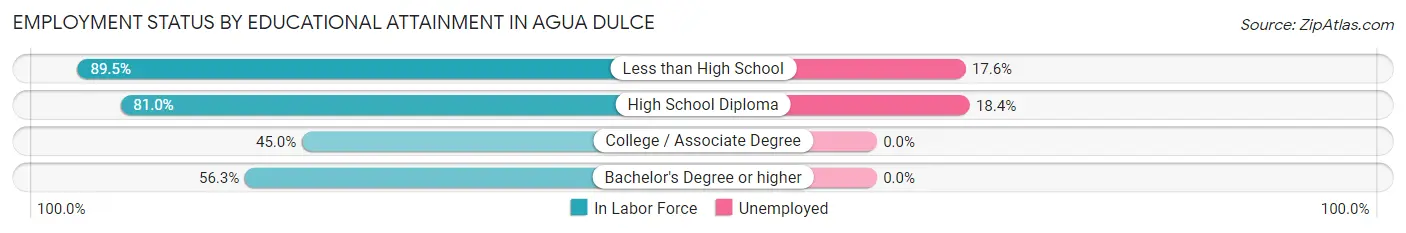
| Educational Attainment | In Labor Force | Unemployed |
| Less than High School | 34 (89.5%) | 7 (17.6%) |
| High School Diploma | 98 (81.0%) | 22 (18.4%) |
| College / Associate Degree | 9 (45.0%) | 0 (0.0%) |
| Bachelor's Degree or higher | 18 (56.3%) | 0 (0.0%) |
| Total | 159 (75.4%) | 32 (15.1%) |
Employment Occupations by Sex in Agua Dulce
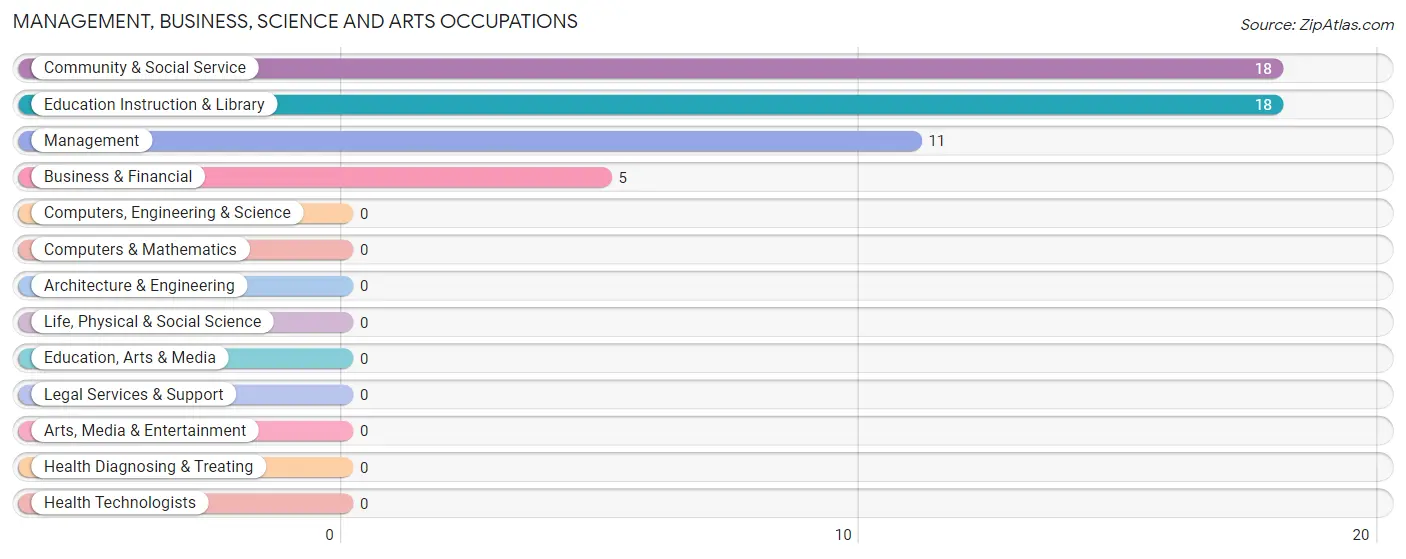
Management, Business, Science and Arts Occupations
The most common Management, Business, Science and Arts occupations in Agua Dulce are Community & Social Service (18 | 11.3%), Education Instruction & Library (18 | 11.3%), Management (11 | 6.9%), and Business & Financial (5 | 3.1%).
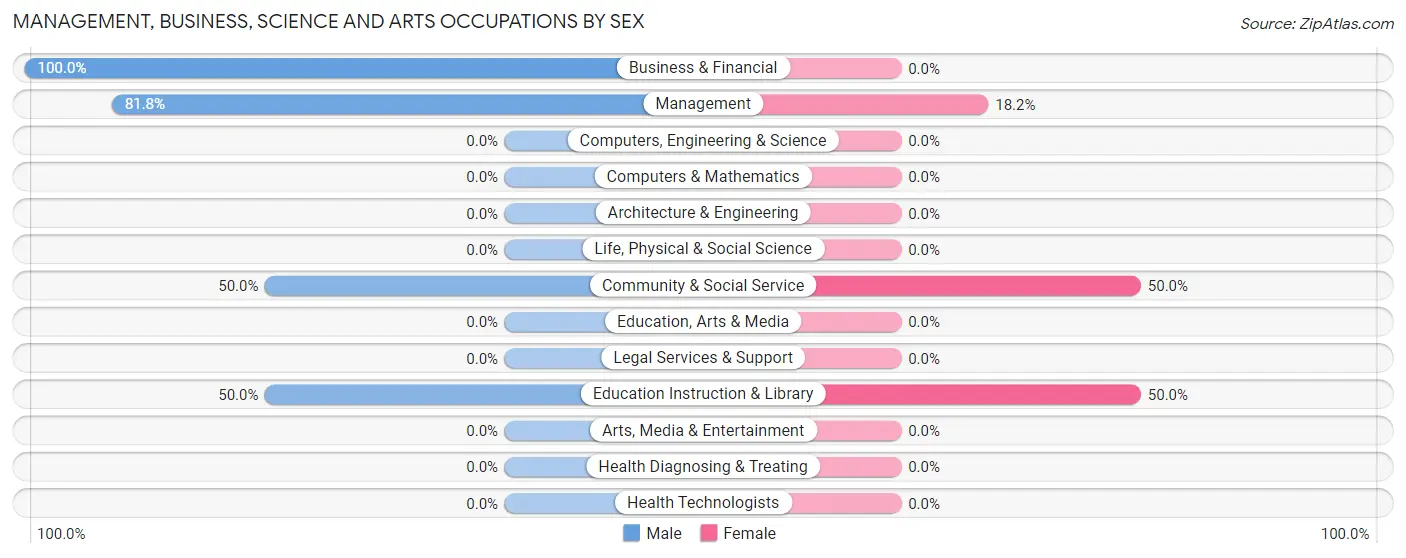
Management, Business, Science and Arts Occupations by Sex
Within the Management, Business, Science and Arts occupations in Agua Dulce, the most male-oriented occupations are Business & Financial (100.0%), Management (81.8%), and Community & Social Service (50.0%), while the most female-oriented occupations are Community & Social Service (50.0%), Education Instruction & Library (50.0%), and Management (18.2%).
| Occupation | Male | Female |
| Management | 9 (81.8%) | 2 (18.2%) |
| Business & Financial | 5 (100.0%) | 0 (0.0%) |
| Computers, Engineering & Science | 0 (0.0%) | 0 (0.0%) |
| Computers & Mathematics | 0 (0.0%) | 0 (0.0%) |
| Architecture & Engineering | 0 (0.0%) | 0 (0.0%) |
| Life, Physical & Social Science | 0 (0.0%) | 0 (0.0%) |
| Community & Social Service | 9 (50.0%) | 9 (50.0%) |
| Education, Arts & Media | 0 (0.0%) | 0 (0.0%) |
| Legal Services & Support | 0 (0.0%) | 0 (0.0%) |
| Education Instruction & Library | 9 (50.0%) | 9 (50.0%) |
| Arts, Media & Entertainment | 0 (0.0%) | 0 (0.0%) |
| Health Diagnosing & Treating | 0 (0.0%) | 0 (0.0%) |
| Health Technologists | 0 (0.0%) | 0 (0.0%) |
| Total (Category) | 23 (67.6%) | 11 (32.4%) |
| Total (Overall) | 108 (67.5%) | 52 (32.5%) |
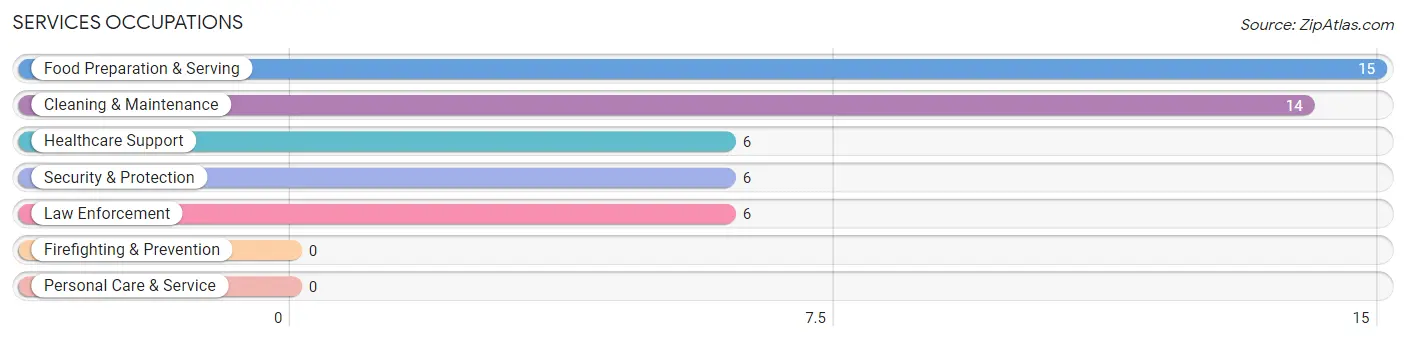
Services Occupations
The most common Services occupations in Agua Dulce are Food Preparation & Serving (15 | 9.4%), Cleaning & Maintenance (14 | 8.7%), Healthcare Support (6 | 3.7%), Security & Protection (6 | 3.7%), and Law Enforcement (6 | 3.7%).
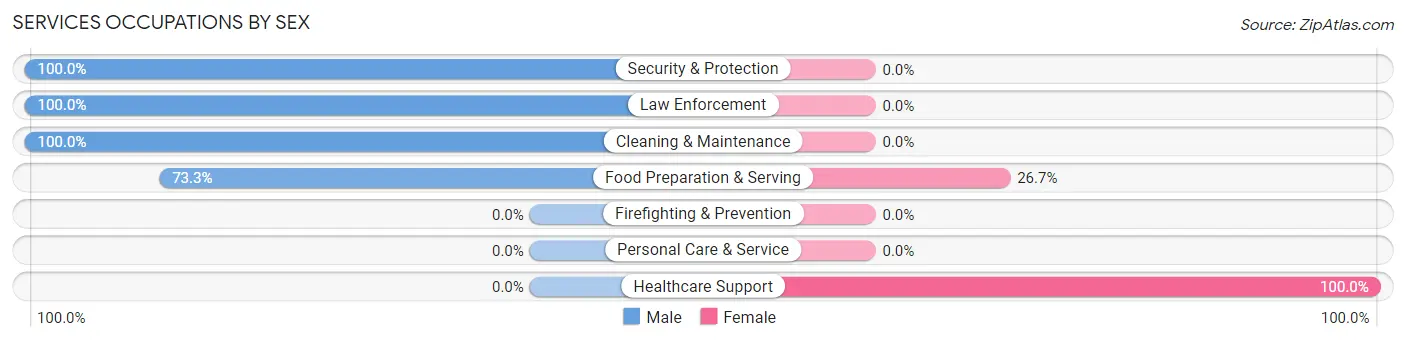
Services Occupations by Sex
Within the Services occupations in Agua Dulce, the most male-oriented occupations are Security & Protection (100.0%), Law Enforcement (100.0%), and Cleaning & Maintenance (100.0%), while the most female-oriented occupations are Healthcare Support (100.0%), and Food Preparation & Serving (26.7%).
| Occupation | Male | Female |
| Healthcare Support | 0 (0.0%) | 6 (100.0%) |
| Security & Protection | 6 (100.0%) | 0 (0.0%) |
| Firefighting & Prevention | 0 (0.0%) | 0 (0.0%) |
| Law Enforcement | 6 (100.0%) | 0 (0.0%) |
| Food Preparation & Serving | 11 (73.3%) | 4 (26.7%) |
| Cleaning & Maintenance | 14 (100.0%) | 0 (0.0%) |
| Personal Care & Service | 0 (0.0%) | 0 (0.0%) |
| Total (Category) | 31 (75.6%) | 10 (24.4%) |
| Total (Overall) | 108 (67.5%) | 52 (32.5%) |
Sales and Office Occupations
The most common Sales and Office occupations in Agua Dulce are Office & Administration (24 | 15.0%), and Sales & Related (8 | 5.0%).

Sales and Office Occupations by Sex

| Occupation | Male | Female |
| Sales & Related | 5 (62.5%) | 3 (37.5%) |
| Office & Administration | 0 (0.0%) | 24 (100.0%) |
| Total (Category) | 5 (15.6%) | 27 (84.4%) |
| Total (Overall) | 108 (67.5%) | 52 (32.5%) |
Natural Resources, Construction and Maintenance Occupations
The most common Natural Resources, Construction and Maintenance occupations in Agua Dulce are Construction & Extraction (17 | 10.6%), and Installation, Maintenance & Repair (5 | 3.1%).
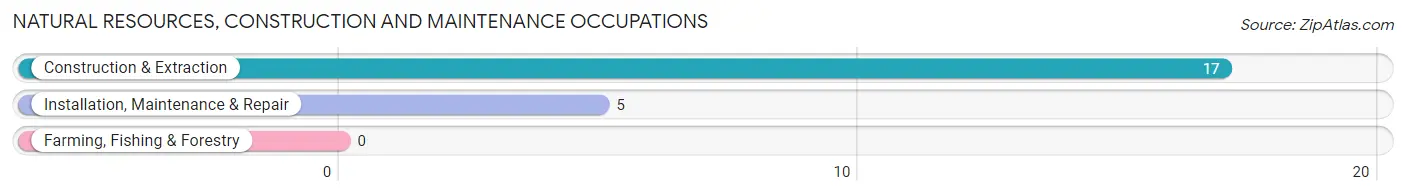
Natural Resources, Construction and Maintenance Occupations by Sex
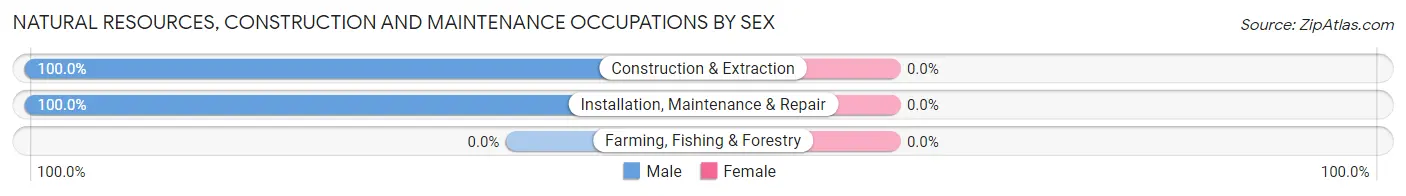
| Occupation | Male | Female |
| Farming, Fishing & Forestry | 0 (0.0%) | 0 (0.0%) |
| Construction & Extraction | 17 (100.0%) | 0 (0.0%) |
| Installation, Maintenance & Repair | 5 (100.0%) | 0 (0.0%) |
| Total (Category) | 22 (100.0%) | 0 (0.0%) |
| Total (Overall) | 108 (67.5%) | 52 (32.5%) |
Production, Transportation and Moving Occupations
The most common Production, Transportation and Moving occupations in Agua Dulce are Transportation (12 | 7.5%), Material Moving (12 | 7.5%), and Production (7 | 4.4%).
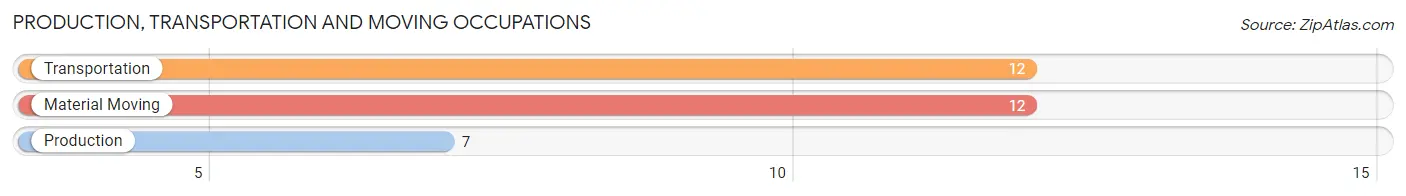
Production, Transportation and Moving Occupations by Sex
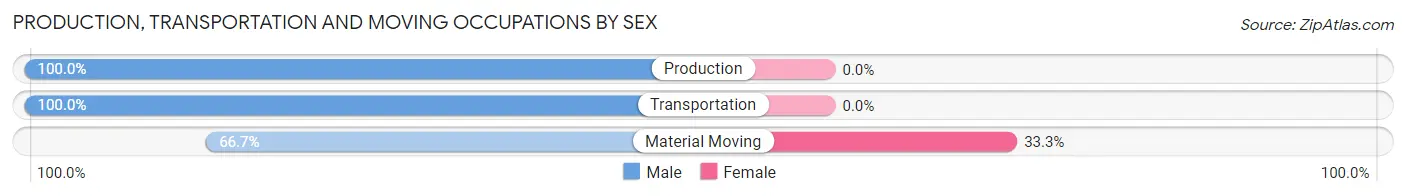
| Occupation | Male | Female |
| Production | 7 (100.0%) | 0 (0.0%) |
| Transportation | 12 (100.0%) | 0 (0.0%) |
| Material Moving | 8 (66.7%) | 4 (33.3%) |
| Total (Category) | 27 (87.1%) | 4 (12.9%) |
| Total (Overall) | 108 (67.5%) | 52 (32.5%) |
Employment Industries by Sex in Agua Dulce
Employment Industries in Agua Dulce
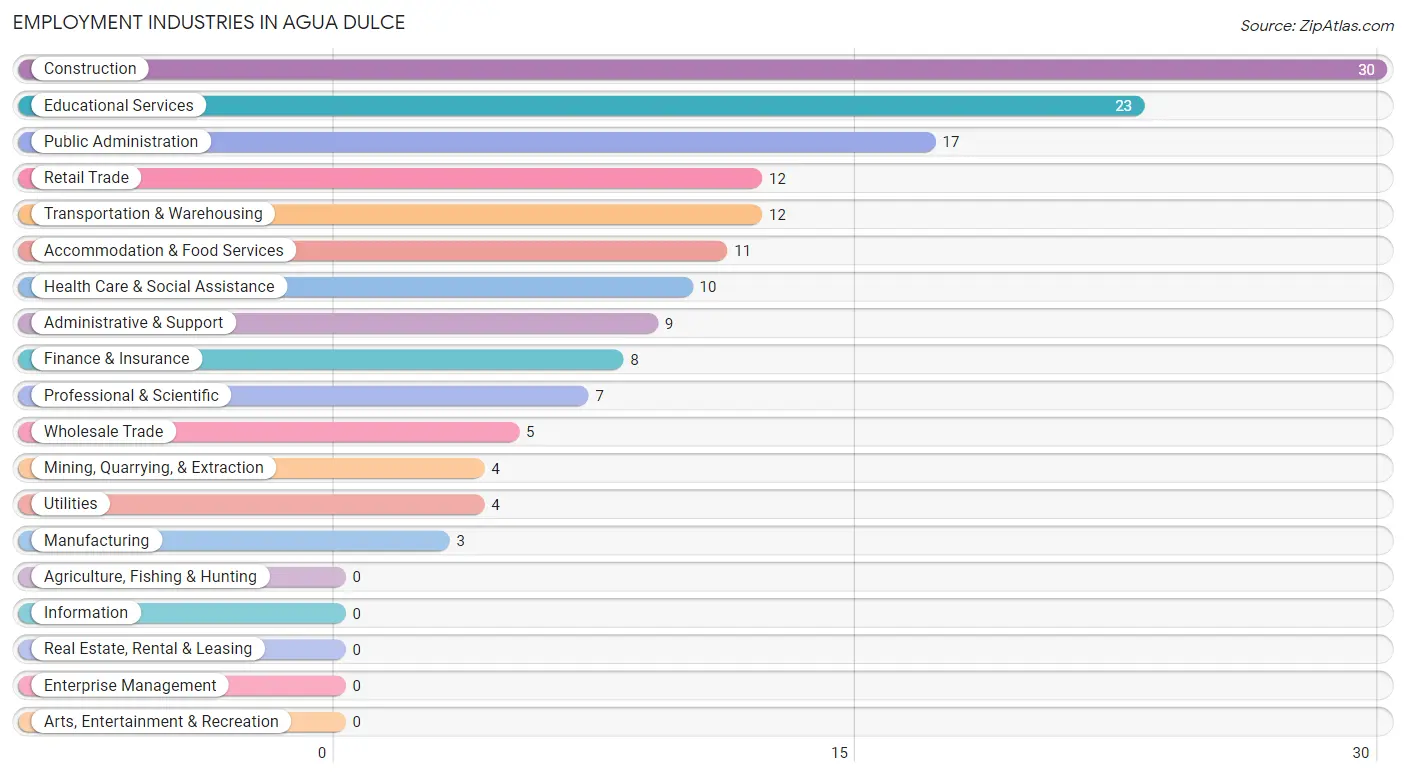
The major employment industries in Agua Dulce include Construction (30 | 18.8%), Educational Services (23 | 14.4%), Public Administration (17 | 10.6%), Retail Trade (12 | 7.5%), and Transportation & Warehousing (12 | 7.5%).
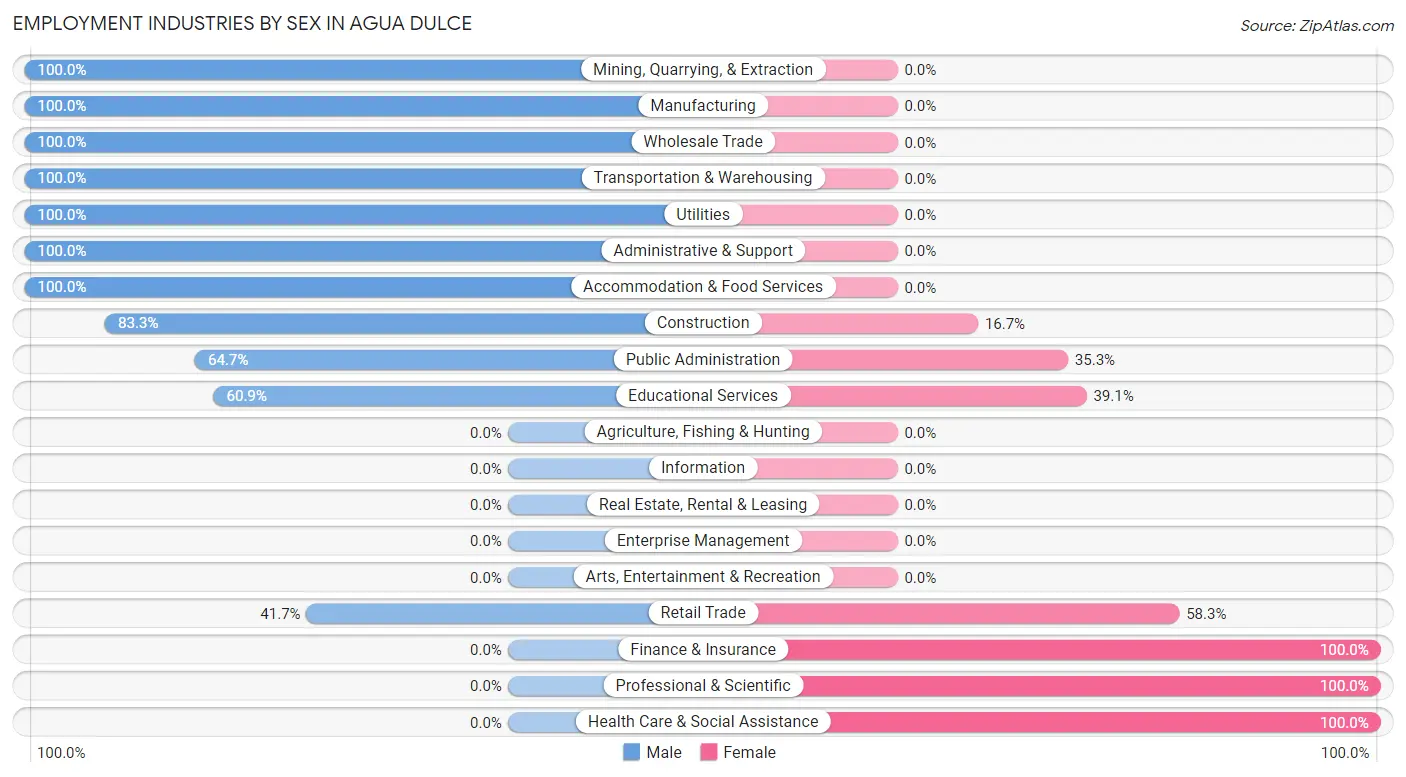
Employment Industries by Sex in Agua Dulce
The Agua Dulce industries that see more men than women are Mining, Quarrying, & Extraction (100.0%), Manufacturing (100.0%), and Wholesale Trade (100.0%), whereas the industries that tend to have a higher number of women are Finance & Insurance (100.0%), Professional & Scientific (100.0%), and Health Care & Social Assistance (100.0%).
| Industry | Male | Female |
| Agriculture, Fishing & Hunting | 0 (0.0%) | 0 (0.0%) |
| Mining, Quarrying, & Extraction | 4 (100.0%) | 0 (0.0%) |
| Construction | 25 (83.3%) | 5 (16.7%) |
| Manufacturing | 3 (100.0%) | 0 (0.0%) |
| Wholesale Trade | 5 (100.0%) | 0 (0.0%) |
| Retail Trade | 5 (41.7%) | 7 (58.3%) |
| Transportation & Warehousing | 12 (100.0%) | 0 (0.0%) |
| Utilities | 4 (100.0%) | 0 (0.0%) |
| Information | 0 (0.0%) | 0 (0.0%) |
| Finance & Insurance | 0 (0.0%) | 8 (100.0%) |
| Real Estate, Rental & Leasing | 0 (0.0%) | 0 (0.0%) |
| Professional & Scientific | 0 (0.0%) | 7 (100.0%) |
| Enterprise Management | 0 (0.0%) | 0 (0.0%) |
| Administrative & Support | 9 (100.0%) | 0 (0.0%) |
| Educational Services | 14 (60.9%) | 9 (39.1%) |
| Health Care & Social Assistance | 0 (0.0%) | 10 (100.0%) |
| Arts, Entertainment & Recreation | 0 (0.0%) | 0 (0.0%) |
| Accommodation & Food Services | 11 (100.0%) | 0 (0.0%) |
| Public Administration | 11 (64.7%) | 6 (35.3%) |
| Total | 108 (67.5%) | 52 (32.5%) |
Education in Agua Dulce
School Enrollment in Agua Dulce
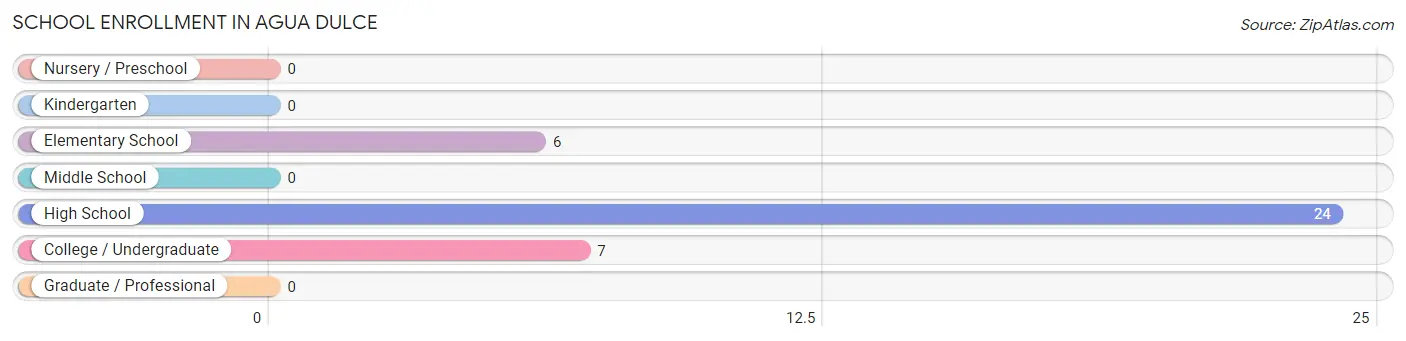
The most common levels of schooling among the 37 students in Agua Dulce are high school (24 | 64.9%), college / undergraduate (7 | 18.9%), and elementary school (6 | 16.2%).
| School Level | # Students | % Students |
| Nursery / Preschool | 0 | 0.0% |
| Kindergarten | 0 | 0.0% |
| Elementary School | 6 | 16.2% |
| Middle School | 0 | 0.0% |
| High School | 24 | 64.9% |
| College / Undergraduate | 7 | 18.9% |
| Graduate / Professional | 0 | 0.0% |
| Total | 37 | 100.0% |
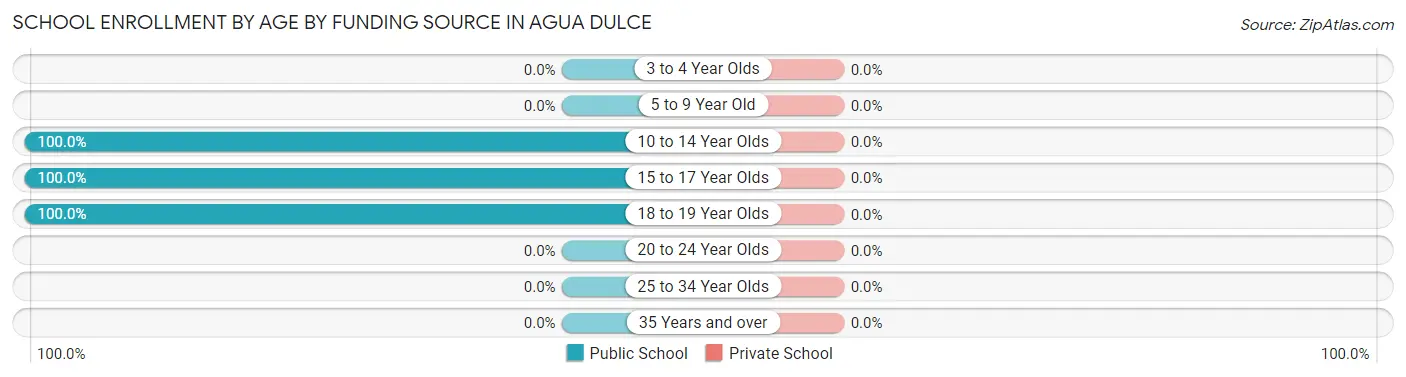
School Enrollment by Age by Funding Source in Agua Dulce
| Age Bracket | Public School | Private School |
| 3 to 4 Year Olds | 0 (0.0%) | 0 (0.0%) |
| 5 to 9 Year Old | 0 (0.0%) | 0 (0.0%) |
| 10 to 14 Year Olds | 6 (100.0%) | 0 (0.0%) |
| 15 to 17 Year Olds | 27 (100.0%) | 0 (0.0%) |
| 18 to 19 Year Olds | 4 (100.0%) | 0 (0.0%) |
| 20 to 24 Year Olds | 0 (0.0%) | 0 (0.0%) |
| 25 to 34 Year Olds | 0 (0.0%) | 0 (0.0%) |
| 35 Years and over | 0 (0.0%) | 0 (0.0%) |
| Total | 37 (100.0%) | 0 (0.0%) |
Educational Attainment by Field of Study in Agua Dulce
Education (30 | 54.5%), business (10 | 18.2%), communications (8 | 14.5%), physical & health sciences (4 | 7.3%), and bio, nature & agricultural (3 | 5.4%) are the most common fields of study among 55 individuals in Agua Dulce who have obtained a bachelor's degree or higher.
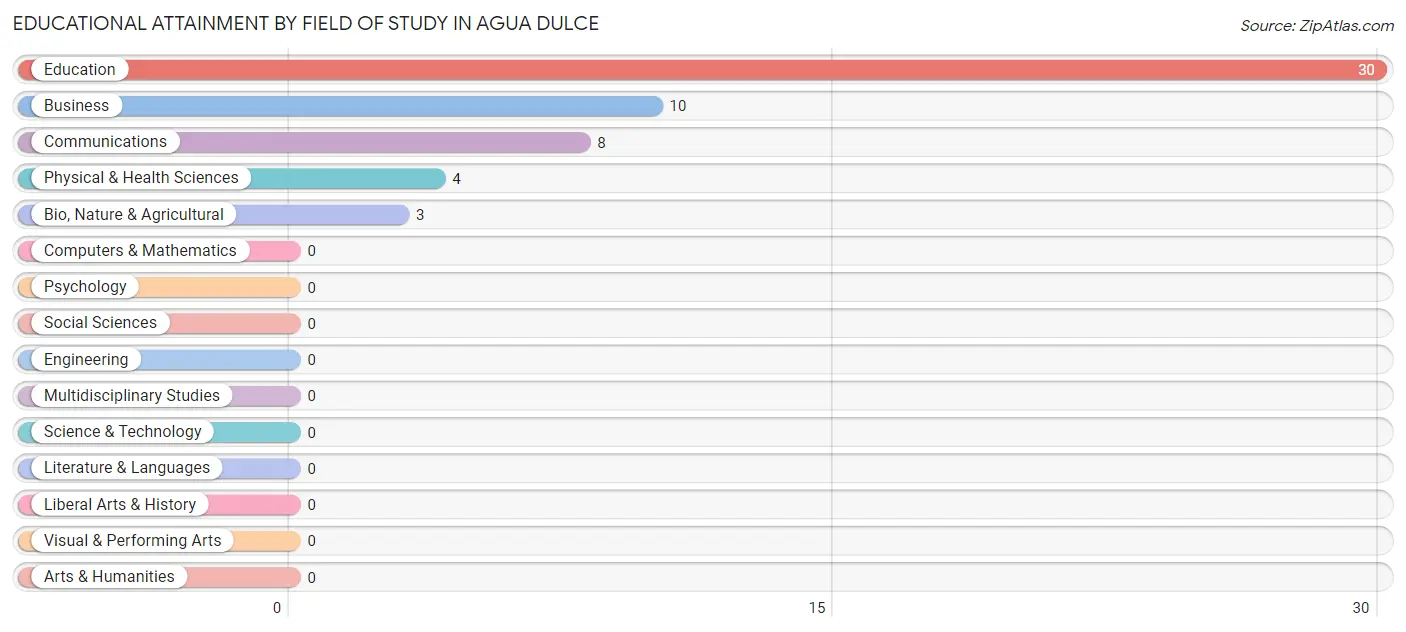
| Field of Study | # Graduates | % Graduates |
| Computers & Mathematics | 0 | 0.0% |
| Bio, Nature & Agricultural | 3 | 5.4% |
| Physical & Health Sciences | 4 | 7.3% |
| Psychology | 0 | 0.0% |
| Social Sciences | 0 | 0.0% |
| Engineering | 0 | 0.0% |
| Multidisciplinary Studies | 0 | 0.0% |
| Science & Technology | 0 | 0.0% |
| Business | 10 | 18.2% |
| Education | 30 | 54.5% |
| Literature & Languages | 0 | 0.0% |
| Liberal Arts & History | 0 | 0.0% |
| Visual & Performing Arts | 0 | 0.0% |
| Communications | 8 | 14.5% |
| Arts & Humanities | 0 | 0.0% |
| Total | 55 | 100.0% |
Transportation & Commute in Agua Dulce
Vehicle Availability by Sex in Agua Dulce
The most prevalent vehicle ownership categories in Agua Dulce are males with 2 vehicles (42, accounting for 38.9%) and females with 2 vehicles (11, making up 84.0%).
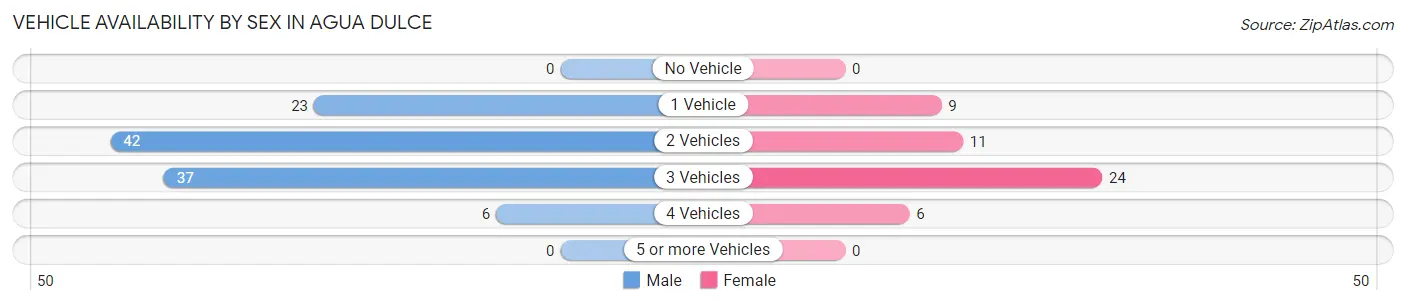
| Vehicles Available | Male | Female |
| No Vehicle | 0 (0.0%) | 0 (0.0%) |
| 1 Vehicle | 23 (21.3%) | 9 (18.0%) |
| 2 Vehicles | 42 (38.9%) | 11 (22.0%) |
| 3 Vehicles | 37 (34.3%) | 24 (48.0%) |
| 4 Vehicles | 6 (5.6%) | 6 (12.0%) |
| 5 or more Vehicles | 0 (0.0%) | 0 (0.0%) |
| Total | 108 (100.0%) | 50 (100.0%) |
Commute Time in Agua Dulce
The most frequently occuring commute durations in Agua Dulce are 30 to 34 minutes (36 commuters, 23.5%), 45 to 59 minutes (30 commuters, 19.6%), and 20 to 24 minutes (27 commuters, 17.6%).
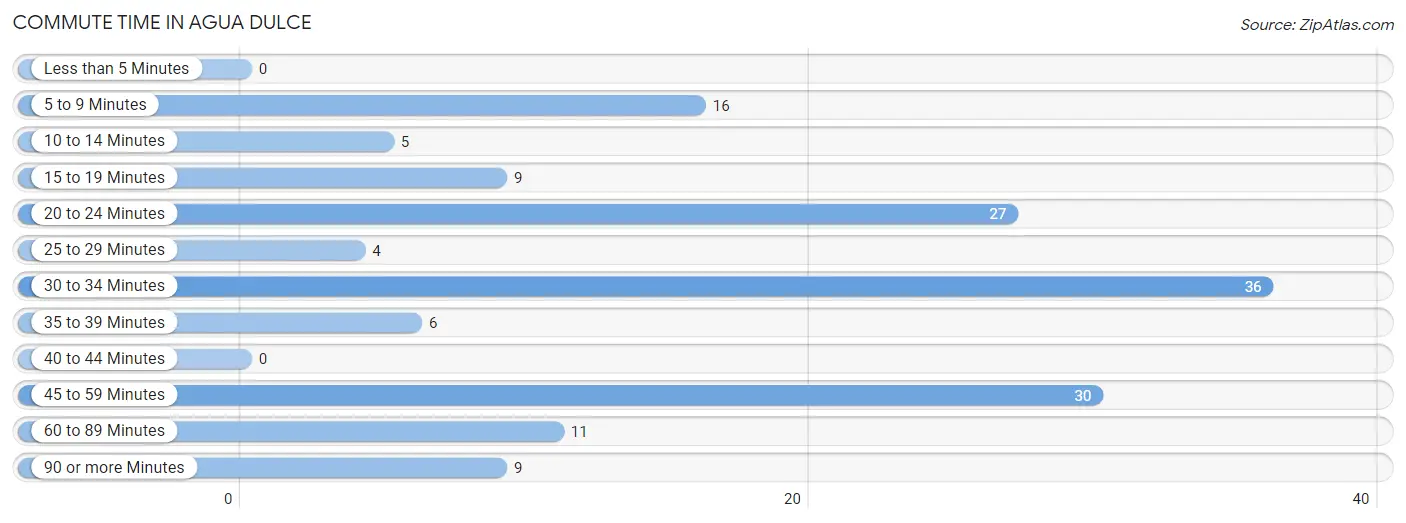
| Commute Time | # Commuters | % Commuters |
| Less than 5 Minutes | 0 | 0.0% |
| 5 to 9 Minutes | 16 | 10.5% |
| 10 to 14 Minutes | 5 | 3.3% |
| 15 to 19 Minutes | 9 | 5.9% |
| 20 to 24 Minutes | 27 | 17.6% |
| 25 to 29 Minutes | 4 | 2.6% |
| 30 to 34 Minutes | 36 | 23.5% |
| 35 to 39 Minutes | 6 | 3.9% |
| 40 to 44 Minutes | 0 | 0.0% |
| 45 to 59 Minutes | 30 | 19.6% |
| 60 to 89 Minutes | 11 | 7.2% |
| 90 or more Minutes | 9 | 5.9% |
Commute Time by Sex in Agua Dulce
The most common commute times in Agua Dulce are 30 to 34 minutes (29 commuters, 28.2%) for males and 5 to 9 minutes (11 commuters, 22.0%) for females.
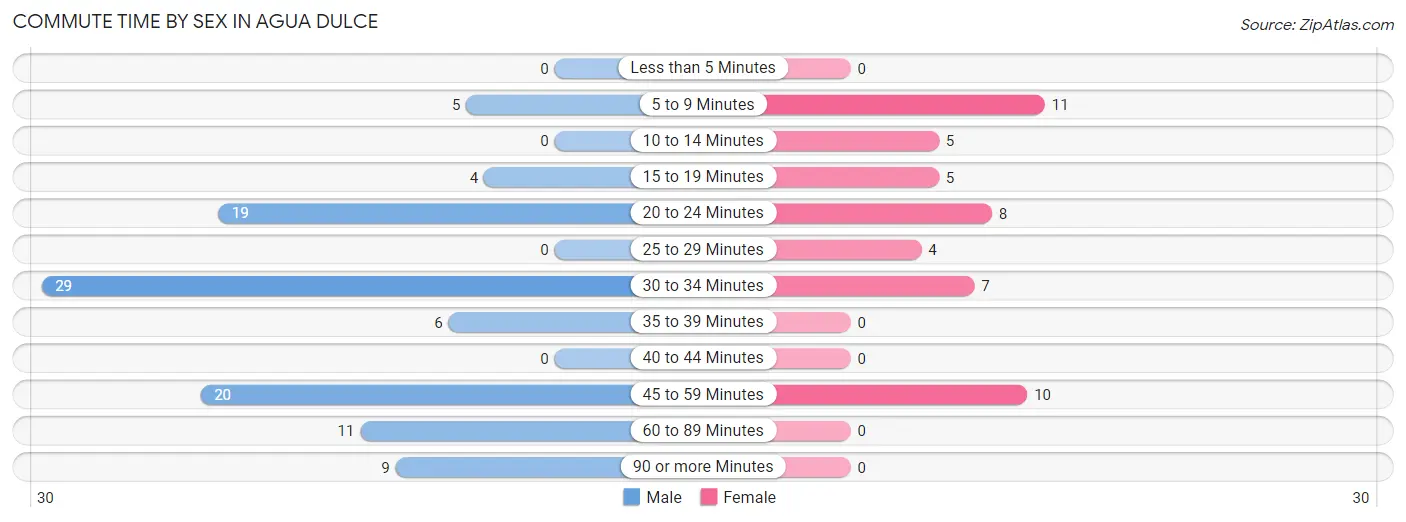
| Commute Time | Male | Female |
| Less than 5 Minutes | 0 (0.0%) | 0 (0.0%) |
| 5 to 9 Minutes | 5 (4.9%) | 11 (22.0%) |
| 10 to 14 Minutes | 0 (0.0%) | 5 (10.0%) |
| 15 to 19 Minutes | 4 (3.9%) | 5 (10.0%) |
| 20 to 24 Minutes | 19 (18.4%) | 8 (16.0%) |
| 25 to 29 Minutes | 0 (0.0%) | 4 (8.0%) |
| 30 to 34 Minutes | 29 (28.2%) | 7 (14.0%) |
| 35 to 39 Minutes | 6 (5.8%) | 0 (0.0%) |
| 40 to 44 Minutes | 0 (0.0%) | 0 (0.0%) |
| 45 to 59 Minutes | 20 (19.4%) | 10 (20.0%) |
| 60 to 89 Minutes | 11 (10.7%) | 0 (0.0%) |
| 90 or more Minutes | 9 (8.7%) | 0 (0.0%) |
Time of Departure to Work by Sex in Agua Dulce
The most frequent times of departure to work in Agua Dulce are 7:30 AM to 7:59 AM (23, 22.3%) for males and 7:00 AM to 7:29 AM (16, 32.0%) for females.
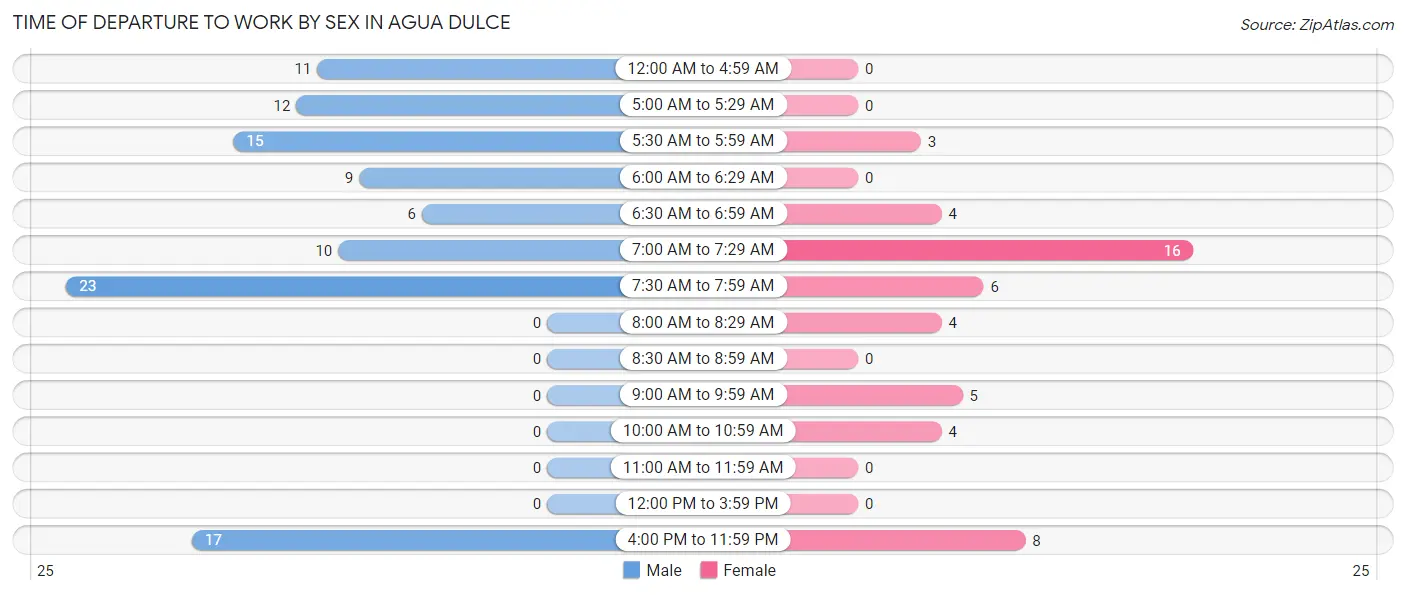
| Time of Departure | Male | Female |
| 12:00 AM to 4:59 AM | 11 (10.7%) | 0 (0.0%) |
| 5:00 AM to 5:29 AM | 12 (11.7%) | 0 (0.0%) |
| 5:30 AM to 5:59 AM | 15 (14.6%) | 3 (6.0%) |
| 6:00 AM to 6:29 AM | 9 (8.7%) | 0 (0.0%) |
| 6:30 AM to 6:59 AM | 6 (5.8%) | 4 (8.0%) |
| 7:00 AM to 7:29 AM | 10 (9.7%) | 16 (32.0%) |
| 7:30 AM to 7:59 AM | 23 (22.3%) | 6 (12.0%) |
| 8:00 AM to 8:29 AM | 0 (0.0%) | 4 (8.0%) |
| 8:30 AM to 8:59 AM | 0 (0.0%) | 0 (0.0%) |
| 9:00 AM to 9:59 AM | 0 (0.0%) | 5 (10.0%) |
| 10:00 AM to 10:59 AM | 0 (0.0%) | 4 (8.0%) |
| 11:00 AM to 11:59 AM | 0 (0.0%) | 0 (0.0%) |
| 12:00 PM to 3:59 PM | 0 (0.0%) | 0 (0.0%) |
| 4:00 PM to 11:59 PM | 17 (16.5%) | 8 (16.0%) |
| Total | 103 (100.0%) | 50 (100.0%) |
Housing Occupancy in Agua Dulce
Occupancy by Ownership in Agua Dulce
Of the total 728 dwellings in Agua Dulce, owner-occupied units account for 630 (86.5%), while renter-occupied units make up 98 (13.5%).
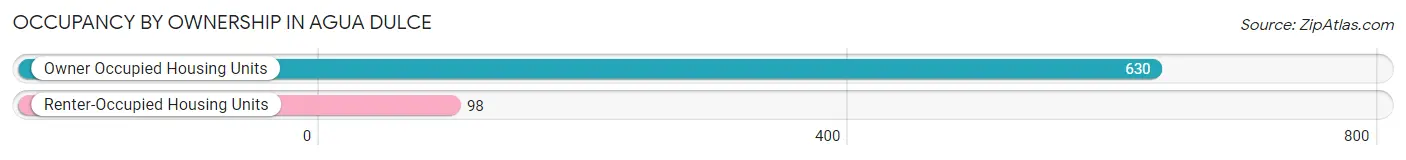
| Occupancy | # Housing Units | % Housing Units |
| Owner Occupied Housing Units | 630 | 86.5% |
| Renter-Occupied Housing Units | 98 | 13.5% |
| Total Occupied Housing Units | 728 | 100.0% |
Occupancy by Household Size in Agua Dulce
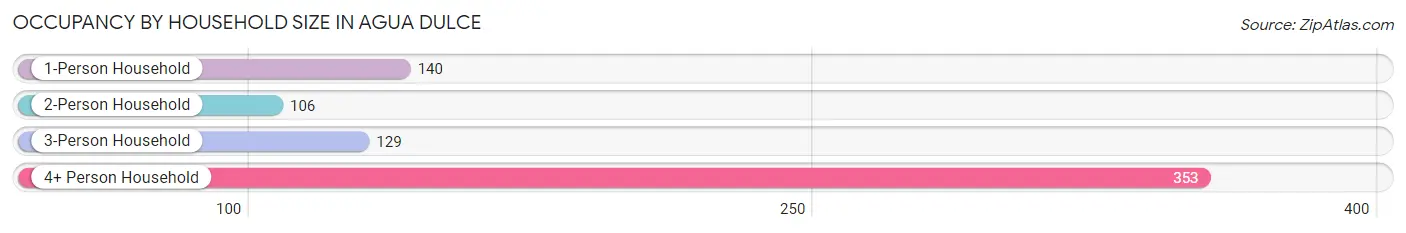
| Household Size | # Housing Units | % Housing Units |
| 1-Person Household | 140 | 19.2% |
| 2-Person Household | 106 | 14.6% |
| 3-Person Household | 129 | 17.7% |
| 4+ Person Household | 353 | 48.5% |
| Total Housing Units | 728 | 100.0% |
Occupancy by Ownership by Household Size in Agua Dulce
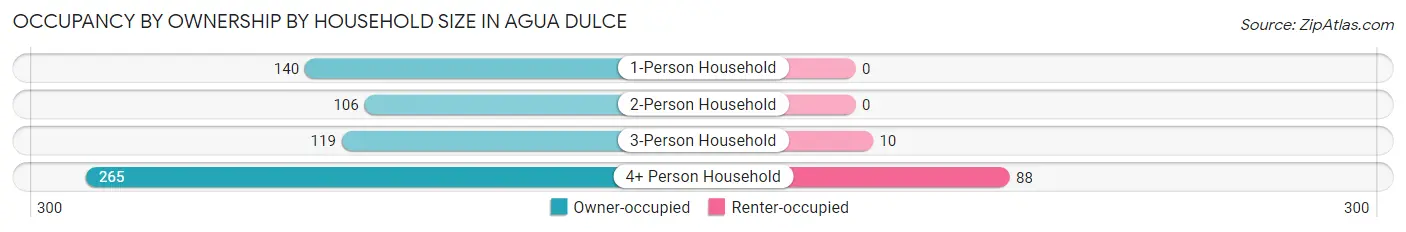
| Household Size | Owner-occupied | Renter-occupied |
| 1-Person Household | 140 (100.0%) | 0 (0.0%) |
| 2-Person Household | 106 (100.0%) | 0 (0.0%) |
| 3-Person Household | 119 (92.2%) | 10 (7.7%) |
| 4+ Person Household | 265 (75.1%) | 88 (24.9%) |
| Total Housing Units | 630 (86.5%) | 98 (13.5%) |
Occupancy by Educational Attainment in Agua Dulce
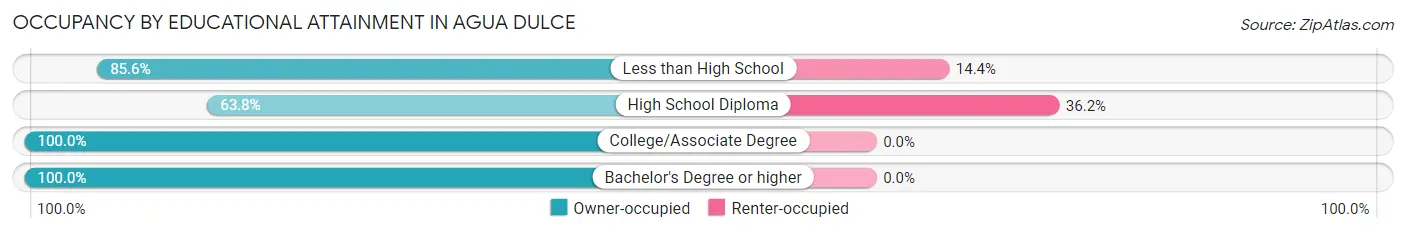
| Household Size | Owner-occupied | Renter-occupied |
| Less than High School | 285 (85.6%) | 48 (14.4%) |
| High School Diploma | 88 (63.8%) | 50 (36.2%) |
| College/Associate Degree | 226 (100.0%) | 0 (0.0%) |
| Bachelor's Degree or higher | 31 (100.0%) | 0 (0.0%) |
Occupancy by Age of Householder in Agua Dulce
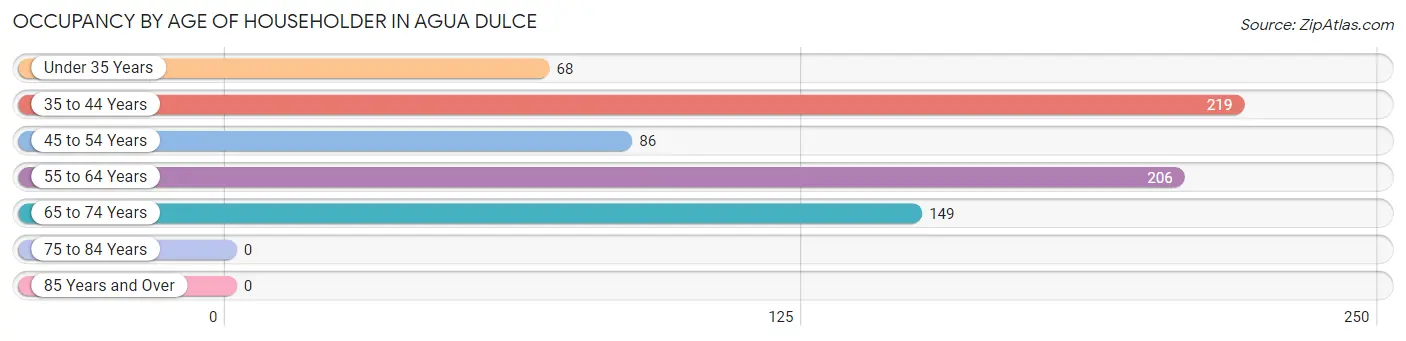
| Age Bracket | # Households | % Households |
| Under 35 Years | 68 | 9.3% |
| 35 to 44 Years | 219 | 30.1% |
| 45 to 54 Years | 86 | 11.8% |
| 55 to 64 Years | 206 | 28.3% |
| 65 to 74 Years | 149 | 20.5% |
| 75 to 84 Years | 0 | 0.0% |
| 85 Years and Over | 0 | 0.0% |
| Total | 728 | 100.0% |
Housing Finances in Agua Dulce
Median Income by Occupancy in Agua Dulce
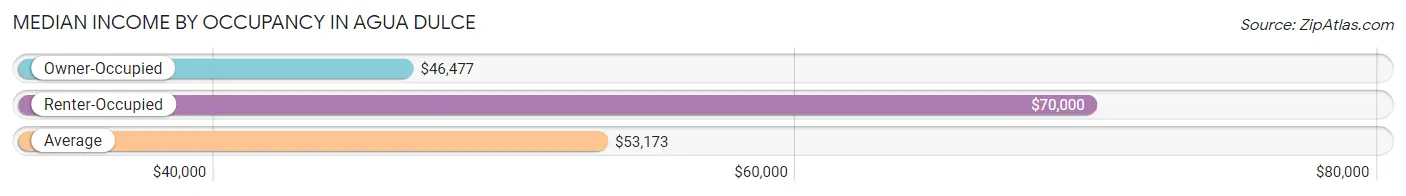
| Occupancy Type | # Households | Median Income |
| Owner-Occupied | 135 (82.8%) | $46,477 |
| Renter-Occupied | 28 (17.2%) | $70,000 |
| Average | 163 (100.0%) | $53,173 |
Occupancy by Householder Income Bracket in Agua Dulce
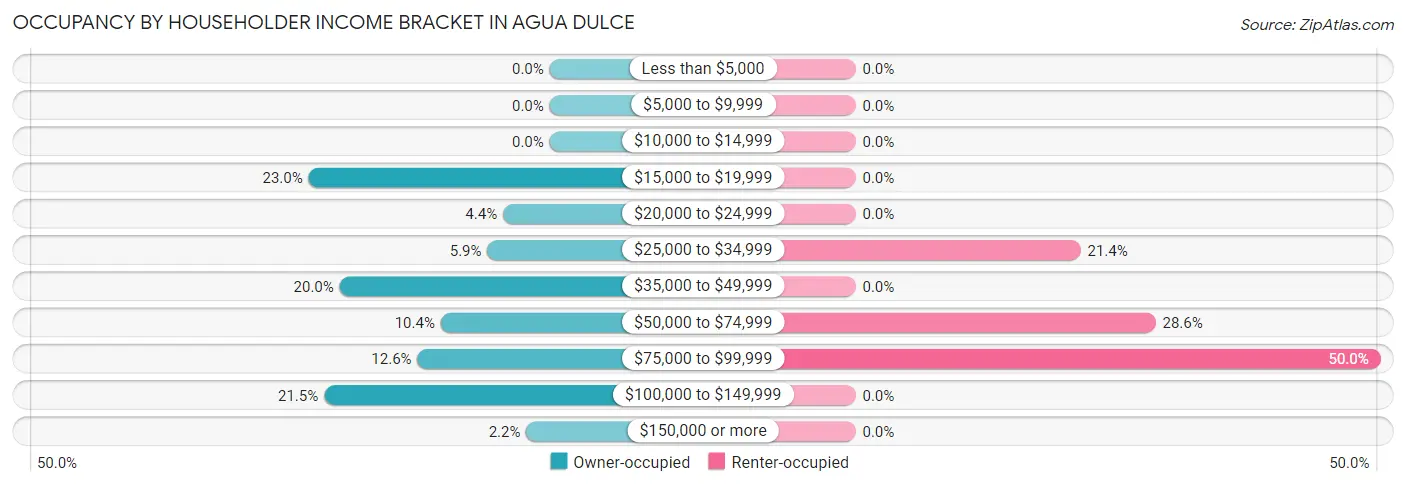
| Income Bracket | Owner-occupied | Renter-occupied |
| Less than $5,000 | 0 (0.0%) | 0 (0.0%) |
| $5,000 to $9,999 | 0 (0.0%) | 0 (0.0%) |
| $10,000 to $14,999 | 0 (0.0%) | 0 (0.0%) |
| $15,000 to $19,999 | 31 (23.0%) | 0 (0.0%) |
| $20,000 to $24,999 | 6 (4.4%) | 0 (0.0%) |
| $25,000 to $34,999 | 8 (5.9%) | 6 (21.4%) |
| $35,000 to $49,999 | 27 (20.0%) | 0 (0.0%) |
| $50,000 to $74,999 | 14 (10.4%) | 8 (28.6%) |
| $75,000 to $99,999 | 17 (12.6%) | 14 (50.0%) |
| $100,000 to $149,999 | 29 (21.5%) | 0 (0.0%) |
| $150,000 or more | 3 (2.2%) | 0 (0.0%) |
| Total | 135 (100.0%) | 28 (100.0%) |
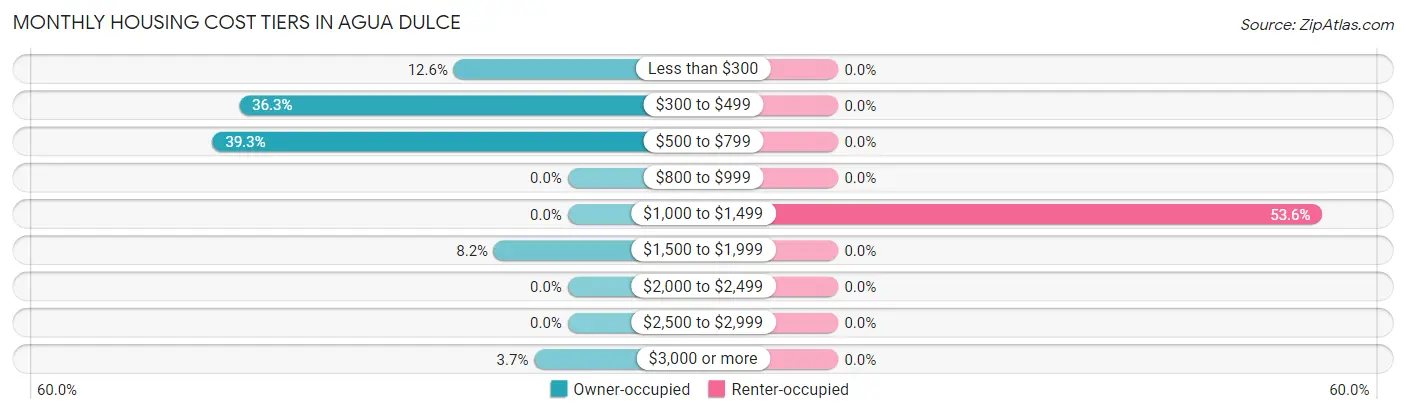
Monthly Housing Cost Tiers in Agua Dulce
| Monthly Cost | Owner-occupied | Renter-occupied |
| Less than $300 | 17 (12.6%) | 0 (0.0%) |
| $300 to $499 | 49 (36.3%) | 0 (0.0%) |
| $500 to $799 | 53 (39.3%) | 0 (0.0%) |
| $800 to $999 | 0 (0.0%) | 0 (0.0%) |
| $1,000 to $1,499 | 0 (0.0%) | 15 (53.6%) |
| $1,500 to $1,999 | 11 (8.2%) | 0 (0.0%) |
| $2,000 to $2,499 | 0 (0.0%) | 0 (0.0%) |
| $2,500 to $2,999 | 0 (0.0%) | 0 (0.0%) |
| $3,000 or more | 5 (3.7%) | 0 (0.0%) |
| Total | 135 (100.0%) | 28 (100.0%) |
Physical Housing Characteristics in Agua Dulce
Housing Structures in Agua Dulce
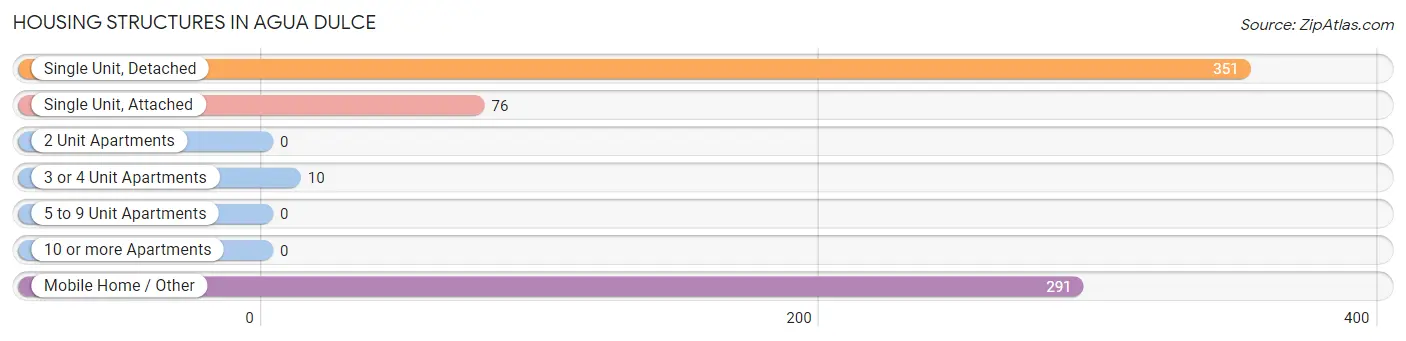
| Structure Type | # Housing Units | % Housing Units |
| Single Unit, Detached | 351 | 48.2% |
| Single Unit, Attached | 76 | 10.4% |
| 2 Unit Apartments | 0 | 0.0% |
| 3 or 4 Unit Apartments | 10 | 1.4% |
| 5 to 9 Unit Apartments | 0 | 0.0% |
| 10 or more Apartments | 0 | 0.0% |
| Mobile Home / Other | 291 | 40.0% |
| Total | 728 | 100.0% |
Housing Structures by Occupancy in Agua Dulce
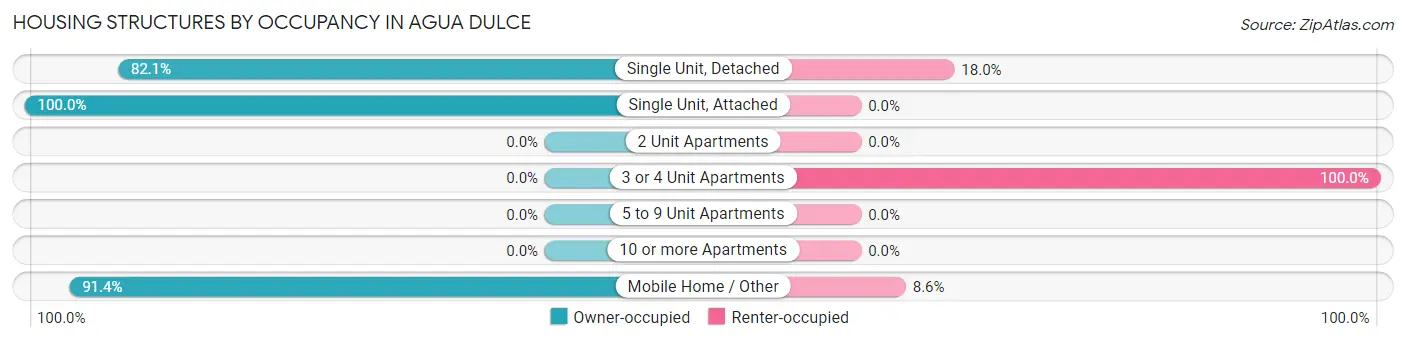
| Structure Type | Owner-occupied | Renter-occupied |
| Single Unit, Detached | 288 (82.1%) | 63 (17.9%) |
| Single Unit, Attached | 76 (100.0%) | 0 (0.0%) |
| 2 Unit Apartments | 0 (0.0%) | 0 (0.0%) |
| 3 or 4 Unit Apartments | 0 (0.0%) | 10 (100.0%) |
| 5 to 9 Unit Apartments | 0 (0.0%) | 0 (0.0%) |
| 10 or more Apartments | 0 (0.0%) | 0 (0.0%) |
| Mobile Home / Other | 266 (91.4%) | 25 (8.6%) |
| Total | 630 (86.5%) | 98 (13.5%) |
Housing Structures by Number of Rooms in Agua Dulce
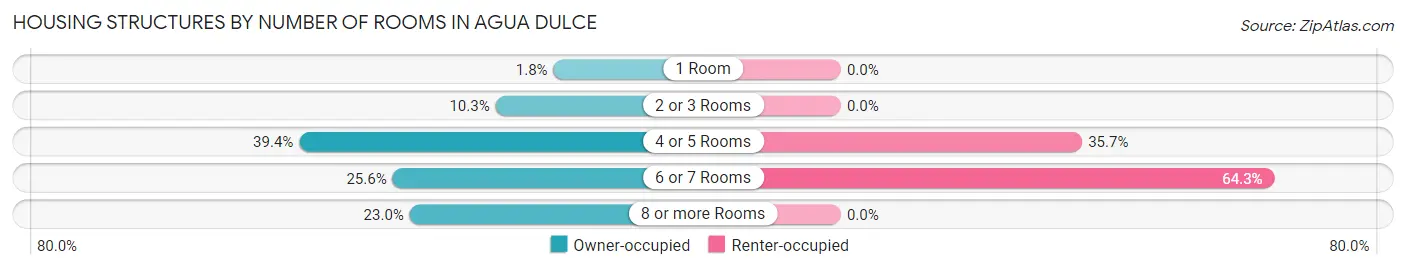
| Number of Rooms | Owner-occupied | Renter-occupied |
| 1 Room | 11 (1.8%) | 0 (0.0%) |
| 2 or 3 Rooms | 65 (10.3%) | 0 (0.0%) |
| 4 or 5 Rooms | 248 (39.4%) | 35 (35.7%) |
| 6 or 7 Rooms | 161 (25.6%) | 63 (64.3%) |
| 8 or more Rooms | 145 (23.0%) | 0 (0.0%) |
| Total | 630 (100.0%) | 98 (100.0%) |
Housing Structure by Heating Type in Agua Dulce
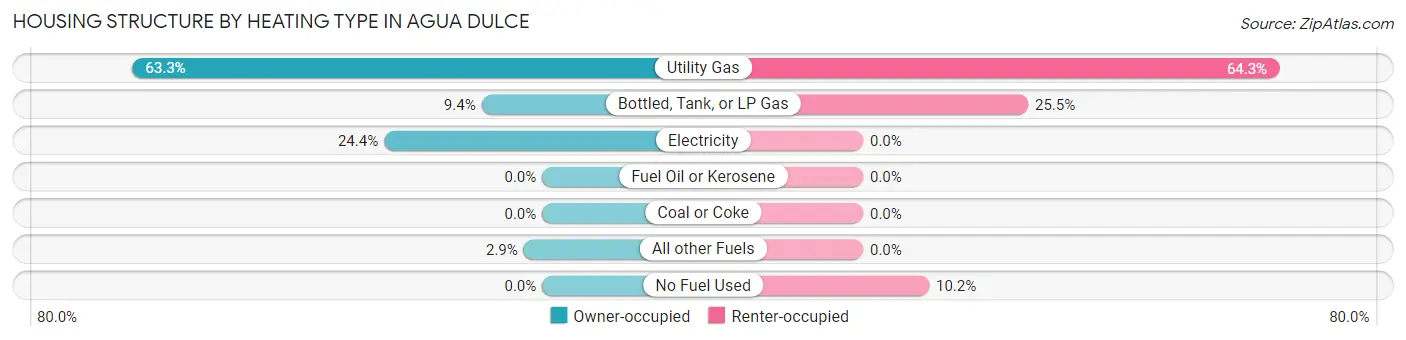
| Heating Type | Owner-occupied | Renter-occupied |
| Utility Gas | 399 (63.3%) | 63 (64.3%) |
| Bottled, Tank, or LP Gas | 59 (9.4%) | 25 (25.5%) |
| Electricity | 154 (24.4%) | 0 (0.0%) |
| Fuel Oil or Kerosene | 0 (0.0%) | 0 (0.0%) |
| Coal or Coke | 0 (0.0%) | 0 (0.0%) |
| All other Fuels | 18 (2.9%) | 0 (0.0%) |
| No Fuel Used | 0 (0.0%) | 10 (10.2%) |
| Total | 630 (100.0%) | 98 (100.0%) |
Household Vehicle Usage in Agua Dulce
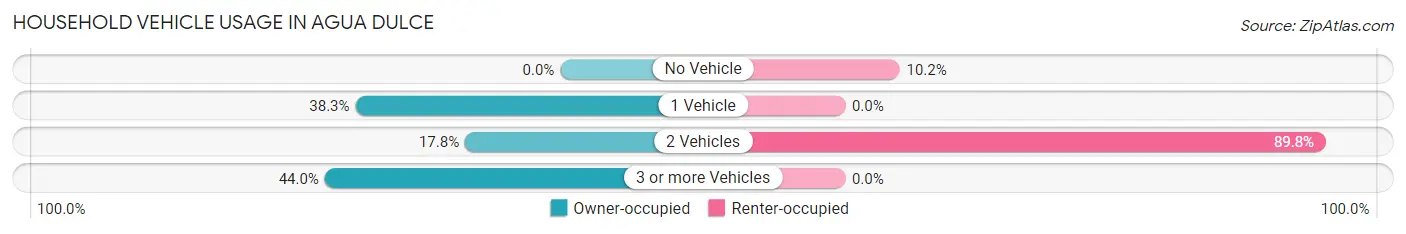
| Vehicles per Household | Owner-occupied | Renter-occupied |
| No Vehicle | 0 (0.0%) | 10 (10.2%) |
| 1 Vehicle | 241 (38.3%) | 0 (0.0%) |
| 2 Vehicles | 112 (17.8%) | 88 (89.8%) |
| 3 or more Vehicles | 277 (44.0%) | 0 (0.0%) |
| Total | 630 (100.0%) | 98 (100.0%) |
Real Estate & Mortgages in Agua Dulce
Real Estate and Mortgage Overview in Agua Dulce
| Characteristic | Without Mortgage | With Mortgage |
| Housing Units | 533 | 21 |
| Median Property Value | $94,700 | $0 |
| Median Household Income | $43,525 | $0 |
| Monthly Housing Costs | $433 | $5 |
| Real Estate Taxes | $1,838 | $0 |
Property Value by Mortgage Status in Agua Dulce
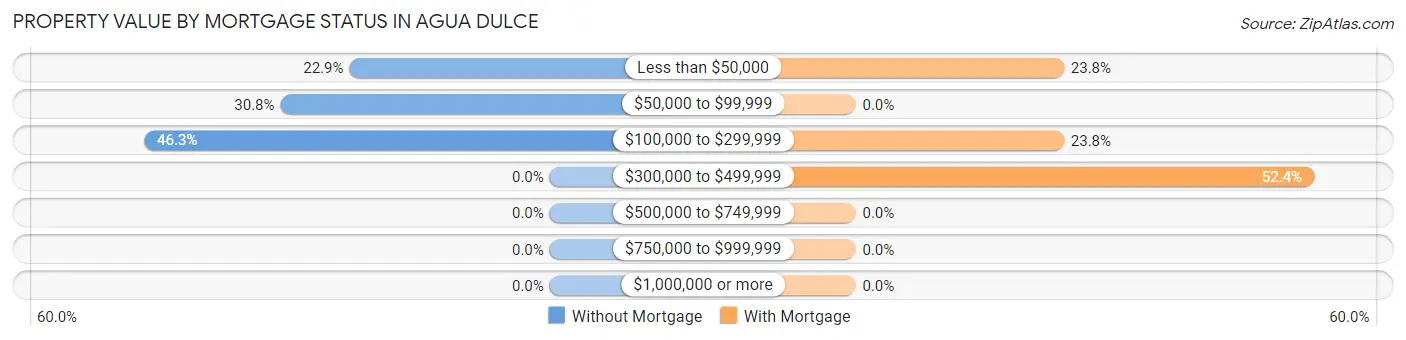
| Property Value | Without Mortgage | With Mortgage |
| Less than $50,000 | 122 (22.9%) | 5 (23.8%) |
| $50,000 to $99,999 | 164 (30.8%) | 0 (0.0%) |
| $100,000 to $299,999 | 247 (46.3%) | 5 (23.8%) |
| $300,000 to $499,999 | 0 (0.0%) | 11 (52.4%) |
| $500,000 to $749,999 | 0 (0.0%) | 0 (0.0%) |
| $750,000 to $999,999 | 0 (0.0%) | 0 (0.0%) |
| $1,000,000 or more | 0 (0.0%) | 0 (0.0%) |
| Total | 533 (100.0%) | 21 (100.0%) |
Household Income by Mortgage Status in Agua Dulce
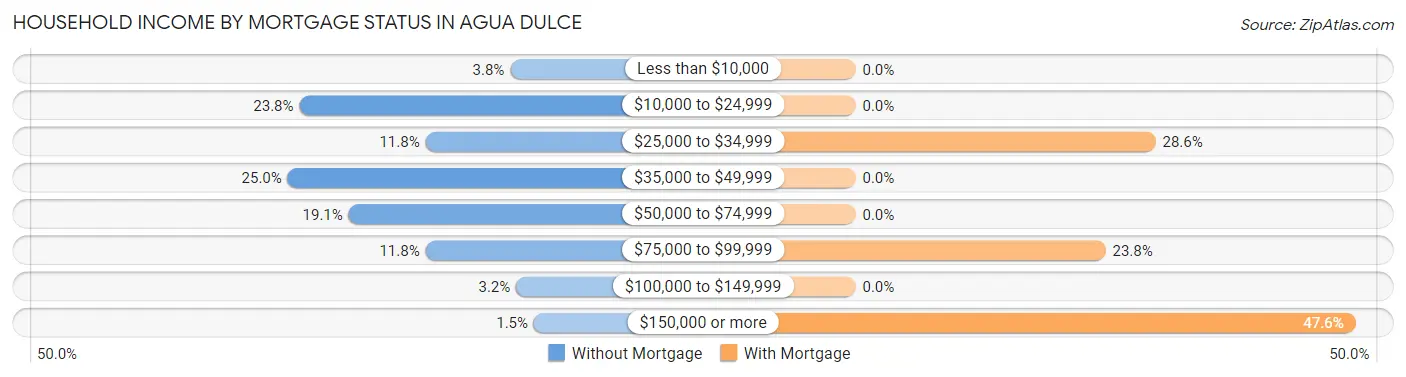
| Household Income | Without Mortgage | With Mortgage |
| Less than $10,000 | 20 (3.7%) | 0 (0.0%) |
| $10,000 to $24,999 | 127 (23.8%) | 0 (0.0%) |
| $25,000 to $34,999 | 63 (11.8%) | 6 (28.6%) |
| $35,000 to $49,999 | 133 (24.9%) | 0 (0.0%) |
| $50,000 to $74,999 | 102 (19.1%) | 0 (0.0%) |
| $75,000 to $99,999 | 63 (11.8%) | 5 (23.8%) |
| $100,000 to $149,999 | 17 (3.2%) | 0 (0.0%) |
| $150,000 or more | 8 (1.5%) | 10 (47.6%) |
| Total | 533 (100.0%) | 21 (100.0%) |
Property Value to Household Income Ratio in Agua Dulce
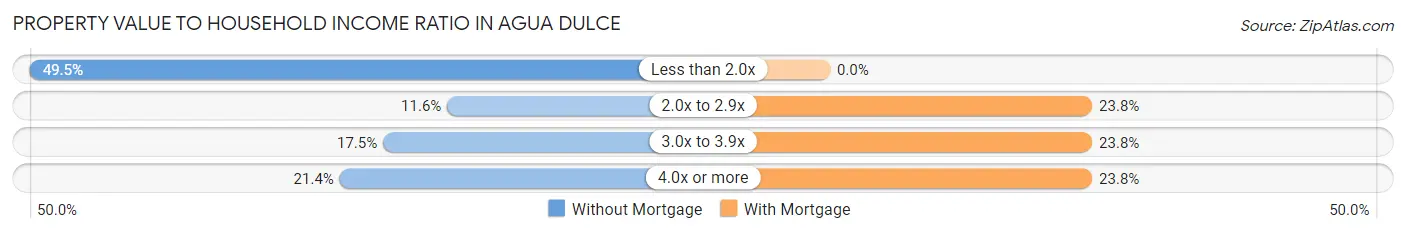
| Value-to-Income Ratio | Without Mortgage | With Mortgage |
| Less than 2.0x | 264 (49.5%) | 0 (0.0%) |
| 2.0x to 2.9x | 62 (11.6%) | 5 (23.8%) |
| 3.0x to 3.9x | 93 (17.4%) | 5 (23.8%) |
| 4.0x or more | 114 (21.4%) | 5 (23.8%) |
| Total | 533 (100.0%) | 21 (100.0%) |
Real Estate Taxes by Mortgage Status in Agua Dulce
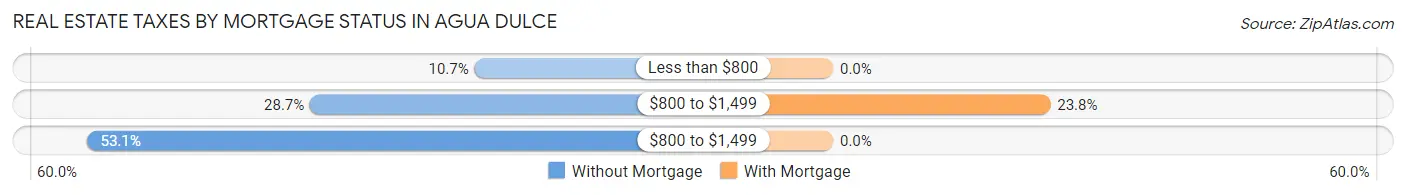
| Property Taxes | Without Mortgage | With Mortgage |
| Less than $800 | 57 (10.7%) | 0 (0.0%) |
| $800 to $1,499 | 153 (28.7%) | 5 (23.8%) |
| $800 to $1,499 | 283 (53.1%) | 0 (0.0%) |
| Total | 533 (100.0%) | 21 (100.0%) |
Health & Disability in Agua Dulce
Health Insurance Coverage by Age in Agua Dulce
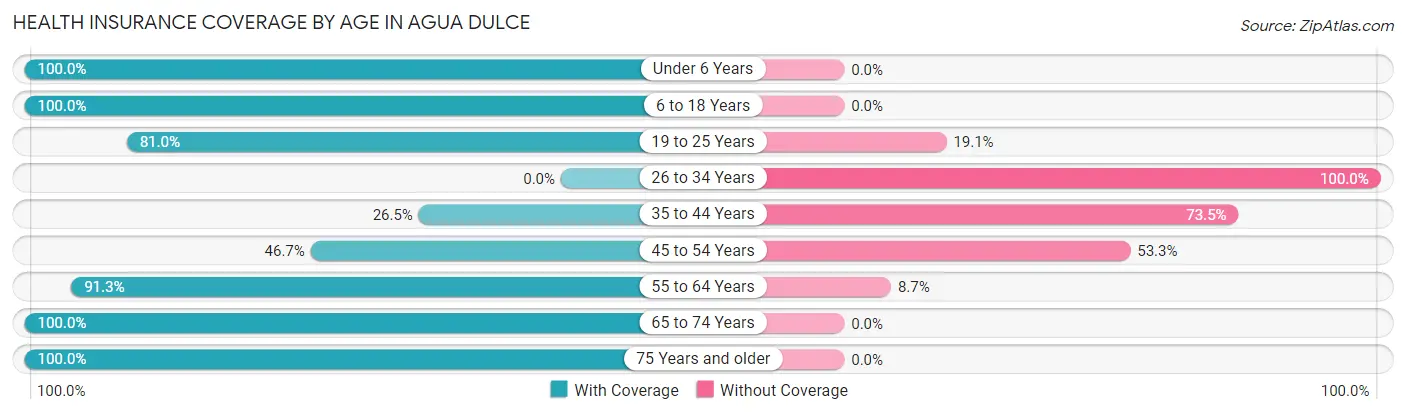
| Age Bracket | With Coverage | Without Coverage |
| Under 6 Years | 47 (100.0%) | 0 (0.0%) |
| 6 to 18 Years | 42 (100.0%) | 0 (0.0%) |
| 19 to 25 Years | 17 (80.9%) | 4 (19.1%) |
| 26 to 34 Years | 0 (0.0%) | 31 (100.0%) |
| 35 to 44 Years | 22 (26.5%) | 61 (73.5%) |
| 45 to 54 Years | 21 (46.7%) | 24 (53.3%) |
| 55 to 64 Years | 42 (91.3%) | 4 (8.7%) |
| 65 to 74 Years | 77 (100.0%) | 0 (0.0%) |
| 75 Years and older | 44 (100.0%) | 0 (0.0%) |
| Total | 312 (71.6%) | 124 (28.4%) |
Health Insurance Coverage by Citizenship Status in Agua Dulce
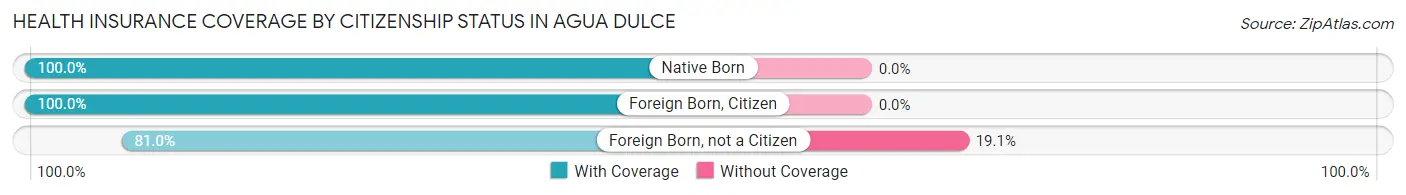
| Citizenship Status | With Coverage | Without Coverage |
| Native Born | 47 (100.0%) | 0 (0.0%) |
| Foreign Born, Citizen | 42 (100.0%) | 0 (0.0%) |
| Foreign Born, not a Citizen | 17 (80.9%) | 4 (19.1%) |
Health Insurance Coverage by Household Income in Agua Dulce
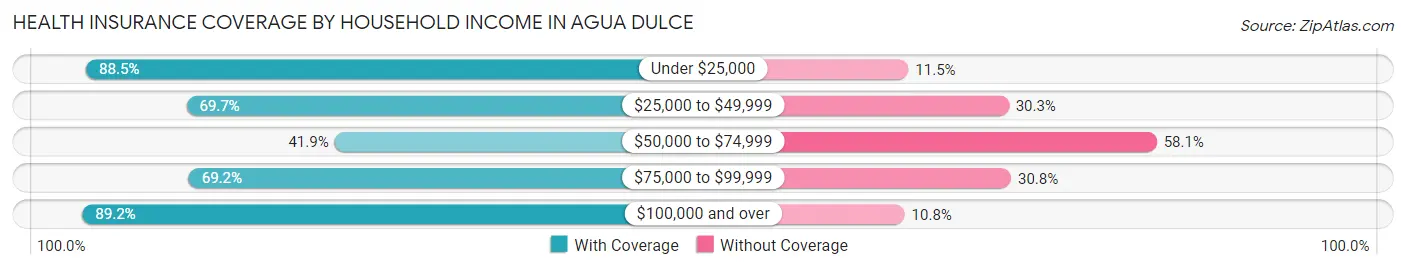
| Household Income | With Coverage | Without Coverage |
| Under $25,000 | 46 (88.5%) | 6 (11.5%) |
| $25,000 to $49,999 | 85 (69.7%) | 37 (30.3%) |
| $50,000 to $74,999 | 26 (41.9%) | 36 (58.1%) |
| $75,000 to $99,999 | 81 (69.2%) | 36 (30.8%) |
| $100,000 and over | 74 (89.2%) | 9 (10.8%) |
Public vs Private Health Insurance Coverage by Age in Agua Dulce
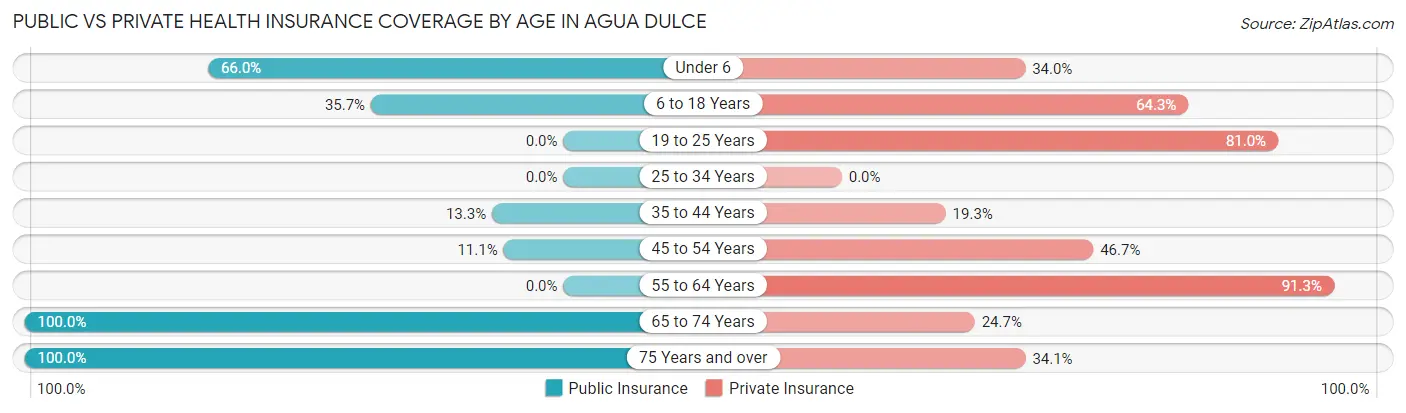
| Age Bracket | Public Insurance | Private Insurance |
| Under 6 | 31 (66.0%) | 16 (34.0%) |
| 6 to 18 Years | 15 (35.7%) | 27 (64.3%) |
| 19 to 25 Years | 0 (0.0%) | 17 (80.9%) |
| 25 to 34 Years | 0 (0.0%) | 0 (0.0%) |
| 35 to 44 Years | 11 (13.3%) | 16 (19.3%) |
| 45 to 54 Years | 5 (11.1%) | 21 (46.7%) |
| 55 to 64 Years | 0 (0.0%) | 42 (91.3%) |
| 65 to 74 Years | 77 (100.0%) | 19 (24.7%) |
| 75 Years and over | 44 (100.0%) | 15 (34.1%) |
| Total | 183 (42.0%) | 173 (39.7%) |
Disability Status by Sex by Age in Agua Dulce
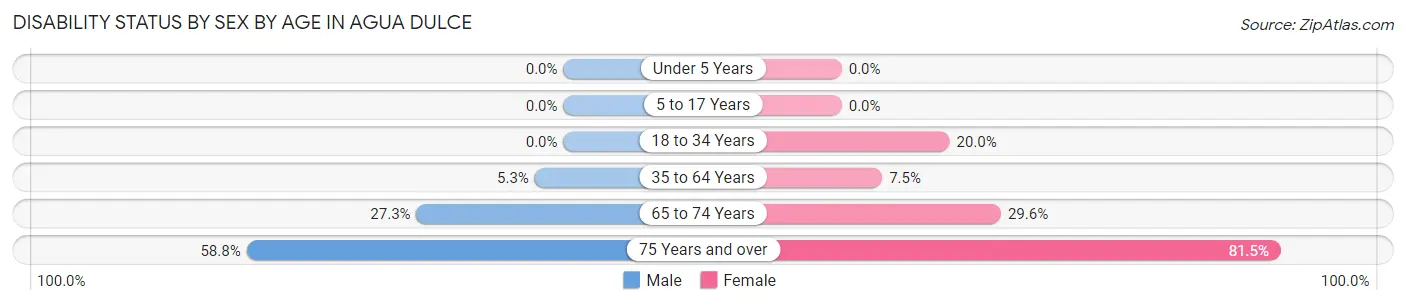
| Age Bracket | Male | Female |
| Under 5 Years | 0 (0.0%) | 0 (0.0%) |
| 5 to 17 Years | 0 (0.0%) | 0 (0.0%) |
| 18 to 34 Years | 0 (0.0%) | 6 (20.0%) |
| 35 to 64 Years | 5 (5.3%) | 6 (7.5%) |
| 65 to 74 Years | 9 (27.3%) | 13 (29.5%) |
| 75 Years and over | 10 (58.8%) | 22 (81.5%) |
Disability Class by Sex by Age in Agua Dulce
Disability Class: Hearing Difficulty
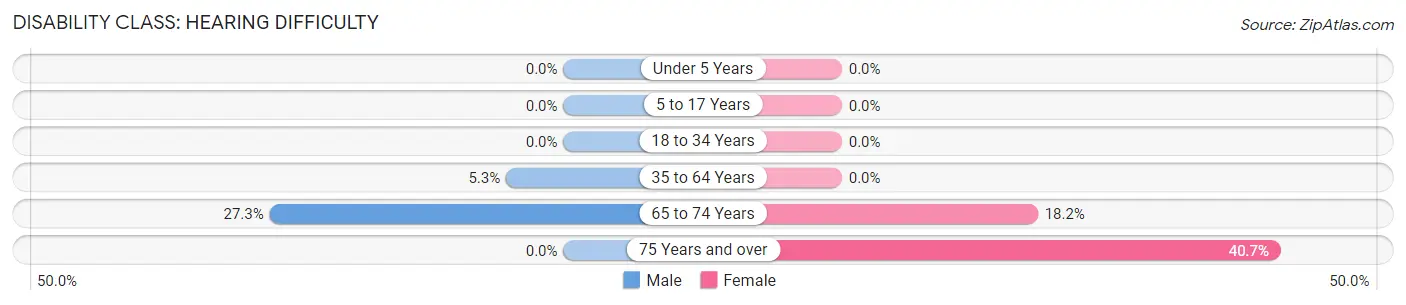
| Age Bracket | Male | Female |
| Under 5 Years | 0 (0.0%) | 0 (0.0%) |
| 5 to 17 Years | 0 (0.0%) | 0 (0.0%) |
| 18 to 34 Years | 0 (0.0%) | 0 (0.0%) |
| 35 to 64 Years | 5 (5.3%) | 0 (0.0%) |
| 65 to 74 Years | 9 (27.3%) | 8 (18.2%) |
| 75 Years and over | 0 (0.0%) | 11 (40.7%) |
Disability Class: Vision Difficulty
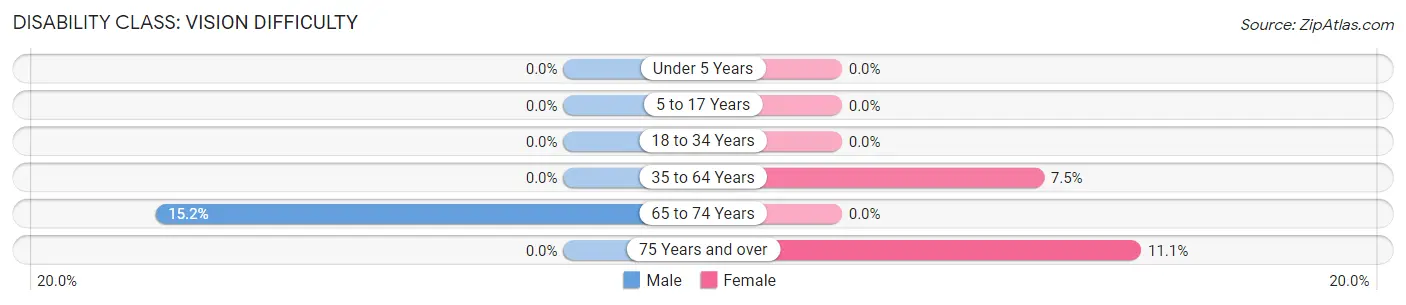
| Age Bracket | Male | Female |
| Under 5 Years | 0 (0.0%) | 0 (0.0%) |
| 5 to 17 Years | 0 (0.0%) | 0 (0.0%) |
| 18 to 34 Years | 0 (0.0%) | 0 (0.0%) |
| 35 to 64 Years | 0 (0.0%) | 6 (7.5%) |
| 65 to 74 Years | 5 (15.1%) | 0 (0.0%) |
| 75 Years and over | 0 (0.0%) | 3 (11.1%) |
Disability Class: Cognitive Difficulty
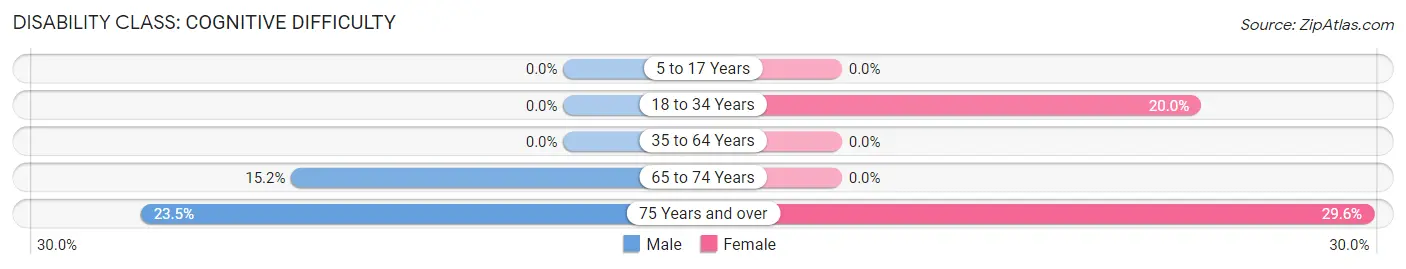
| Age Bracket | Male | Female |
| 5 to 17 Years | 0 (0.0%) | 0 (0.0%) |
| 18 to 34 Years | 0 (0.0%) | 6 (20.0%) |
| 35 to 64 Years | 0 (0.0%) | 0 (0.0%) |
| 65 to 74 Years | 5 (15.1%) | 0 (0.0%) |
| 75 Years and over | 4 (23.5%) | 8 (29.6%) |
Disability Class: Ambulatory Difficulty
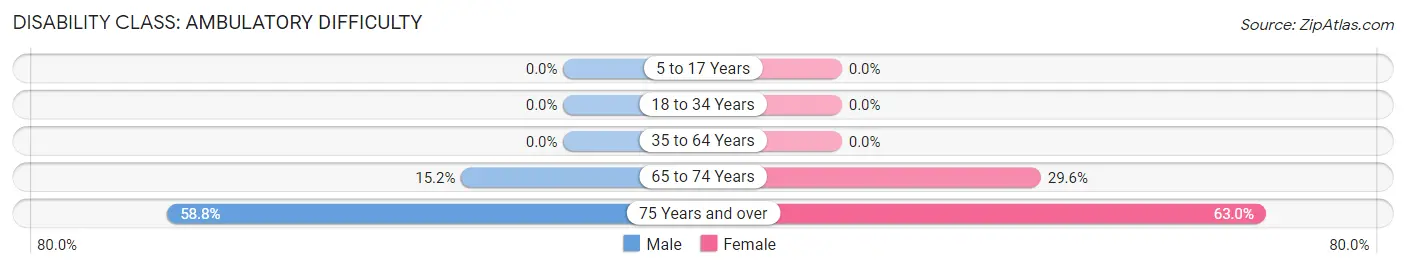
| Age Bracket | Male | Female |
| 5 to 17 Years | 0 (0.0%) | 0 (0.0%) |
| 18 to 34 Years | 0 (0.0%) | 0 (0.0%) |
| 35 to 64 Years | 0 (0.0%) | 0 (0.0%) |
| 65 to 74 Years | 5 (15.1%) | 13 (29.5%) |
| 75 Years and over | 10 (58.8%) | 17 (63.0%) |
Disability Class: Self-Care Difficulty
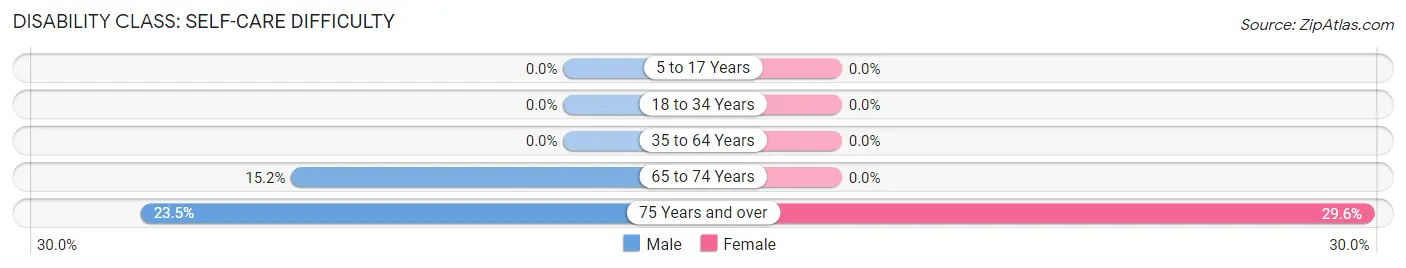
| Age Bracket | Male | Female |
| 5 to 17 Years | 0 (0.0%) | 0 (0.0%) |
| 18 to 34 Years | 0 (0.0%) | 0 (0.0%) |
| 35 to 64 Years | 0 (0.0%) | 0 (0.0%) |
| 65 to 74 Years | 5 (15.1%) | 0 (0.0%) |
| 75 Years and over | 4 (23.5%) | 8 (29.6%) |
Technology Access in Agua Dulce
Computing Device Access in Agua Dulce
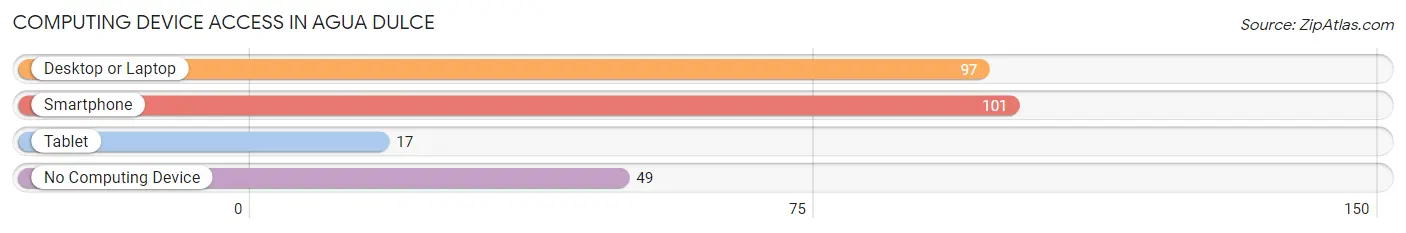
| Device Type | # Households | % Households |
| Desktop or Laptop | 97 | 59.5% |
| Smartphone | 101 | 62.0% |
| Tablet | 17 | 10.4% |
| No Computing Device | 49 | 30.1% |
| Total | 163 | 100.0% |
Internet Access in Agua Dulce
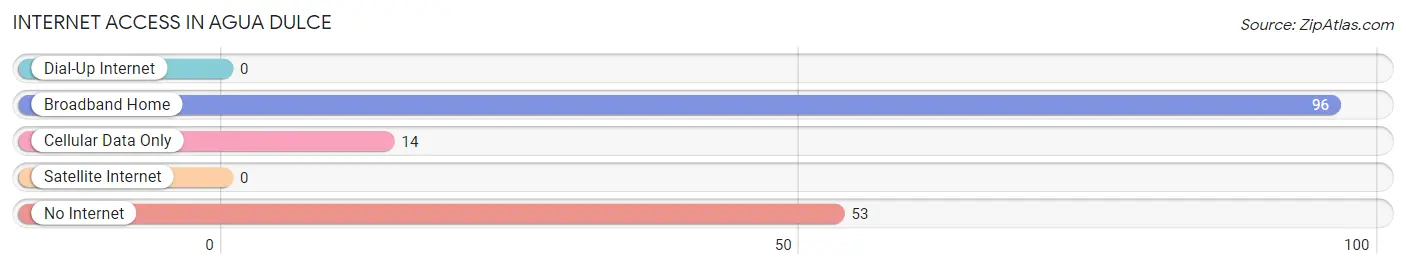
| Internet Type | # Households | % Households |
| Dial-Up Internet | 0 | 0.0% |
| Broadband Home | 96 | 58.9% |
| Cellular Data Only | 14 | 8.6% |
| Satellite Internet | 0 | 0.0% |
| No Internet | 53 | 32.5% |
| Total | 163 | 100.0% |
Agua Dulce Summary
Agua Dulce is a small town located in Nueces County, Texas, United States. It is situated about 25 miles south of Corpus Christi and is part of the Corpus Christi Metropolitan Statistical Area. The population of Agua Dulce was 1,093 at the 2010 census.
History
Agua Dulce was founded in 1883 by a group of settlers from Mexico. The town was named after the nearby Agua Dulce Creek, which translates to “sweet water” in Spanish. The town was originally a farming community, but it soon became a center for ranching and oil production.
In the early 1900s, the town was home to a number of businesses, including a general store, a blacksmith shop, a livery stable, and a hotel. The town also had a post office, which opened in 1884.
In the 1920s, the town experienced a period of growth due to the discovery of oil in the area. The population of Agua Dulce increased from about 500 in 1920 to over 1,000 in 1930.
Geography
Agua Dulce is located at 27°45'25" North, 97°45'25" West (27.756944, -97.756944). The town is situated in the Coastal Plains region of Texas, about 25 miles south of Corpus Christi.
The town is surrounded by farmland and ranches. The terrain is mostly flat, with some rolling hills. The climate is subtropical, with hot summers and mild winters.
Economy
The economy of Agua Dulce is largely based on agriculture and oil production. The town is home to several large ranches, as well as several oil and gas production companies.
The town also has a number of small businesses, including a grocery store, a hardware store, and a few restaurants.
Demographics
As of the 2010 census, the population of Agua Dulce was 1,093. The racial makeup of the town was 94.2% White, 0.7% African American, 0.2% Native American, 0.2% Asian, 0.1% Pacific Islander, 3.3% from other races, and 1.4% from two or more races. Hispanic or Latino of any race were 8.2% of the population.
The median household income in Agua Dulce was $37,500, and the median family income was $41,250. The per capita income was $17,845. About 15.2% of the population was below the poverty line.
Conclusion
Agua Dulce is a small town located in Nueces County, Texas. It was founded in 1883 by a group of settlers from Mexico and was originally a farming community. In the early 1900s, the town experienced a period of growth due to the discovery of oil in the area. Today, the economy of Agua Dulce is largely based on agriculture and oil production. The population of Agua Dulce was 1,093 at the 2010 census.
Common Questions
What is Per Capita Income in Agua Dulce?
Per Capita income in Agua Dulce is $24,184.
What is the Median Family Income in Agua Dulce?
Median Family Income in Agua Dulce is $67,750.
What is the Median Household income in Agua Dulce?
Median Household Income in Agua Dulce is $53,173.
What is Income or Wage Gap in Agua Dulce?
Income or Wage Gap in Agua Dulce is 43.7%.
Women in Agua Dulce earn 56.3 cents for every dollar earned by a man.
What is Inequality or Gini Index in Agua Dulce?
Inequality or Gini Index in Agua Dulce is 0.35.
What is the Total Population of Agua Dulce?
Total Population of Agua Dulce is 436.
What is the Total Male Population of Agua Dulce?
Total Male Population of Agua Dulce is 213.
What is the Total Female Population of Agua Dulce?
Total Female Population of Agua Dulce is 223.
What is the Ratio of Males per 100 Females in Agua Dulce?
There are 95.52 Males per 100 Females in Agua Dulce.
What is the Ratio of Females per 100 Males in Agua Dulce?
There are 104.69 Females per 100 Males in Agua Dulce.
What is the Median Population Age in Agua Dulce?
Median Population Age in Agua Dulce is 43.4 Years.
What is the Average Family Size in Agua Dulce
Average Family Size in Agua Dulce is 3.0 People.
What is the Average Household Size in Agua Dulce
Average Household Size in Agua Dulce is 2.7 People.
How Large is the Labor Force in Agua Dulce?
There are 184 People in the Labor Forcein in Agua Dulce.
What is the Percentage of People in the Labor Force in Agua Dulce?
51.1% of People are in the Labor Force in Agua Dulce.
What is the Unemployment Rate in Agua Dulce?
Unemployment Rate in Agua Dulce is 13.0%.