Abernathy, TX Map & Demographics
Abernathy Map
Abernathy Overview
$28,433
PER CAPITA INCOME
$90,541
AVG FAMILY INCOME
$80,114
AVG HOUSEHOLD INCOME
64.2%
WAGE / INCOME GAP [ % ]
35.8¢/ $1
WAGE / INCOME GAP [ $ ]
0.41
INEQUALITY / GINI INDEX
3,266
TOTAL POPULATION
1,508
MALE POPULATION
1,758
FEMALE POPULATION
85.78
MALES / 100 FEMALES
116.58
FEMALES / 100 MALES
37.4
MEDIAN AGE
3.4
AVG FAMILY SIZE
2.8
AVG HOUSEHOLD SIZE
1,506
LABOR FORCE [ PEOPLE ]
60.6%
PERCENT IN LABOR FORCE
1.6%
UNEMPLOYMENT RATE
Abernathy Zip Codes
Abernathy Area Codes
Income in Abernathy
Income Overview in Abernathy
Per Capita Income in Abernathy is $28,433, while median incomes of families and households are $90,541 and $80,114 respectively.
| Characteristic | Number | Measure |
| Per Capita Income | 3,266 | $28,433 |
| Median Family Income | 852 | $90,541 |
| Mean Family Income | 852 | $98,291 |
| Median Household Income | 1,164 | $80,114 |
| Mean Household Income | 1,164 | $81,256 |
| Income Deficit | 852 | $0 |
| Wage / Income Gap (%) | 3,266 | 64.18% |
| Wage / Income Gap ($) | 3,266 | 35.82¢ per $1 |
| Gini / Inequality Index | 3,266 | 0.41 |
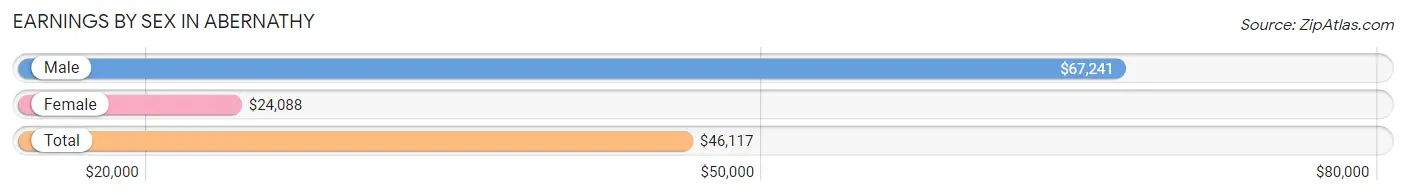
Earnings by Sex in Abernathy
Average Earnings in Abernathy are $46,117, $67,241 for men and $24,088 for women, a difference of 64.2%.
| Sex | Number | Average Earnings |
| Male | 772 (48.5%) | $67,241 |
| Female | 820 (51.5%) | $24,088 |
| Total | 1,592 (100.0%) | $46,117 |
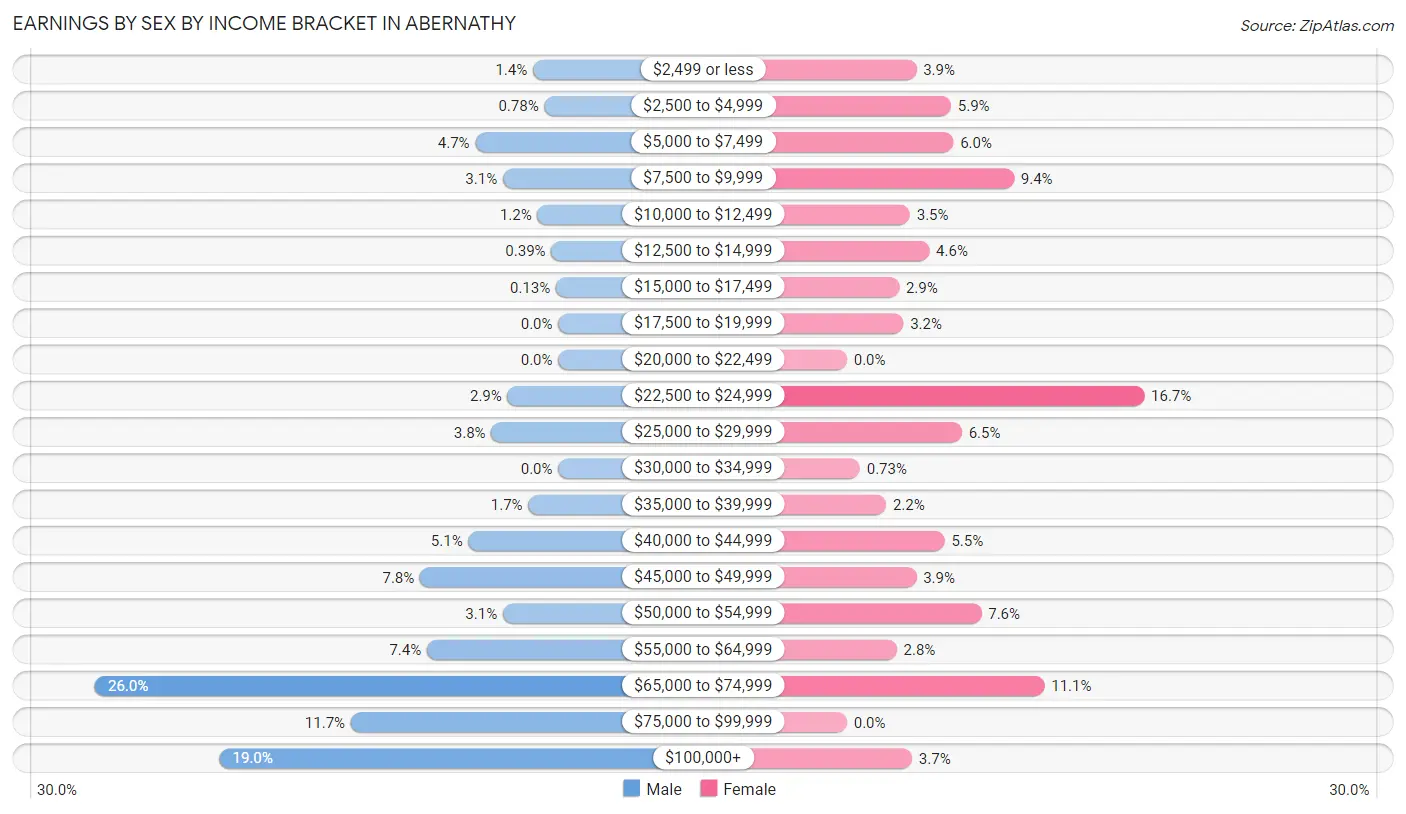
Earnings by Sex by Income Bracket in Abernathy
The most common earnings brackets in Abernathy are $65,000 to $74,999 for men (201 | 26.0%) and $22,500 to $24,999 for women (137 | 16.7%).
| Income | Male | Female |
| $2,499 or less | 11 (1.4%) | 32 (3.9%) |
| $2,500 to $4,999 | 6 (0.8%) | 48 (5.9%) |
| $5,000 to $7,499 | 36 (4.7%) | 49 (6.0%) |
| $7,500 to $9,999 | 24 (3.1%) | 77 (9.4%) |
| $10,000 to $12,499 | 9 (1.2%) | 29 (3.5%) |
| $12,500 to $14,999 | 3 (0.4%) | 38 (4.6%) |
| $15,000 to $17,499 | 1 (0.1%) | 24 (2.9%) |
| $17,500 to $19,999 | 0 (0.0%) | 26 (3.2%) |
| $20,000 to $22,499 | 0 (0.0%) | 0 (0.0%) |
| $22,500 to $24,999 | 22 (2.9%) | 137 (16.7%) |
| $25,000 to $29,999 | 29 (3.8%) | 53 (6.5%) |
| $30,000 to $34,999 | 0 (0.0%) | 6 (0.7%) |
| $35,000 to $39,999 | 13 (1.7%) | 18 (2.2%) |
| $40,000 to $44,999 | 39 (5.1%) | 45 (5.5%) |
| $45,000 to $49,999 | 60 (7.8%) | 32 (3.9%) |
| $50,000 to $54,999 | 24 (3.1%) | 62 (7.6%) |
| $55,000 to $64,999 | 57 (7.4%) | 23 (2.8%) |
| $65,000 to $74,999 | 201 (26.0%) | 91 (11.1%) |
| $75,000 to $99,999 | 90 (11.7%) | 0 (0.0%) |
| $100,000+ | 147 (19.0%) | 30 (3.7%) |
| Total | 772 (100.0%) | 820 (100.0%) |
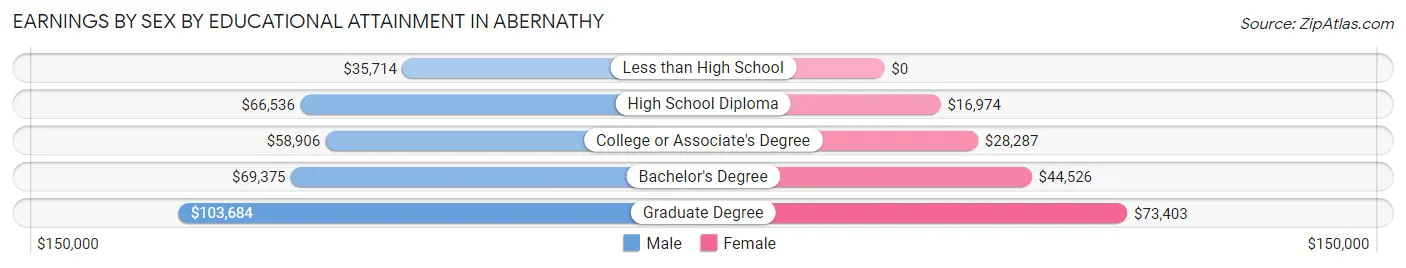
Earnings by Sex by Educational Attainment in Abernathy
Average earnings in Abernathy are $67,991 for men and $28,828 for women, a difference of 57.6%. Men with an educational attainment of graduate degree enjoy the highest average annual earnings of $103,684, while those with less than high school education earn the least with $35,714. Women with an educational attainment of graduate degree earn the most with the average annual earnings of $73,403, while those with high school diploma education have the smallest earnings of $16,974.
| Educational Attainment | Male Income | Female Income |
| Less than High School | $35,714 | $0 |
| High School Diploma | $66,536 | $16,974 |
| College or Associate's Degree | $58,906 | $28,287 |
| Bachelor's Degree | $69,375 | $44,526 |
| Graduate Degree | $103,684 | $73,403 |
| Total | $67,991 | $28,828 |
Family Income in Abernathy
Family Income Brackets in Abernathy
According to the Abernathy family income data, there are 289 families falling into the $75,000 to $99,999 income range, which is the most common income bracket and makes up 33.9% of all families.
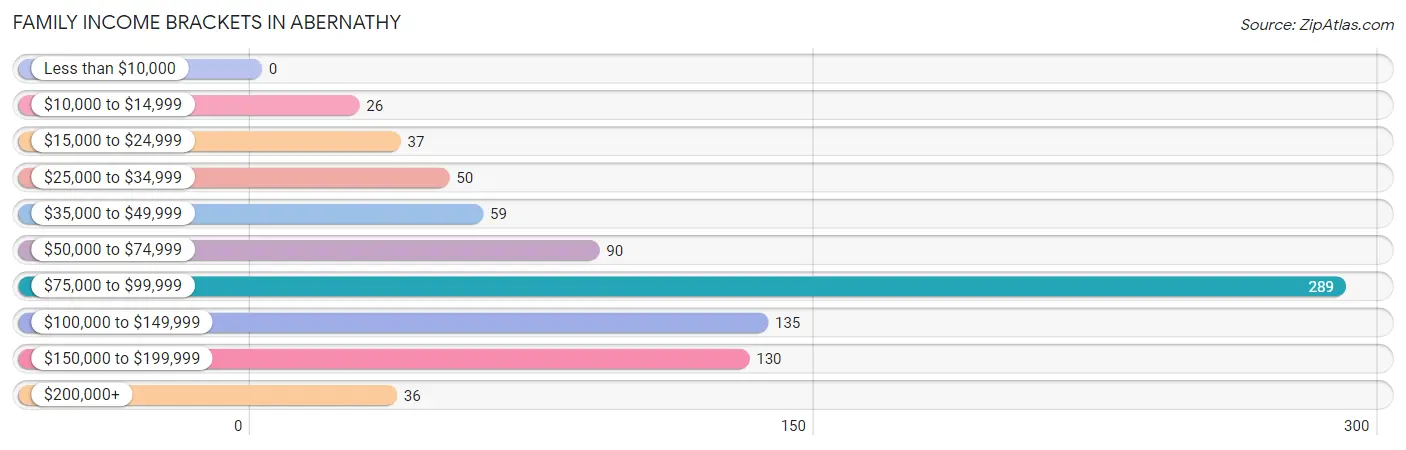
| Income Bracket | # Families | % Families |
| Less than $10,000 | 0 | 0.0% |
| $10,000 to $14,999 | 26 | 3.1% |
| $15,000 to $24,999 | 37 | 4.3% |
| $25,000 to $34,999 | 50 | 5.9% |
| $35,000 to $49,999 | 59 | 6.9% |
| $50,000 to $74,999 | 90 | 10.6% |
| $75,000 to $99,999 | 289 | 33.9% |
| $100,000 to $149,999 | 135 | 15.8% |
| $150,000 to $199,999 | 130 | 15.3% |
| $200,000+ | 36 | 4.2% |
Family Income by Famaliy Size in Abernathy
5-person families (122 | 14.3%) account for the highest median family income in Abernathy with $178,421 per family, while 5-person families (122 | 14.3%) have the highest median income of $35,684 per family member.
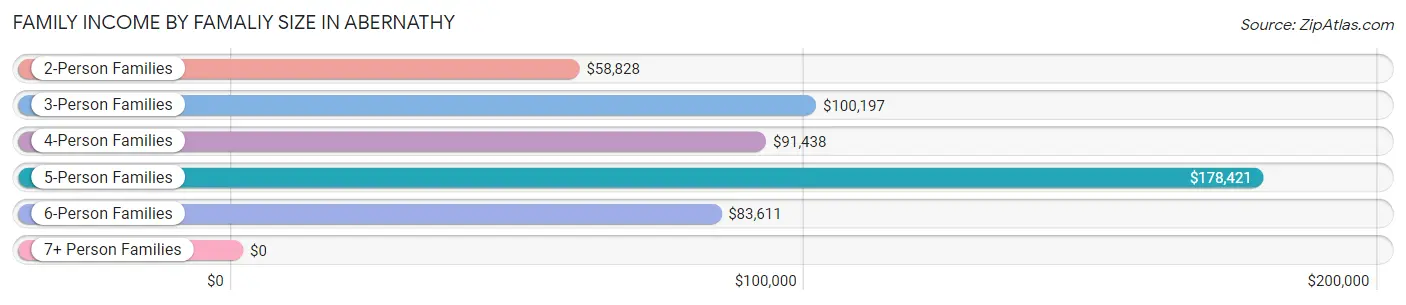
| Income Bracket | # Families | Median Income |
| 2-Person Families | 277 (32.5%) | $58,828 |
| 3-Person Families | 155 (18.2%) | $100,197 |
| 4-Person Families | 241 (28.3%) | $91,438 |
| 5-Person Families | 122 (14.3%) | $178,421 |
| 6-Person Families | 28 (3.3%) | $83,611 |
| 7+ Person Families | 29 (3.4%) | $0 |
| Total | 852 (100.0%) | $90,541 |
Family Income by Number of Earners in Abernathy
The median family income in Abernathy is $90,541, with families comprising 3+ earners (43) having the highest median family income of $99,107, while families with no earners (76) have the lowest median family income of $34,500, accounting for 5.1% and 8.9% of families, respectively.
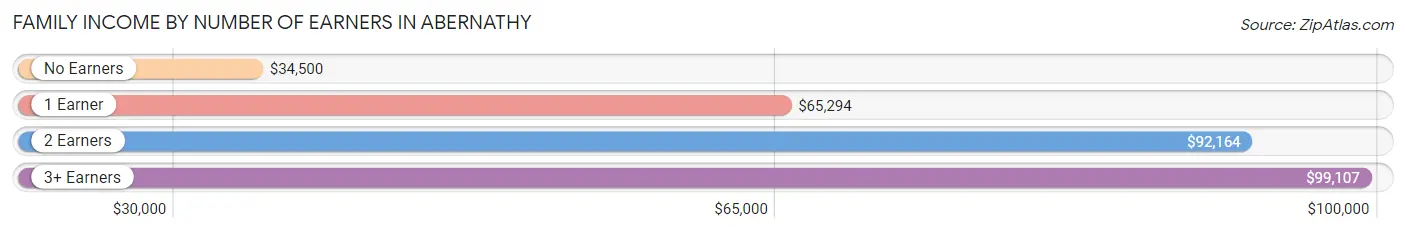
| Number of Earners | # Families | Median Income |
| No Earners | 76 (8.9%) | $34,500 |
| 1 Earner | 150 (17.6%) | $65,294 |
| 2 Earners | 583 (68.4%) | $92,164 |
| 3+ Earners | 43 (5.1%) | $99,107 |
| Total | 852 (100.0%) | $90,541 |
Household Income in Abernathy
Household Income Brackets in Abernathy
With 310 households falling in the category, the $75,000 to $99,999 income range is the most frequent in Abernathy, accounting for 26.6% of all households. In contrast, only 36 households (3.1%) fall into the less than $10,000 income bracket, making it the least populous group.
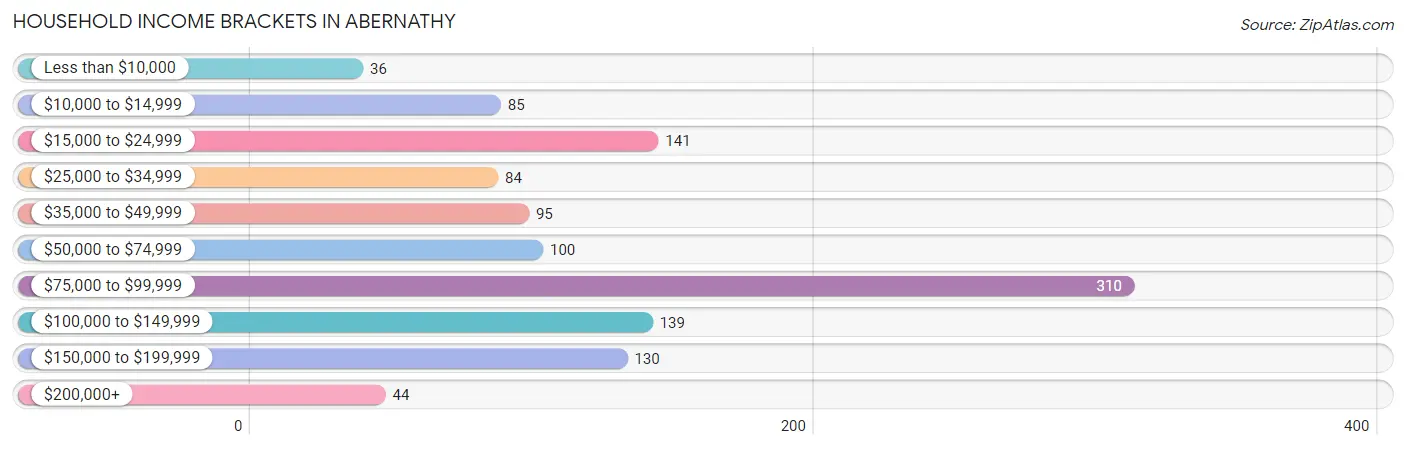
| Income Bracket | # Households | % Households |
| Less than $10,000 | 36 | 3.1% |
| $10,000 to $14,999 | 85 | 7.3% |
| $15,000 to $24,999 | 141 | 12.1% |
| $25,000 to $34,999 | 84 | 7.2% |
| $35,000 to $49,999 | 95 | 8.2% |
| $50,000 to $74,999 | 100 | 8.6% |
| $75,000 to $99,999 | 310 | 26.6% |
| $100,000 to $149,999 | 139 | 11.9% |
| $150,000 to $199,999 | 130 | 11.2% |
| $200,000+ | 44 | 3.8% |
Household Income by Householder Age in Abernathy
The median household income in Abernathy is $80,114, with the highest median household income of $101,528 found in the 45 to 64 years age bracket for the primary householder. A total of 255 households (21.9%) fall into this category. Meanwhile, the 15 to 24 years age bracket for the primary householder has the lowest median household income of $0, with 51 households (4.4%) in this group.
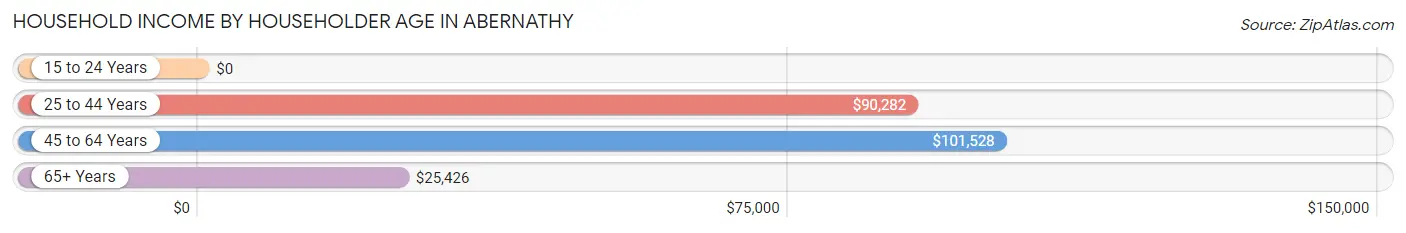
| Income Bracket | # Households | Median Income |
| 15 to 24 Years | 51 (4.4%) | $0 |
| 25 to 44 Years | 501 (43.0%) | $90,282 |
| 45 to 64 Years | 255 (21.9%) | $101,528 |
| 65+ Years | 357 (30.7%) | $25,426 |
| Total | 1,164 (100.0%) | $80,114 |
Poverty in Abernathy
Income Below Poverty by Sex and Age in Abernathy
With 4.2% poverty level for males and 8.2% for females among the residents of Abernathy, 15 year old males and 75 year old and over females are the most vulnerable to poverty, with 27 males (100.0%) and 43 females (40.9%) in their respective age groups living below the poverty level.
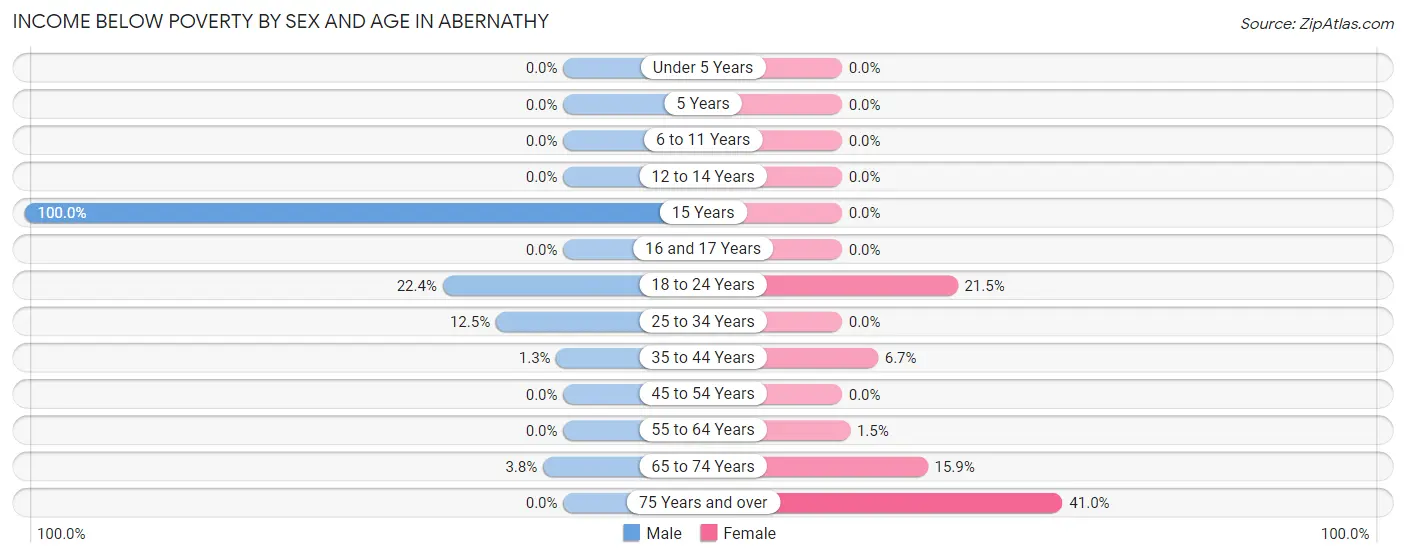
| Age Bracket | Male | Female |
| Under 5 Years | 0 (0.0%) | 0 (0.0%) |
| 5 Years | 0 (0.0%) | 0 (0.0%) |
| 6 to 11 Years | 0 (0.0%) | 0 (0.0%) |
| 12 to 14 Years | 0 (0.0%) | 0 (0.0%) |
| 15 Years | 27 (100.0%) | 0 (0.0%) |
| 16 and 17 Years | 0 (0.0%) | 0 (0.0%) |
| 18 to 24 Years | 15 (22.4%) | 38 (21.5%) |
| 25 to 34 Years | 12 (12.5%) | 0 (0.0%) |
| 35 to 44 Years | 5 (1.3%) | 26 (6.7%) |
| 45 to 54 Years | 0 (0.0%) | 0 (0.0%) |
| 55 to 64 Years | 0 (0.0%) | 2 (1.5%) |
| 65 to 74 Years | 4 (3.8%) | 35 (15.9%) |
| 75 Years and over | 0 (0.0%) | 43 (40.9%) |
| Total | 63 (4.2%) | 144 (8.2%) |
Income Above Poverty by Sex and Age in Abernathy
According to the poverty statistics in Abernathy, males aged under 5 years and females aged under 5 years are the age groups that are most secure financially, with 100.0% of males and 100.0% of females in these age groups living above the poverty line.
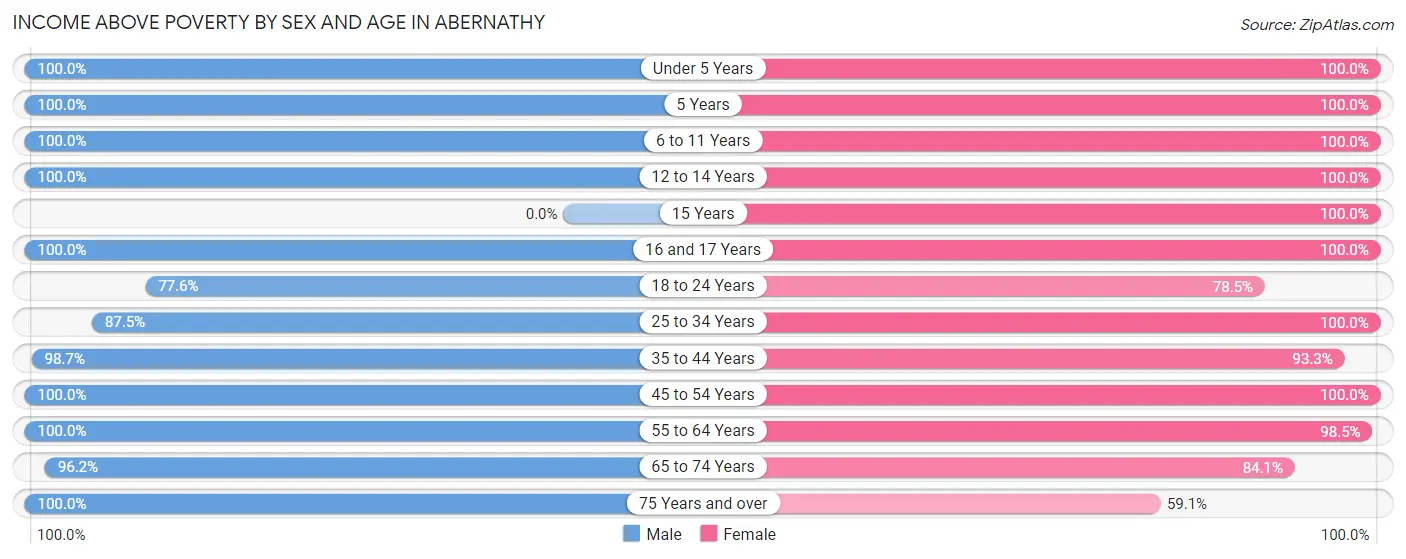
| Age Bracket | Male | Female |
| Under 5 Years | 88 (100.0%) | 116 (100.0%) |
| 5 Years | 14 (100.0%) | 12 (100.0%) |
| 6 to 11 Years | 181 (100.0%) | 175 (100.0%) |
| 12 to 14 Years | 63 (100.0%) | 84 (100.0%) |
| 15 Years | 0 (0.0%) | 11 (100.0%) |
| 16 and 17 Years | 206 (100.0%) | 116 (100.0%) |
| 18 to 24 Years | 52 (77.6%) | 139 (78.5%) |
| 25 to 34 Years | 84 (87.5%) | 90 (100.0%) |
| 35 to 44 Years | 383 (98.7%) | 363 (93.3%) |
| 45 to 54 Years | 135 (100.0%) | 121 (100.0%) |
| 55 to 64 Years | 70 (100.0%) | 130 (98.5%) |
| 65 to 74 Years | 102 (96.2%) | 185 (84.1%) |
| 75 Years and over | 67 (100.0%) | 62 (59.1%) |
| Total | 1,445 (95.8%) | 1,604 (91.8%) |
Income Below Poverty Among Married-Couple Families in Abernathy
The poverty statistics for married-couple families in Abernathy show that 3.5% or 26 of the total 749 families live below the poverty line. Families with no children have the highest poverty rate of 10.0%, comprising of 26 families. On the other hand, families with 1 or 2 children have the lowest poverty rate of 0.0%, which includes 0 families.
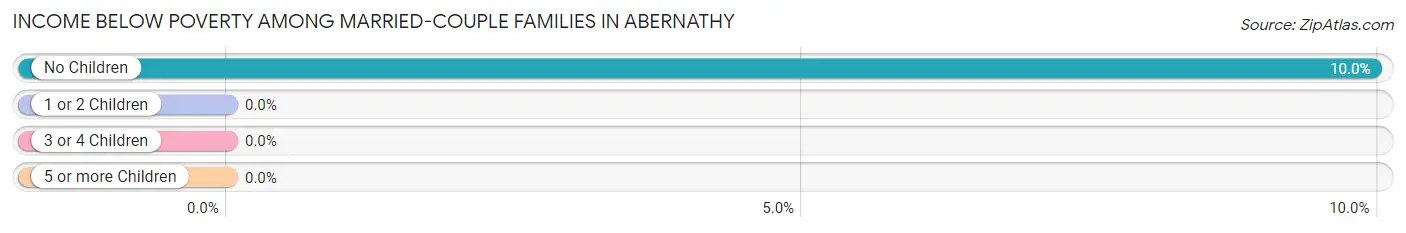
| Children | Above Poverty | Below Poverty |
| No Children | 235 (90.0%) | 26 (10.0%) |
| 1 or 2 Children | 309 (100.0%) | 0 (0.0%) |
| 3 or 4 Children | 150 (100.0%) | 0 (0.0%) |
| 5 or more Children | 29 (100.0%) | 0 (0.0%) |
| Total | 723 (96.5%) | 26 (3.5%) |
Income Below Poverty Among Single-Parent Households in Abernathy
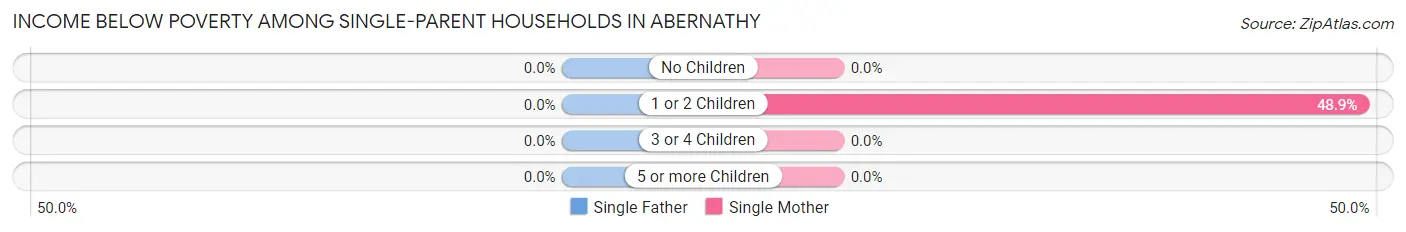
| Children | Single Father | Single Mother |
| No Children | 0 (0.0%) | 0 (0.0%) |
| 1 or 2 Children | 0 (0.0%) | 23 (48.9%) |
| 3 or 4 Children | 0 (0.0%) | 0 (0.0%) |
| 5 or more Children | 0 (0.0%) | 0 (0.0%) |
| Total | 0 (0.0%) | 23 (28.4%) |
Income Below Poverty Among Married-Couple vs Single-Parent Households in Abernathy
The poverty data for Abernathy shows that 26 of the married-couple family households (3.5%) and 23 of the single-parent households (22.3%) are living below the poverty level. Within the married-couple family households, those with no children have the highest poverty rate, with 26 households (10.0%) falling below the poverty line. Among the single-parent households, those with 1 or 2 children have the highest poverty rate, with 23 household (41.8%) living below poverty.
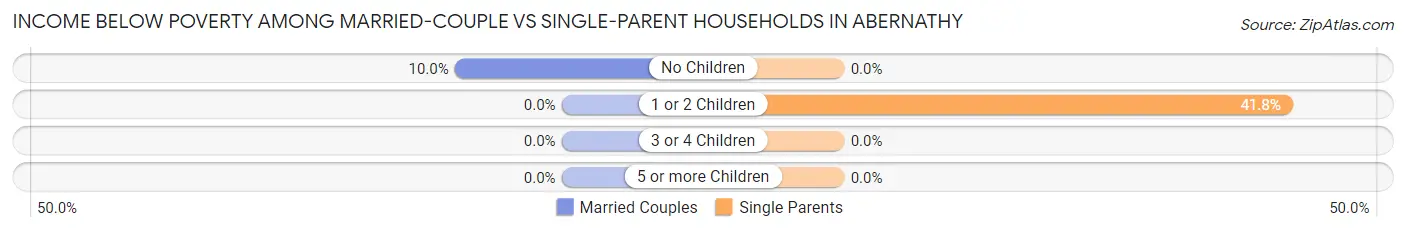
| Children | Married-Couple Families | Single-Parent Households |
| No Children | 26 (10.0%) | 0 (0.0%) |
| 1 or 2 Children | 0 (0.0%) | 23 (41.8%) |
| 3 or 4 Children | 0 (0.0%) | 0 (0.0%) |
| 5 or more Children | 0 (0.0%) | 0 (0.0%) |
| Total | 26 (3.5%) | 23 (22.3%) |
Race in Abernathy
The most populous races in Abernathy are White / Caucasian (2,724 | 83.4%), Hispanic or Latino (1,563 | 47.9%), and Two or more Races (232 | 7.1%).
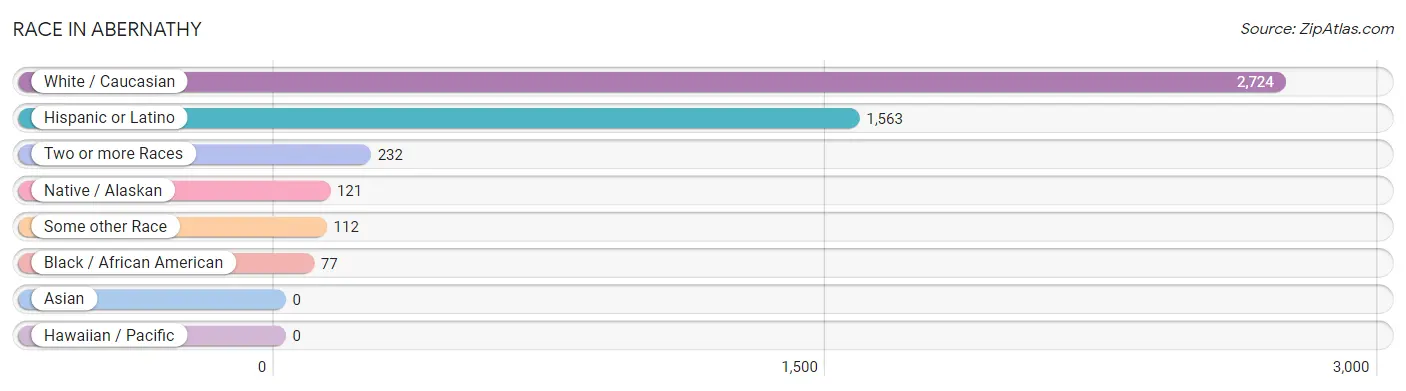
| Race | # Population | % Population |
| Asian | 0 | 0.0% |
| Black / African American | 77 | 2.4% |
| Hawaiian / Pacific | 0 | 0.0% |
| Hispanic or Latino | 1,563 | 47.9% |
| Native / Alaskan | 121 | 3.7% |
| White / Caucasian | 2,724 | 83.4% |
| Two or more Races | 232 | 7.1% |
| Some other Race | 112 | 3.4% |
| Total | 3,266 | 100.0% |
Ancestry in Abernathy
The most populous ancestries reported in Abernathy are Mexican (1,432 | 43.9%), German (234 | 7.2%), American (215 | 6.6%), Irish (196 | 6.0%), and English (151 | 4.6%), together accounting for 68.2% of all Abernathy residents.
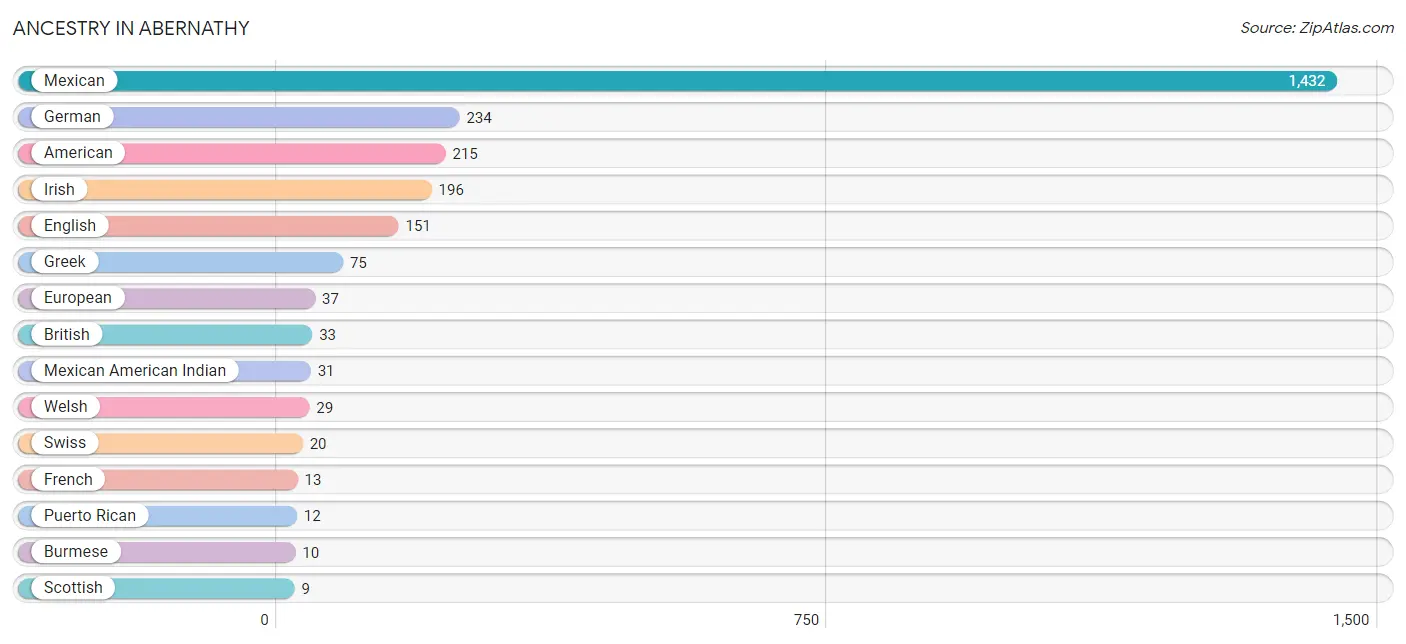
| Ancestry | # Population | % Population |
| American | 215 | 6.6% |
| Austrian | 4 | 0.1% |
| British | 33 | 1.0% |
| Burmese | 10 | 0.3% |
| Choctaw | 3 | 0.1% |
| Dutch | 2 | 0.1% |
| English | 151 | 4.6% |
| European | 37 | 1.1% |
| French | 13 | 0.4% |
| German | 234 | 7.2% |
| Greek | 75 | 2.3% |
| Irish | 196 | 6.0% |
| Mexican | 1,432 | 43.9% |
| Mexican American Indian | 31 | 0.9% |
| Norwegian | 3 | 0.1% |
| Puerto Rican | 12 | 0.4% |
| Scottish | 9 | 0.3% |
| Swiss | 20 | 0.6% |
| Welsh | 29 | 0.9% | View All 19 Rows |
Immigrants in Abernathy
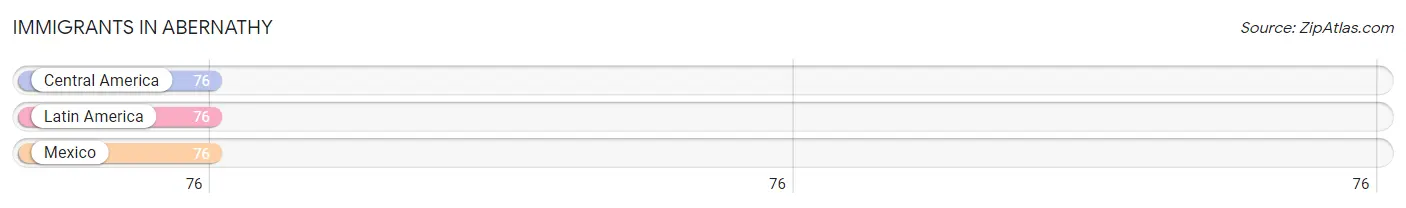
The most numerous immigrant groups reported in Abernathy came from Central America (76 | 2.3%), Latin America (76 | 2.3%), and Mexico (76 | 2.3%), together accounting for 7.0% of all Abernathy residents.
| Immigration Origin | # Population | % Population |
| Central America | 76 | 2.3% |
| Latin America | 76 | 2.3% |
| Mexico | 76 | 2.3% | View All 3 Rows |
Sex and Age in Abernathy
Sex and Age in Abernathy
The most populous age groups in Abernathy are 40 to 44 Years (270 | 17.9%) for men and 35 to 39 Years (209 | 11.9%) for women.
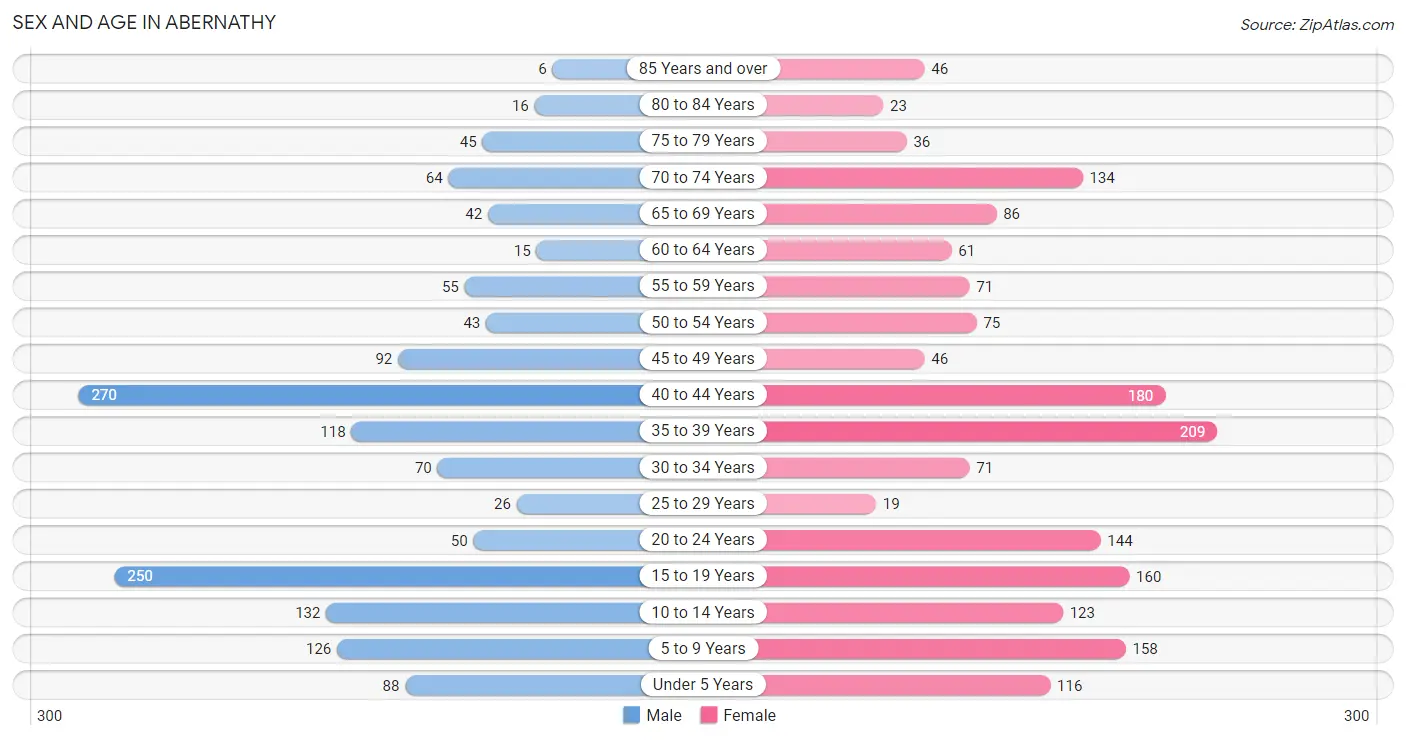
| Age Bracket | Male | Female |
| Under 5 Years | 88 (5.8%) | 116 (6.6%) |
| 5 to 9 Years | 126 (8.4%) | 158 (9.0%) |
| 10 to 14 Years | 132 (8.7%) | 123 (7.0%) |
| 15 to 19 Years | 250 (16.6%) | 160 (9.1%) |
| 20 to 24 Years | 50 (3.3%) | 144 (8.2%) |
| 25 to 29 Years | 26 (1.7%) | 19 (1.1%) |
| 30 to 34 Years | 70 (4.6%) | 71 (4.0%) |
| 35 to 39 Years | 118 (7.8%) | 209 (11.9%) |
| 40 to 44 Years | 270 (17.9%) | 180 (10.2%) |
| 45 to 49 Years | 92 (6.1%) | 46 (2.6%) |
| 50 to 54 Years | 43 (2.9%) | 75 (4.3%) |
| 55 to 59 Years | 55 (3.6%) | 71 (4.0%) |
| 60 to 64 Years | 15 (1.0%) | 61 (3.5%) |
| 65 to 69 Years | 42 (2.8%) | 86 (4.9%) |
| 70 to 74 Years | 64 (4.2%) | 134 (7.6%) |
| 75 to 79 Years | 45 (3.0%) | 36 (2.1%) |
| 80 to 84 Years | 16 (1.1%) | 23 (1.3%) |
| 85 Years and over | 6 (0.4%) | 46 (2.6%) |
| Total | 1,508 (100.0%) | 1,758 (100.0%) |
Families and Households in Abernathy
Median Family Size in Abernathy
The median family size in Abernathy is 3.41 persons per family, with single female/mother families (81 | 9.5%) accounting for the largest median family size of 3.52 persons per family. On the other hand, single male/father families (22 | 2.6%) represent the smallest median family size with 2.36 persons per family.
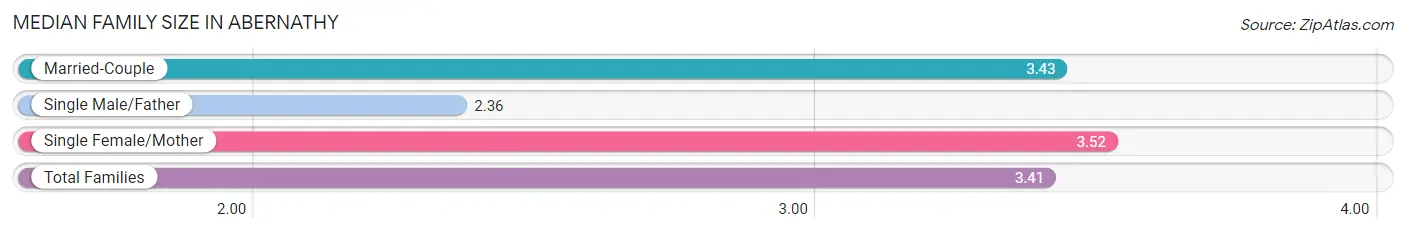
| Family Type | # Families | Family Size |
| Married-Couple | 749 (87.9%) | 3.43 |
| Single Male/Father | 22 (2.6%) | 2.36 |
| Single Female/Mother | 81 (9.5%) | 3.52 |
| Total Families | 852 (100.0%) | 3.41 |
Median Household Size in Abernathy
The median household size in Abernathy is 2.80 persons per household, with single female/mother households (81 | 7.0%) accounting for the largest median household size of 3.52 persons per household. non-family households (312 | 26.8%) represent the smallest median household size with 1.13 persons per household.
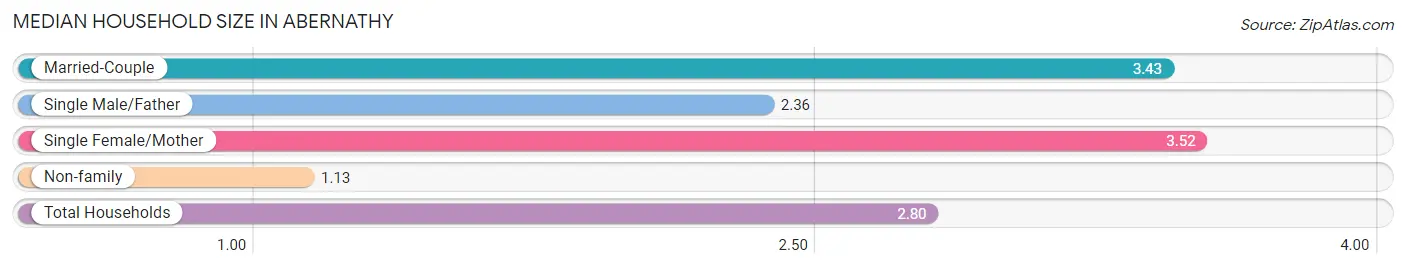
| Household Type | # Households | Household Size |
| Married-Couple | 749 (64.3%) | 3.43 |
| Single Male/Father | 22 (1.9%) | 2.36 |
| Single Female/Mother | 81 (7.0%) | 3.52 |
| Non-family | 312 (26.8%) | 1.13 |
| Total Households | 1,164 (100.0%) | 2.80 |
Household Size by Marriage Status in Abernathy
Out of a total of 1,164 households in Abernathy, 852 (73.2%) are family households, while 312 (26.8%) are nonfamily households. The most numerous type of family households are 2-person households, comprising 277, and the most common type of nonfamily households are 1-person households, comprising 281.
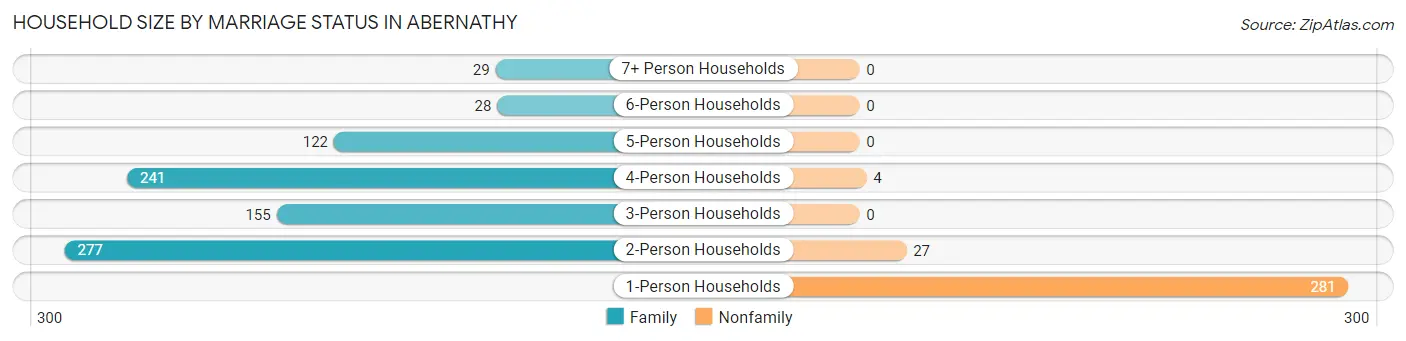
| Household Size | Family Households | Nonfamily Households |
| 1-Person Households | - | 281 (24.1%) |
| 2-Person Households | 277 (23.8%) | 27 (2.3%) |
| 3-Person Households | 155 (13.3%) | 0 (0.0%) |
| 4-Person Households | 241 (20.7%) | 4 (0.3%) |
| 5-Person Households | 122 (10.5%) | 0 (0.0%) |
| 6-Person Households | 28 (2.4%) | 0 (0.0%) |
| 7+ Person Households | 29 (2.5%) | 0 (0.0%) |
| Total | 852 (73.2%) | 312 (26.8%) |
Female Fertility in Abernathy
Fertility by Age in Abernathy
Average fertility rate in Abernathy is 29.0 births per 1,000 women. Women in the age bracket of 15 to 19 years have the highest fertility rate with 75.0 births per 1,000 women. Women in the age bracket of 20 to 34 years acount for 52.0% of all women with births.
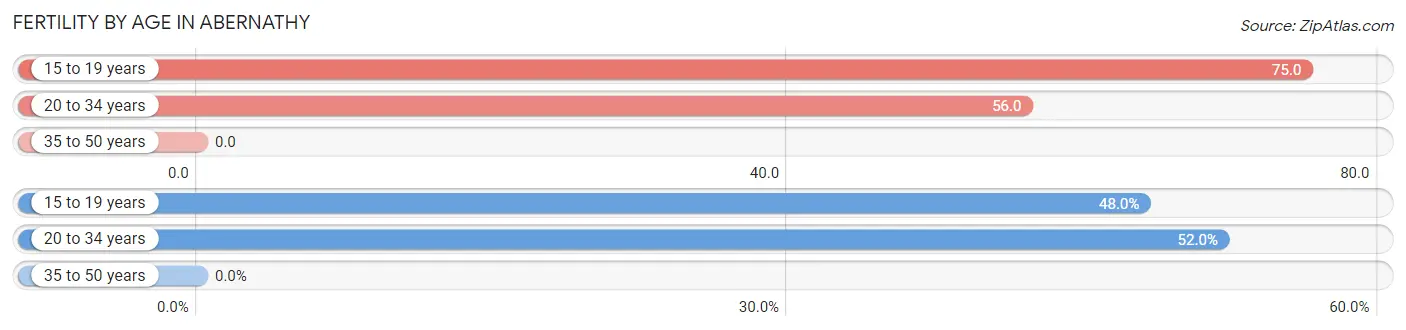
| Age Bracket | Women with Births | Births / 1,000 Women |
| 15 to 19 years | 12 (48.0%) | 75.0 |
| 20 to 34 years | 13 (52.0%) | 56.0 |
| 35 to 50 years | 0 (0.0%) | 0.0 |
| Total | 25 (100.0%) | 29.0 |
Fertility by Age by Marriage Status in Abernathy
52.0% of women with births (25) in Abernathy are married. The highest percentage of unmarried women with births falls into 15 to 19 years age bracket with 100.0% of them unmarried at the time of birth, while the lowest percentage of unmarried women with births belong to 20 to 34 years age bracket with 0.0% of them unmarried.
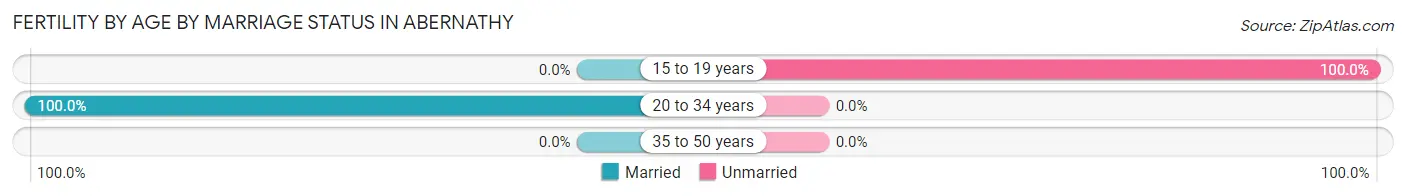
| Age Bracket | Married | Unmarried |
| 15 to 19 years | 0 (0.0%) | 12 (100.0%) |
| 20 to 34 years | 13 (100.0%) | 0 (0.0%) |
| 35 to 50 years | 0 (0.0%) | 0 (0.0%) |
| Total | 13 (52.0%) | 12 (48.0%) |
Fertility by Education in Abernathy
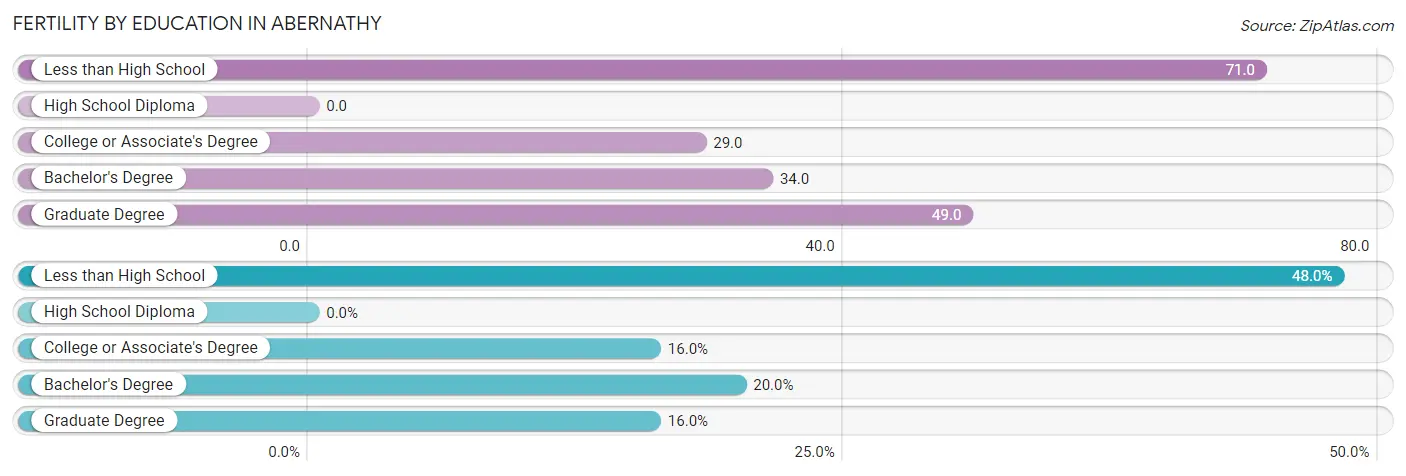
| Educational Attainment | Women with Births | Births / 1,000 Women |
| Less than High School | 12 (48.0%) | 71.0 |
| High School Diploma | 0 (0.0%) | 0.0 |
| College or Associate's Degree | 4 (16.0%) | 29.0 |
| Bachelor's Degree | 5 (20.0%) | 34.0 |
| Graduate Degree | 4 (16.0%) | 49.0 |
| Total | 25 (100.0%) | 29.0 |
Fertility by Education by Marriage Status in Abernathy
48.0% of women with births in Abernathy are unmarried. Women with the educational attainment of college or associate's degree are most likely to be married with 100.0% of them married at childbirth, while women with the educational attainment of less than high school are least likely to be married with 100.0% of them unmarried at childbirth.
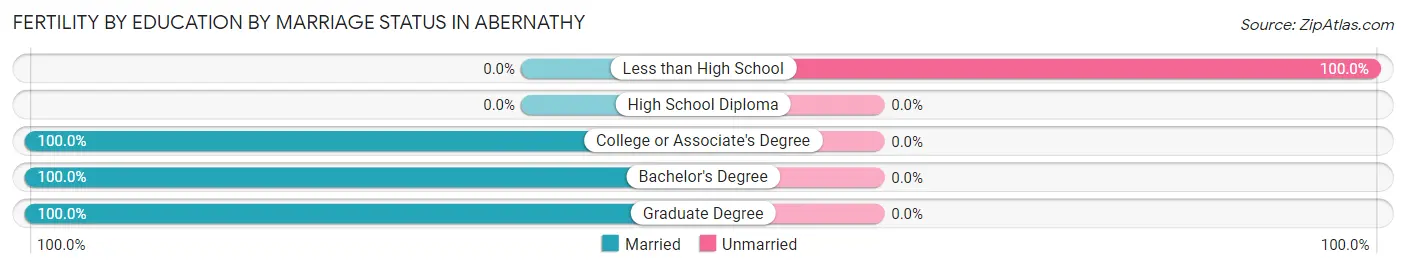
| Educational Attainment | Married | Unmarried |
| Less than High School | 0 (0.0%) | 12 (100.0%) |
| High School Diploma | 0 (0.0%) | 0 (0.0%) |
| College or Associate's Degree | 4 (100.0%) | 0 (0.0%) |
| Bachelor's Degree | 5 (100.0%) | 0 (0.0%) |
| Graduate Degree | 4 (100.0%) | 0 (0.0%) |
| Total | 13 (52.0%) | 12 (48.0%) |
Employment Characteristics in Abernathy
Employment by Class of Employer in Abernathy
Among the 1,419 employed individuals in Abernathy, private company employees (868 | 61.2%), state government employees (205 | 14.4%), and local government employees (148 | 10.4%) make up the most common classes of employment.
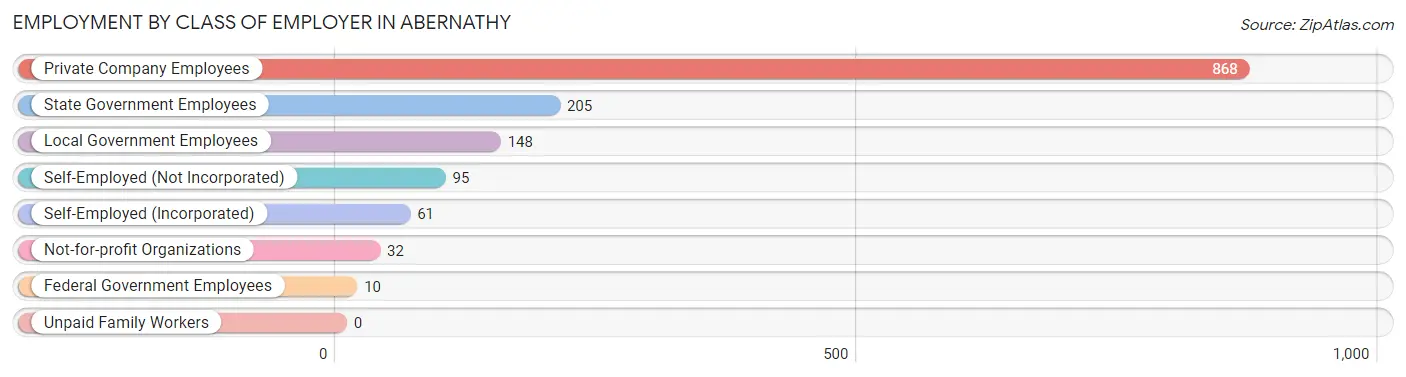
| Employer Class | # Employees | % Employees |
| Private Company Employees | 868 | 61.2% |
| Self-Employed (Incorporated) | 61 | 4.3% |
| Self-Employed (Not Incorporated) | 95 | 6.7% |
| Not-for-profit Organizations | 32 | 2.3% |
| Local Government Employees | 148 | 10.4% |
| State Government Employees | 205 | 14.4% |
| Federal Government Employees | 10 | 0.7% |
| Unpaid Family Workers | 0 | 0.0% |
| Total | 1,419 | 100.0% |
Employment Status by Age in Abernathy
According to the labor force statistics for Abernathy, out of the total population over 16 years of age (2,485), 60.6% or 1,506 individuals are in the labor force, with 1.6% or 24 of them unemployed. The age group with the highest labor force participation rate is 25 to 29 years, with 100.0% or 45 individuals in the labor force. Within the labor force, the 16 to 19 years age range has the highest percentage of unemployed individuals, with 8.8% or 6 of them being unemployed.
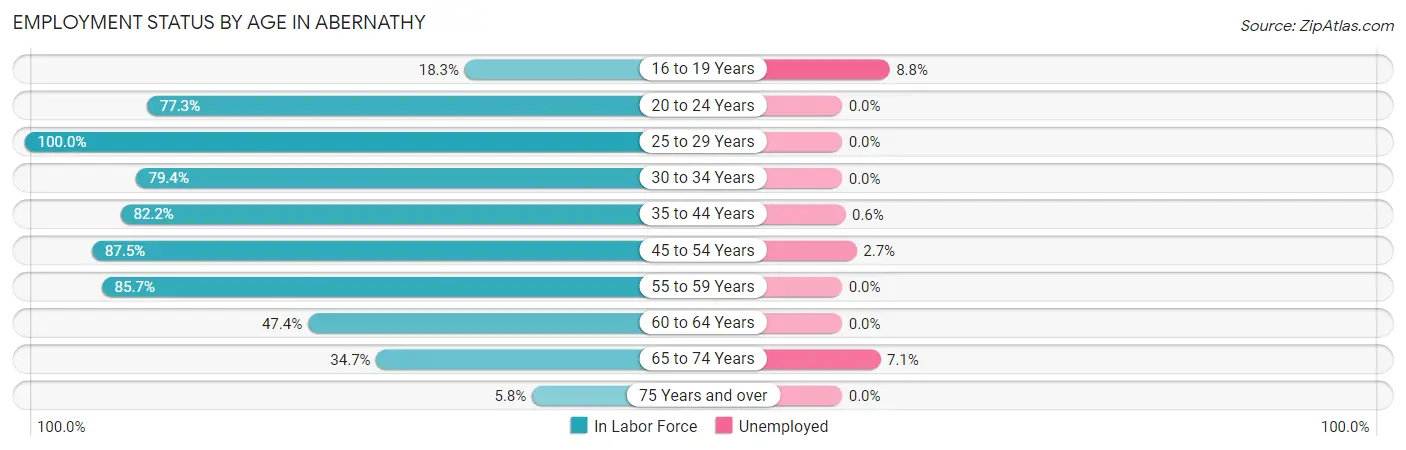
| Age Bracket | In Labor Force | Unemployed |
| 16 to 19 Years | 68 (18.3%) | 6 (8.8%) |
| 20 to 24 Years | 150 (77.3%) | 0 (0.0%) |
| 25 to 29 Years | 45 (100.0%) | 0 (0.0%) |
| 30 to 34 Years | 112 (79.4%) | 0 (0.0%) |
| 35 to 44 Years | 639 (82.2%) | 4 (0.6%) |
| 45 to 54 Years | 224 (87.5%) | 6 (2.7%) |
| 55 to 59 Years | 108 (85.7%) | 0 (0.0%) |
| 60 to 64 Years | 36 (47.4%) | 0 (0.0%) |
| 65 to 74 Years | 113 (34.7%) | 8 (7.1%) |
| 75 Years and over | 10 (5.8%) | 0 (0.0%) |
| Total | 1,506 (60.6%) | 24 (1.6%) |
Employment Status by Educational Attainment in Abernathy
According to labor force statistics for Abernathy, 81.9% of individuals (1,164) out of the total population between 25 and 64 years of age (1,421) are in the labor force, with 0.9% or 10 of them being unemployed. The group with the highest labor force participation rate are those with the educational attainment of bachelor's degree or higher, with 99.1% or 445 individuals in the labor force. Within the labor force, individuals with less than high school education have the highest percentage of unemployment, with 6.5% or 4 of them being unemployed.
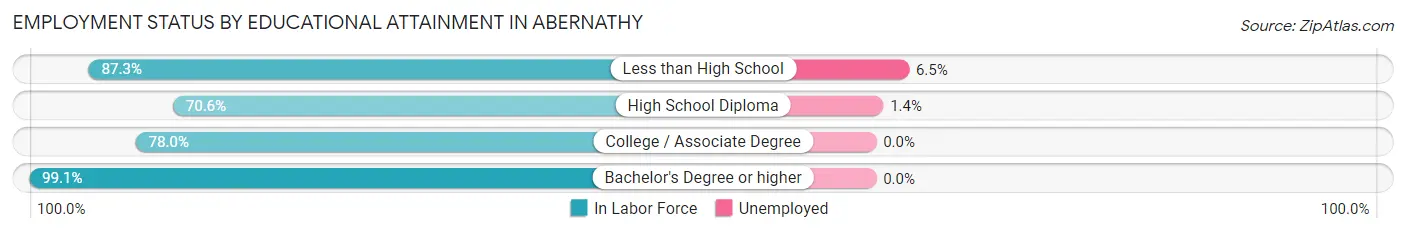
| Educational Attainment | In Labor Force | Unemployed |
| Less than High School | 62 (87.3%) | 5 (6.5%) |
| High School Diploma | 437 (70.6%) | 9 (1.4%) |
| College / Associate Degree | 220 (78.0%) | 0 (0.0%) |
| Bachelor's Degree or higher | 445 (99.1%) | 0 (0.0%) |
| Total | 1,164 (81.9%) | 13 (0.9%) |
Employment Occupations by Sex in Abernathy
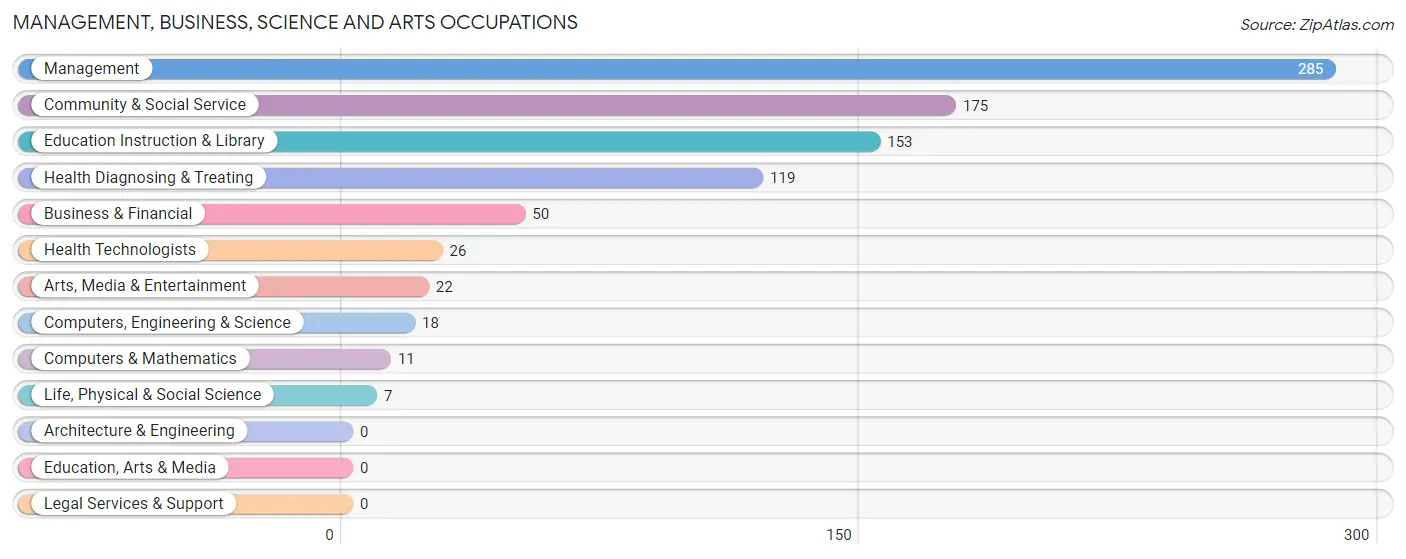
Management, Business, Science and Arts Occupations
The most common Management, Business, Science and Arts occupations in Abernathy are Management (285 | 19.2%), Community & Social Service (175 | 11.8%), Education Instruction & Library (153 | 10.3%), Health Diagnosing & Treating (119 | 8.0%), and Business & Financial (50 | 3.4%).
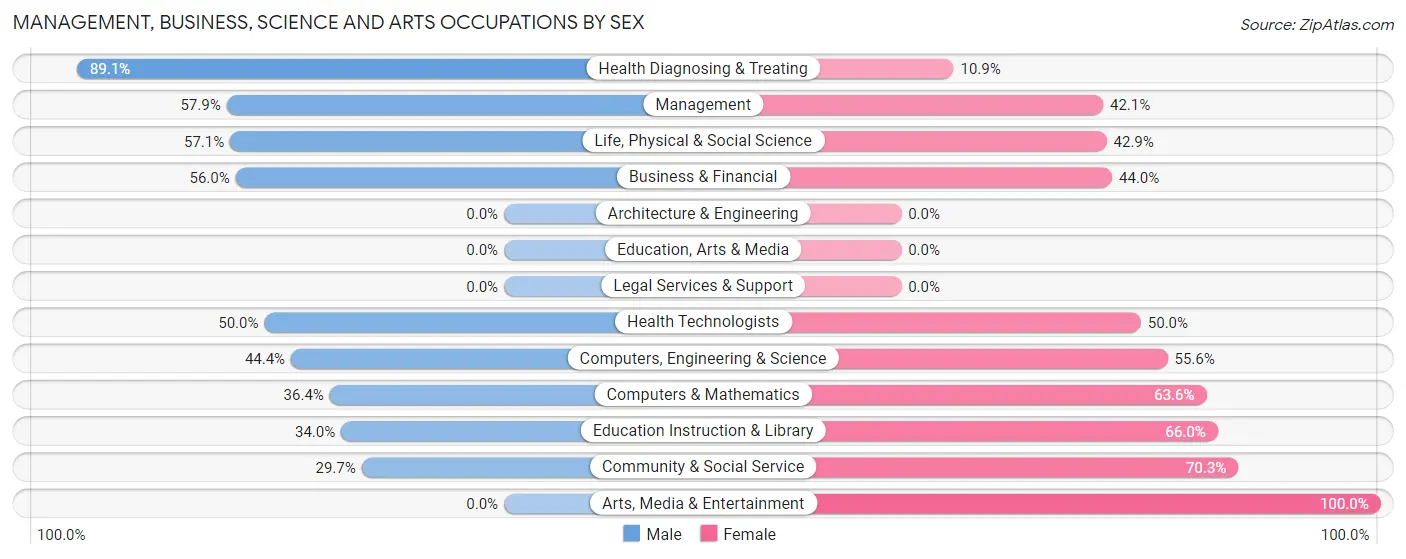
Management, Business, Science and Arts Occupations by Sex
Within the Management, Business, Science and Arts occupations in Abernathy, the most male-oriented occupations are Health Diagnosing & Treating (89.1%), Management (57.9%), and Life, Physical & Social Science (57.1%), while the most female-oriented occupations are Arts, Media & Entertainment (100.0%), Community & Social Service (70.3%), and Education Instruction & Library (66.0%).
| Occupation | Male | Female |
| Management | 165 (57.9%) | 120 (42.1%) |
| Business & Financial | 28 (56.0%) | 22 (44.0%) |
| Computers, Engineering & Science | 8 (44.4%) | 10 (55.6%) |
| Computers & Mathematics | 4 (36.4%) | 7 (63.6%) |
| Architecture & Engineering | 0 (0.0%) | 0 (0.0%) |
| Life, Physical & Social Science | 4 (57.1%) | 3 (42.9%) |
| Community & Social Service | 52 (29.7%) | 123 (70.3%) |
| Education, Arts & Media | 0 (0.0%) | 0 (0.0%) |
| Legal Services & Support | 0 (0.0%) | 0 (0.0%) |
| Education Instruction & Library | 52 (34.0%) | 101 (66.0%) |
| Arts, Media & Entertainment | 0 (0.0%) | 22 (100.0%) |
| Health Diagnosing & Treating | 106 (89.1%) | 13 (10.9%) |
| Health Technologists | 13 (50.0%) | 13 (50.0%) |
| Total (Category) | 359 (55.5%) | 288 (44.5%) |
| Total (Overall) | 743 (50.2%) | 738 (49.8%) |
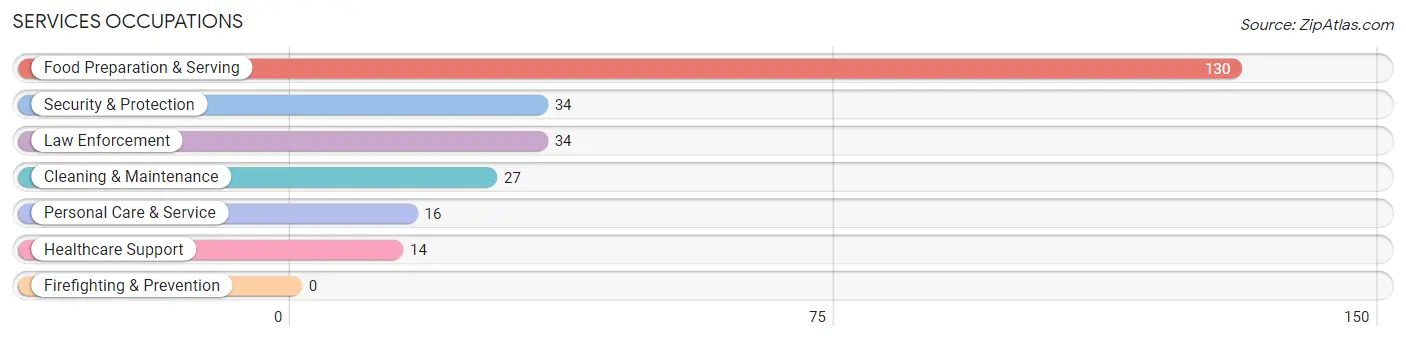
Services Occupations
The most common Services occupations in Abernathy are Food Preparation & Serving (130 | 8.8%), Security & Protection (34 | 2.3%), Law Enforcement (34 | 2.3%), Cleaning & Maintenance (27 | 1.8%), and Personal Care & Service (16 | 1.1%).
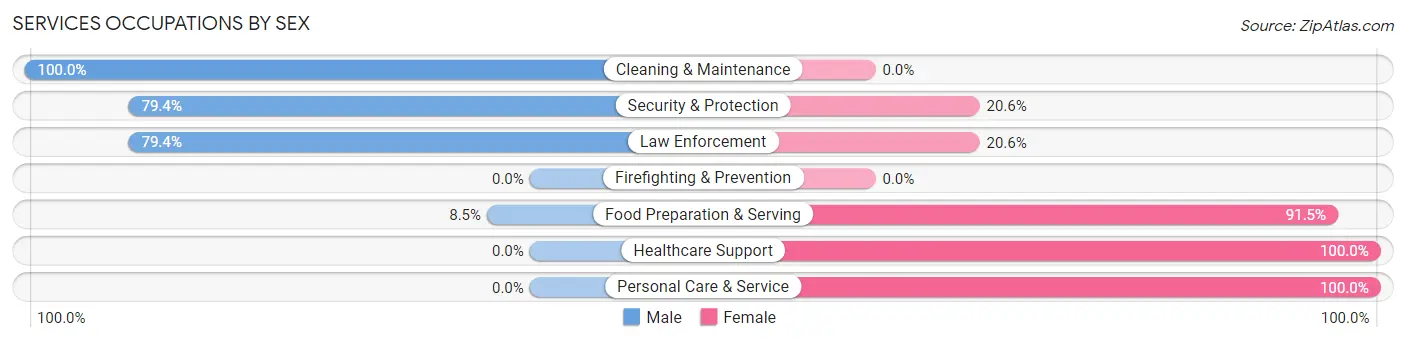
Services Occupations by Sex
Within the Services occupations in Abernathy, the most male-oriented occupations are Cleaning & Maintenance (100.0%), Security & Protection (79.4%), and Law Enforcement (79.4%), while the most female-oriented occupations are Healthcare Support (100.0%), Personal Care & Service (100.0%), and Food Preparation & Serving (91.5%).
| Occupation | Male | Female |
| Healthcare Support | 0 (0.0%) | 14 (100.0%) |
| Security & Protection | 27 (79.4%) | 7 (20.6%) |
| Firefighting & Prevention | 0 (0.0%) | 0 (0.0%) |
| Law Enforcement | 27 (79.4%) | 7 (20.6%) |
| Food Preparation & Serving | 11 (8.5%) | 119 (91.5%) |
| Cleaning & Maintenance | 27 (100.0%) | 0 (0.0%) |
| Personal Care & Service | 0 (0.0%) | 16 (100.0%) |
| Total (Category) | 65 (29.4%) | 156 (70.6%) |
| Total (Overall) | 743 (50.2%) | 738 (49.8%) |
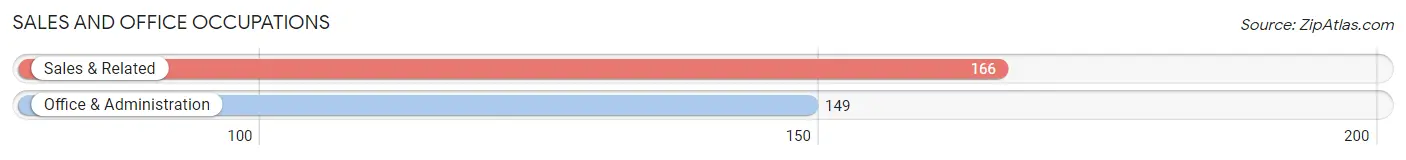
Sales and Office Occupations
The most common Sales and Office occupations in Abernathy are Sales & Related (166 | 11.2%), and Office & Administration (149 | 10.1%).
Sales and Office Occupations by Sex
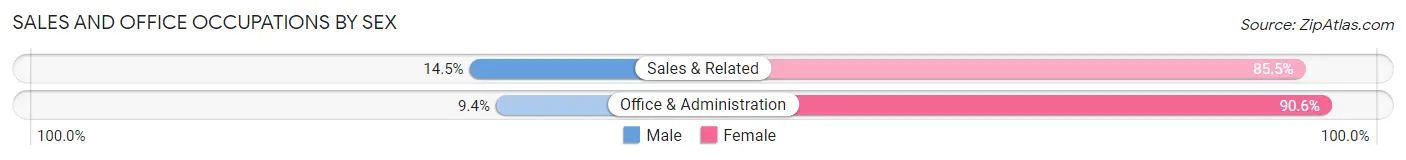
| Occupation | Male | Female |
| Sales & Related | 24 (14.5%) | 142 (85.5%) |
| Office & Administration | 14 (9.4%) | 135 (90.6%) |
| Total (Category) | 38 (12.1%) | 277 (87.9%) |
| Total (Overall) | 743 (50.2%) | 738 (49.8%) |
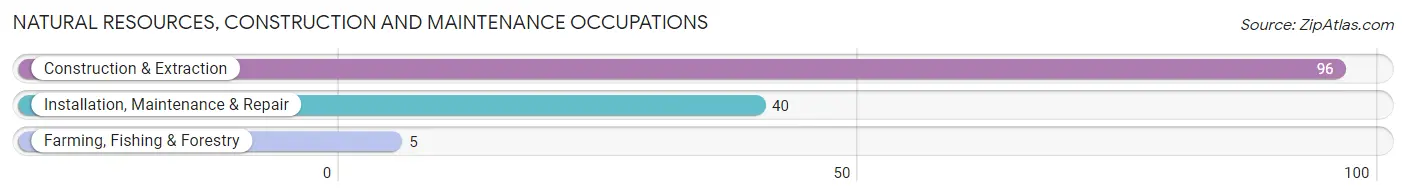
Natural Resources, Construction and Maintenance Occupations
The most common Natural Resources, Construction and Maintenance occupations in Abernathy are Construction & Extraction (96 | 6.5%), Installation, Maintenance & Repair (40 | 2.7%), and Farming, Fishing & Forestry (5 | 0.3%).
Natural Resources, Construction and Maintenance Occupations by Sex
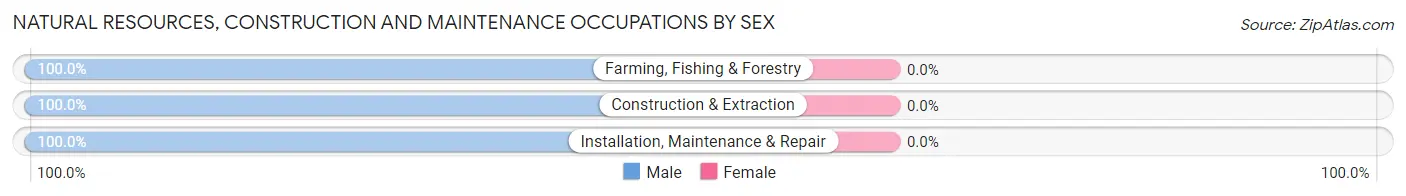
| Occupation | Male | Female |
| Farming, Fishing & Forestry | 5 (100.0%) | 0 (0.0%) |
| Construction & Extraction | 96 (100.0%) | 0 (0.0%) |
| Installation, Maintenance & Repair | 40 (100.0%) | 0 (0.0%) |
| Total (Category) | 141 (100.0%) | 0 (0.0%) |
| Total (Overall) | 743 (50.2%) | 738 (49.8%) |
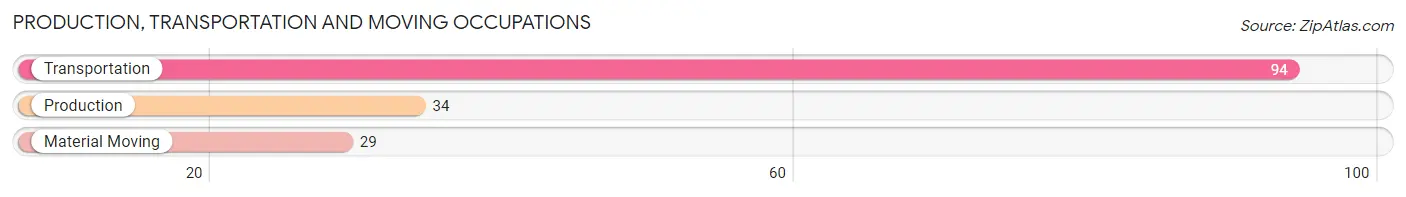
Production, Transportation and Moving Occupations
The most common Production, Transportation and Moving occupations in Abernathy are Transportation (94 | 6.4%), Production (34 | 2.3%), and Material Moving (29 | 2.0%).
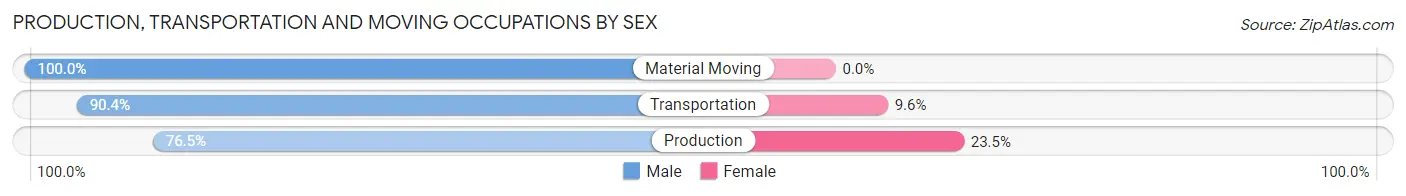
Production, Transportation and Moving Occupations by Sex
| Occupation | Male | Female |
| Production | 26 (76.5%) | 8 (23.5%) |
| Transportation | 85 (90.4%) | 9 (9.6%) |
| Material Moving | 29 (100.0%) | 0 (0.0%) |
| Total (Category) | 140 (89.2%) | 17 (10.8%) |
| Total (Overall) | 743 (50.2%) | 738 (49.8%) |
Employment Industries by Sex in Abernathy
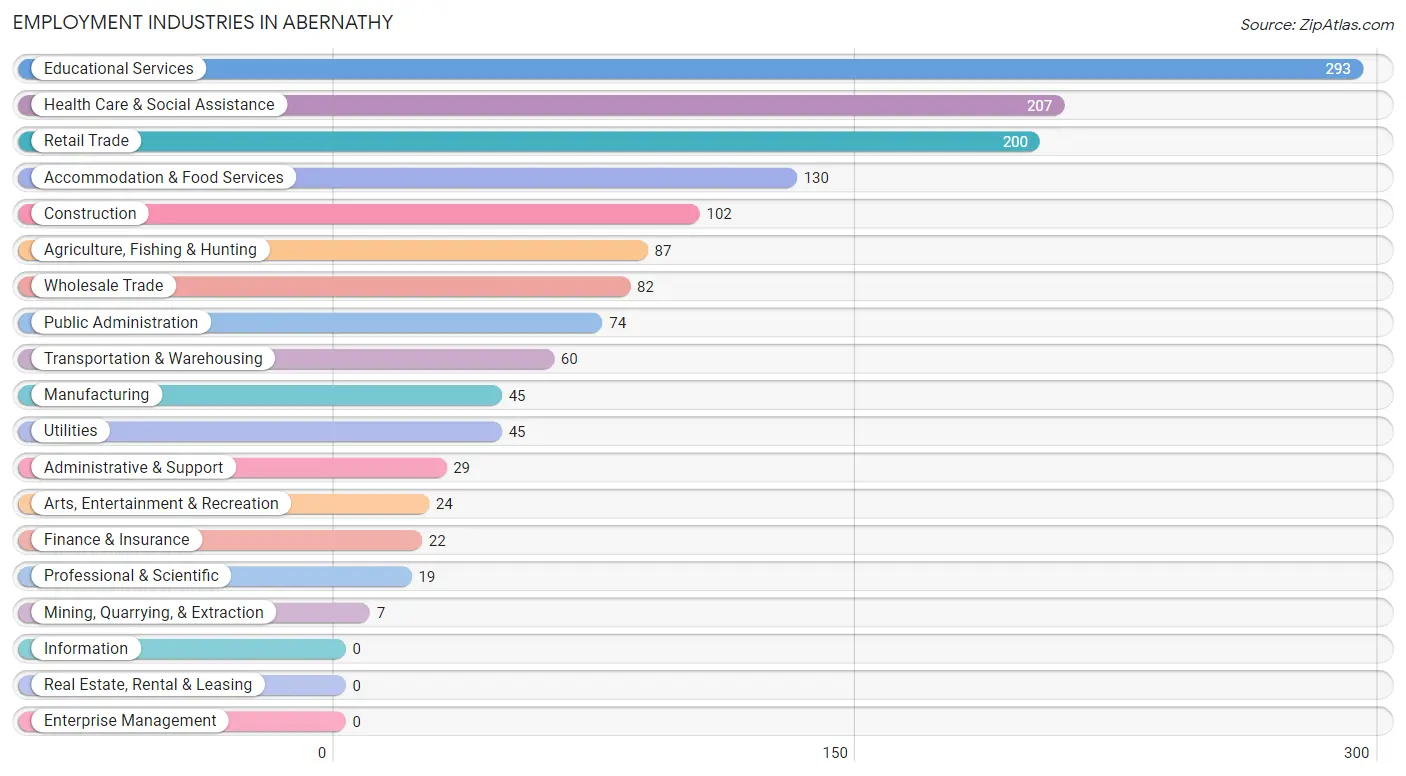
Employment Industries in Abernathy
The major employment industries in Abernathy include Educational Services (293 | 19.8%), Health Care & Social Assistance (207 | 14.0%), Retail Trade (200 | 13.5%), Accommodation & Food Services (130 | 8.8%), and Construction (102 | 6.9%).
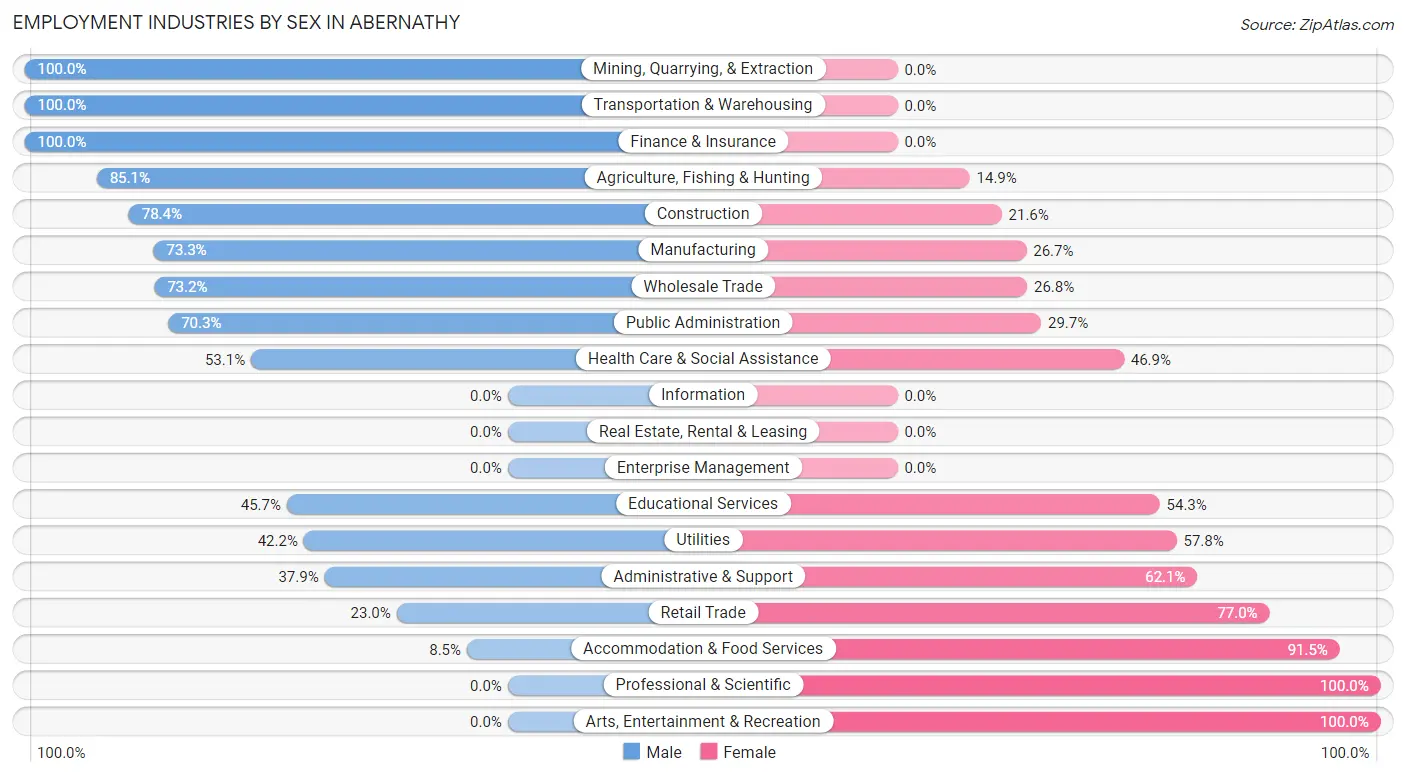
Employment Industries by Sex in Abernathy
The Abernathy industries that see more men than women are Mining, Quarrying, & Extraction (100.0%), Transportation & Warehousing (100.0%), and Finance & Insurance (100.0%), whereas the industries that tend to have a higher number of women are Professional & Scientific (100.0%), Arts, Entertainment & Recreation (100.0%), and Accommodation & Food Services (91.5%).
| Industry | Male | Female |
| Agriculture, Fishing & Hunting | 74 (85.1%) | 13 (14.9%) |
| Mining, Quarrying, & Extraction | 7 (100.0%) | 0 (0.0%) |
| Construction | 80 (78.4%) | 22 (21.6%) |
| Manufacturing | 33 (73.3%) | 12 (26.7%) |
| Wholesale Trade | 60 (73.2%) | 22 (26.8%) |
| Retail Trade | 46 (23.0%) | 154 (77.0%) |
| Transportation & Warehousing | 60 (100.0%) | 0 (0.0%) |
| Utilities | 19 (42.2%) | 26 (57.8%) |
| Information | 0 (0.0%) | 0 (0.0%) |
| Finance & Insurance | 22 (100.0%) | 0 (0.0%) |
| Real Estate, Rental & Leasing | 0 (0.0%) | 0 (0.0%) |
| Professional & Scientific | 0 (0.0%) | 19 (100.0%) |
| Enterprise Management | 0 (0.0%) | 0 (0.0%) |
| Administrative & Support | 11 (37.9%) | 18 (62.1%) |
| Educational Services | 134 (45.7%) | 159 (54.3%) |
| Health Care & Social Assistance | 110 (53.1%) | 97 (46.9%) |
| Arts, Entertainment & Recreation | 0 (0.0%) | 24 (100.0%) |
| Accommodation & Food Services | 11 (8.5%) | 119 (91.5%) |
| Public Administration | 52 (70.3%) | 22 (29.7%) |
| Total | 743 (50.2%) | 738 (49.8%) |
Education in Abernathy
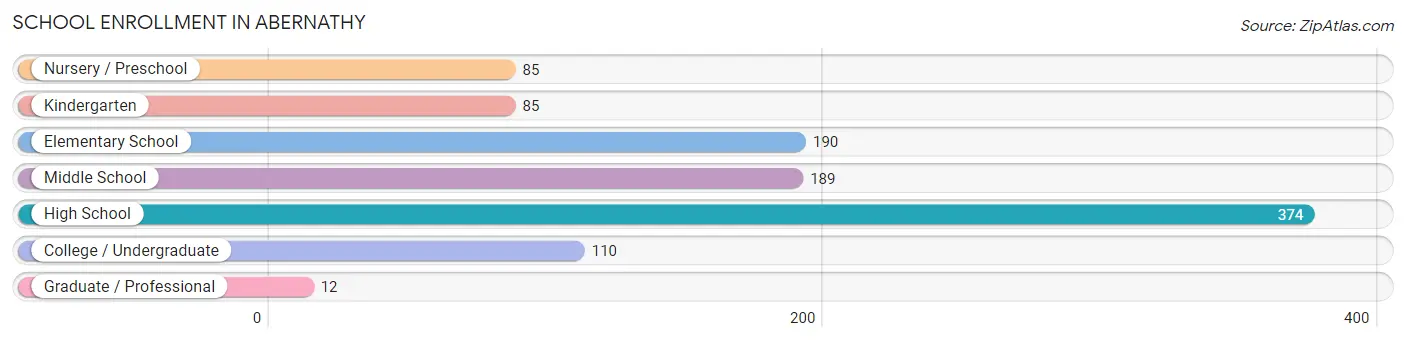
School Enrollment in Abernathy
The most common levels of schooling among the 1,045 students in Abernathy are high school (374 | 35.8%), elementary school (190 | 18.2%), and middle school (189 | 18.1%).
| School Level | # Students | % Students |
| Nursery / Preschool | 85 | 8.1% |
| Kindergarten | 85 | 8.1% |
| Elementary School | 190 | 18.2% |
| Middle School | 189 | 18.1% |
| High School | 374 | 35.8% |
| College / Undergraduate | 110 | 10.5% |
| Graduate / Professional | 12 | 1.1% |
| Total | 1,045 | 100.0% |
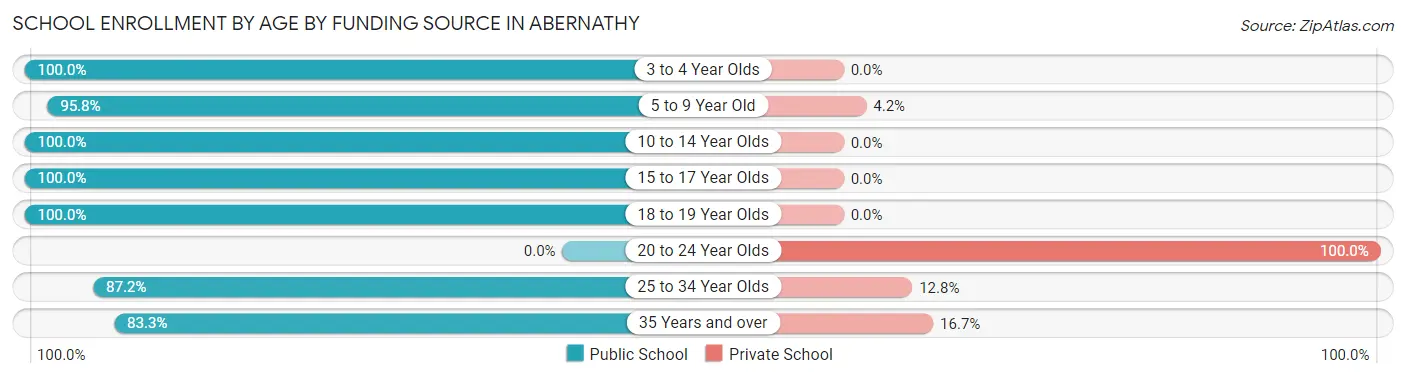
School Enrollment by Age by Funding Source in Abernathy
Out of a total of 1,045 students who are enrolled in schools in Abernathy, 45 (4.3%) attend a private institution, while the remaining 1,000 (95.7%) are enrolled in public schools. The age group of 20 to 24 year olds has the highest likelihood of being enrolled in private schools, with 18 (100.0% in the age bracket) enrolled. Conversely, the age group of 3 to 4 year olds has the lowest likelihood of being enrolled in a private school, with 71 (100.0% in the age bracket) attending a public institution.
| Age Bracket | Public School | Private School |
| 3 to 4 Year Olds | 71 (100.0%) | 0 (0.0%) |
| 5 to 9 Year Old | 272 (95.8%) | 12 (4.2%) |
| 10 to 14 Year Olds | 215 (100.0%) | 0 (0.0%) |
| 15 to 17 Year Olds | 326 (100.0%) | 0 (0.0%) |
| 18 to 19 Year Olds | 30 (100.0%) | 0 (0.0%) |
| 20 to 24 Year Olds | 0 (0.0%) | 18 (100.0%) |
| 25 to 34 Year Olds | 41 (87.2%) | 6 (12.8%) |
| 35 Years and over | 45 (83.3%) | 9 (16.7%) |
| Total | 1,000 (95.7%) | 45 (4.3%) |
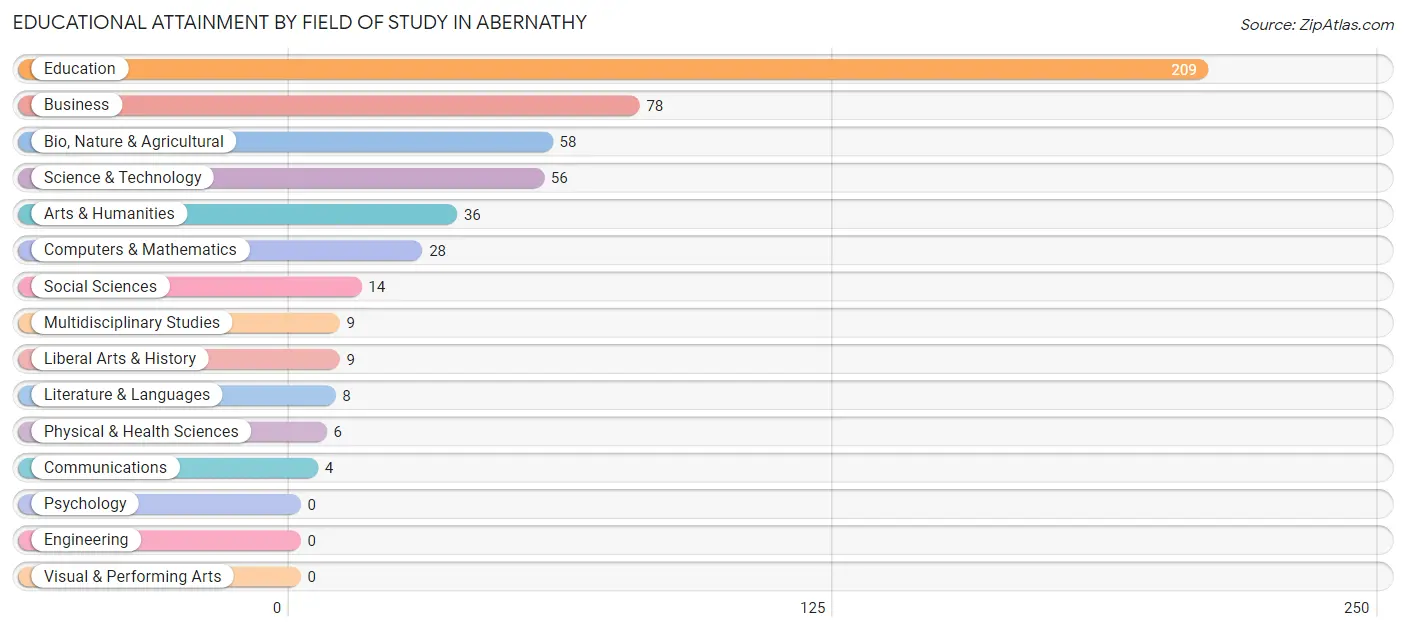
Educational Attainment by Field of Study in Abernathy
Education (209 | 40.6%), business (78 | 15.1%), bio, nature & agricultural (58 | 11.3%), science & technology (56 | 10.9%), and arts & humanities (36 | 7.0%) are the most common fields of study among 515 individuals in Abernathy who have obtained a bachelor's degree or higher.
| Field of Study | # Graduates | % Graduates |
| Computers & Mathematics | 28 | 5.4% |
| Bio, Nature & Agricultural | 58 | 11.3% |
| Physical & Health Sciences | 6 | 1.2% |
| Psychology | 0 | 0.0% |
| Social Sciences | 14 | 2.7% |
| Engineering | 0 | 0.0% |
| Multidisciplinary Studies | 9 | 1.8% |
| Science & Technology | 56 | 10.9% |
| Business | 78 | 15.1% |
| Education | 209 | 40.6% |
| Literature & Languages | 8 | 1.5% |
| Liberal Arts & History | 9 | 1.8% |
| Visual & Performing Arts | 0 | 0.0% |
| Communications | 4 | 0.8% |
| Arts & Humanities | 36 | 7.0% |
| Total | 515 | 100.0% |
Transportation & Commute in Abernathy
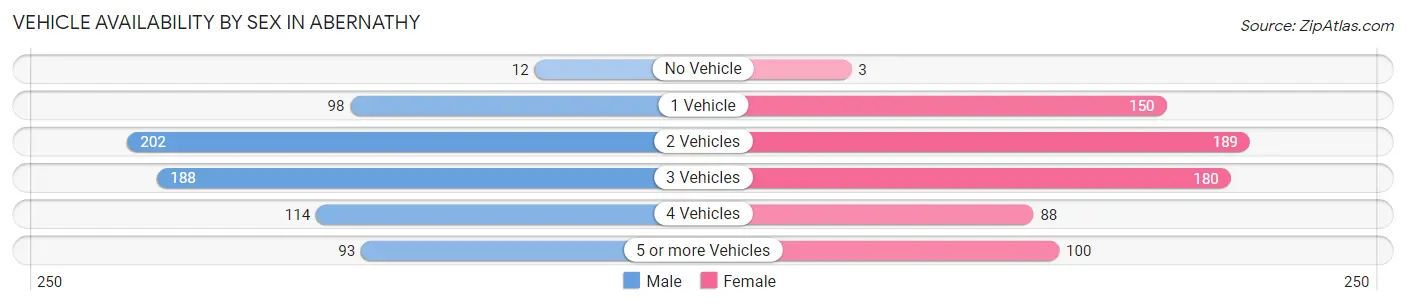
Vehicle Availability by Sex in Abernathy
The most prevalent vehicle ownership categories in Abernathy are males with 2 vehicles (202, accounting for 28.6%) and females with 2 vehicles (189, making up 28.4%).
| Vehicles Available | Male | Female |
| No Vehicle | 12 (1.7%) | 3 (0.4%) |
| 1 Vehicle | 98 (13.9%) | 150 (21.1%) |
| 2 Vehicles | 202 (28.6%) | 189 (26.6%) |
| 3 Vehicles | 188 (26.6%) | 180 (25.4%) |
| 4 Vehicles | 114 (16.1%) | 88 (12.4%) |
| 5 or more Vehicles | 93 (13.2%) | 100 (14.1%) |
| Total | 707 (100.0%) | 710 (100.0%) |
Commute Time in Abernathy
The most frequently occuring commute durations in Abernathy are 5 to 9 minutes (312 commuters, 23.1%), 25 to 29 minutes (218 commuters, 16.1%), and less than 5 minutes (155 commuters, 11.5%).
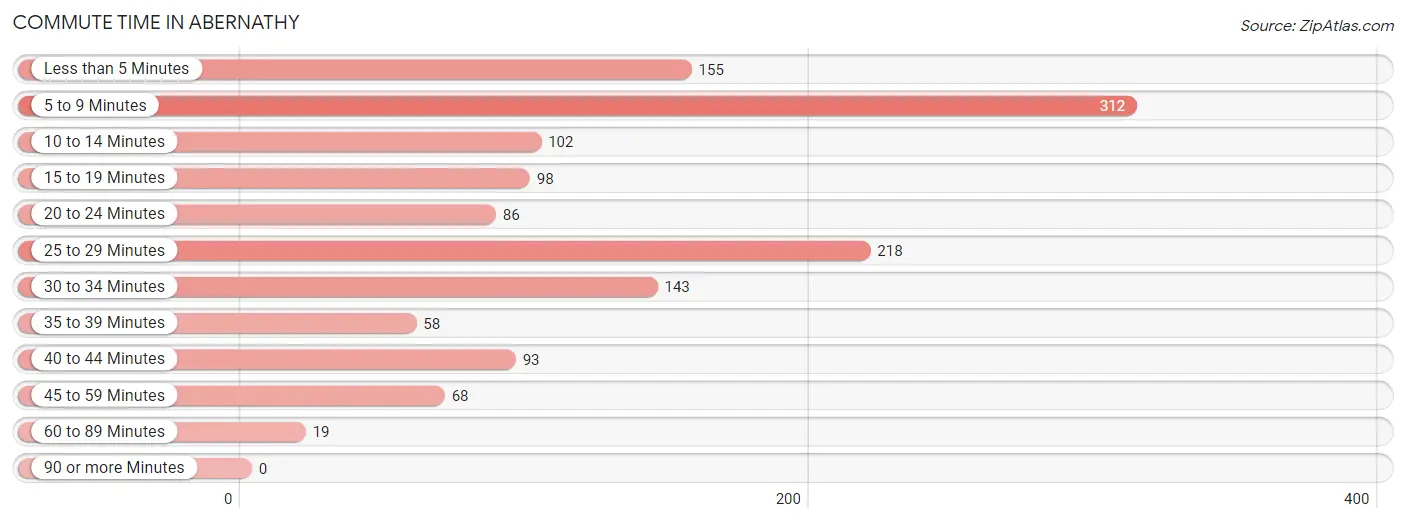
| Commute Time | # Commuters | % Commuters |
| Less than 5 Minutes | 155 | 11.5% |
| 5 to 9 Minutes | 312 | 23.1% |
| 10 to 14 Minutes | 102 | 7.5% |
| 15 to 19 Minutes | 98 | 7.2% |
| 20 to 24 Minutes | 86 | 6.4% |
| 25 to 29 Minutes | 218 | 16.1% |
| 30 to 34 Minutes | 143 | 10.6% |
| 35 to 39 Minutes | 58 | 4.3% |
| 40 to 44 Minutes | 93 | 6.9% |
| 45 to 59 Minutes | 68 | 5.0% |
| 60 to 89 Minutes | 19 | 1.4% |
| 90 or more Minutes | 0 | 0.0% |
Commute Time by Sex in Abernathy
The most common commute times in Abernathy are 5 to 9 minutes (127 commuters, 18.5%) for males and 5 to 9 minutes (185 commuters, 27.7%) for females.
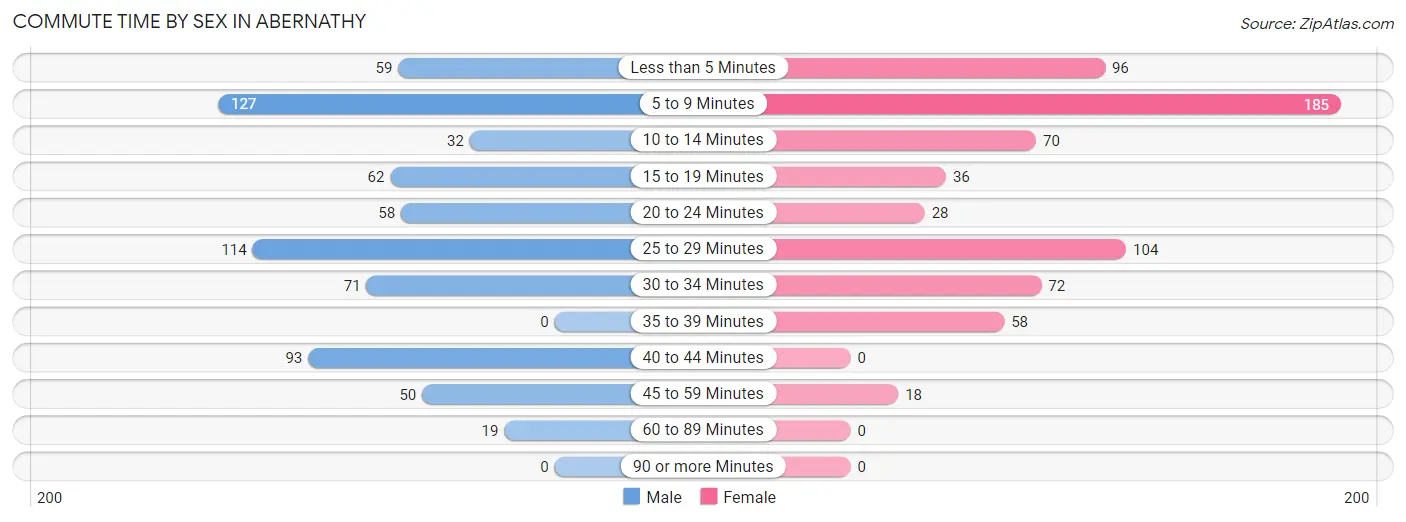
| Commute Time | Male | Female |
| Less than 5 Minutes | 59 (8.6%) | 96 (14.4%) |
| 5 to 9 Minutes | 127 (18.5%) | 185 (27.7%) |
| 10 to 14 Minutes | 32 (4.7%) | 70 (10.5%) |
| 15 to 19 Minutes | 62 (9.0%) | 36 (5.4%) |
| 20 to 24 Minutes | 58 (8.5%) | 28 (4.2%) |
| 25 to 29 Minutes | 114 (16.6%) | 104 (15.6%) |
| 30 to 34 Minutes | 71 (10.4%) | 72 (10.8%) |
| 35 to 39 Minutes | 0 (0.0%) | 58 (8.7%) |
| 40 to 44 Minutes | 93 (13.6%) | 0 (0.0%) |
| 45 to 59 Minutes | 50 (7.3%) | 18 (2.7%) |
| 60 to 89 Minutes | 19 (2.8%) | 0 (0.0%) |
| 90 or more Minutes | 0 (0.0%) | 0 (0.0%) |
Time of Departure to Work by Sex in Abernathy
The most frequent times of departure to work in Abernathy are 7:00 AM to 7:29 AM (190, 27.7%) for males and 7:30 AM to 7:59 AM (245, 36.7%) for females.
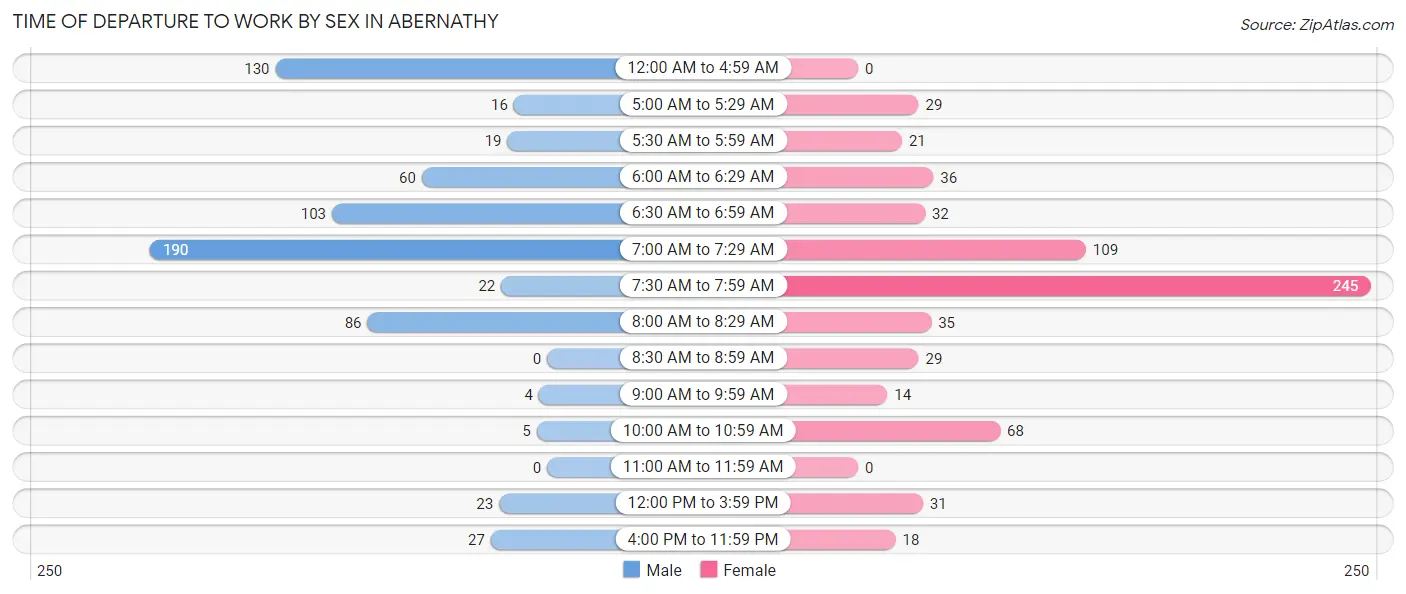
| Time of Departure | Male | Female |
| 12:00 AM to 4:59 AM | 130 (19.0%) | 0 (0.0%) |
| 5:00 AM to 5:29 AM | 16 (2.3%) | 29 (4.3%) |
| 5:30 AM to 5:59 AM | 19 (2.8%) | 21 (3.2%) |
| 6:00 AM to 6:29 AM | 60 (8.8%) | 36 (5.4%) |
| 6:30 AM to 6:59 AM | 103 (15.0%) | 32 (4.8%) |
| 7:00 AM to 7:29 AM | 190 (27.7%) | 109 (16.3%) |
| 7:30 AM to 7:59 AM | 22 (3.2%) | 245 (36.7%) |
| 8:00 AM to 8:29 AM | 86 (12.6%) | 35 (5.2%) |
| 8:30 AM to 8:59 AM | 0 (0.0%) | 29 (4.3%) |
| 9:00 AM to 9:59 AM | 4 (0.6%) | 14 (2.1%) |
| 10:00 AM to 10:59 AM | 5 (0.7%) | 68 (10.2%) |
| 11:00 AM to 11:59 AM | 0 (0.0%) | 0 (0.0%) |
| 12:00 PM to 3:59 PM | 23 (3.4%) | 31 (4.6%) |
| 4:00 PM to 11:59 PM | 27 (3.9%) | 18 (2.7%) |
| Total | 685 (100.0%) | 667 (100.0%) |
Housing Occupancy in Abernathy
Occupancy by Ownership in Abernathy
Of the total 1,164 dwellings in Abernathy, owner-occupied units account for 896 (77.0%), while renter-occupied units make up 268 (23.0%).
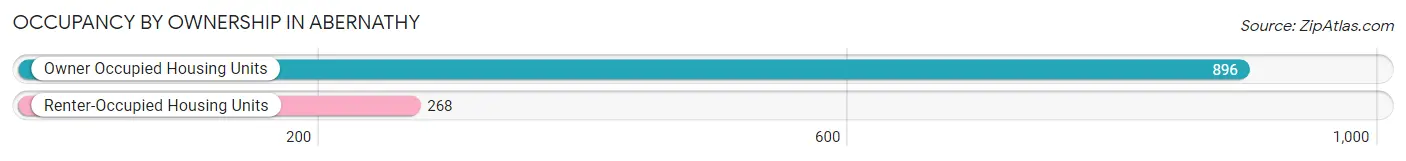
| Occupancy | # Housing Units | % Housing Units |
| Owner Occupied Housing Units | 896 | 77.0% |
| Renter-Occupied Housing Units | 268 | 23.0% |
| Total Occupied Housing Units | 1,164 | 100.0% |
Occupancy by Household Size in Abernathy
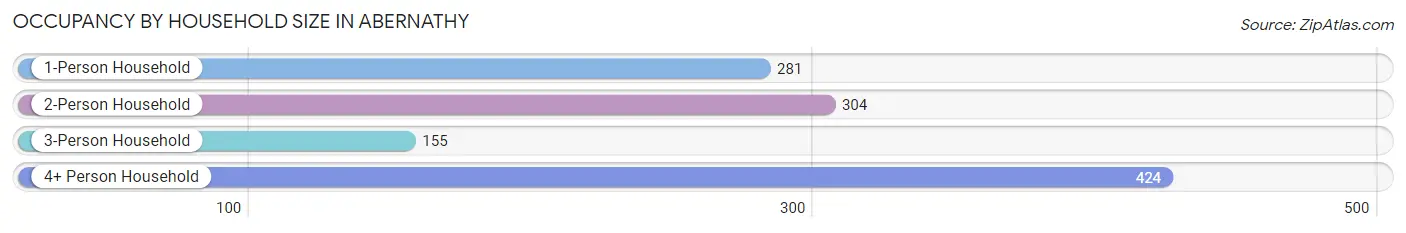
| Household Size | # Housing Units | % Housing Units |
| 1-Person Household | 281 | 24.1% |
| 2-Person Household | 304 | 26.1% |
| 3-Person Household | 155 | 13.3% |
| 4+ Person Household | 424 | 36.4% |
| Total Housing Units | 1,164 | 100.0% |
Occupancy by Ownership by Household Size in Abernathy
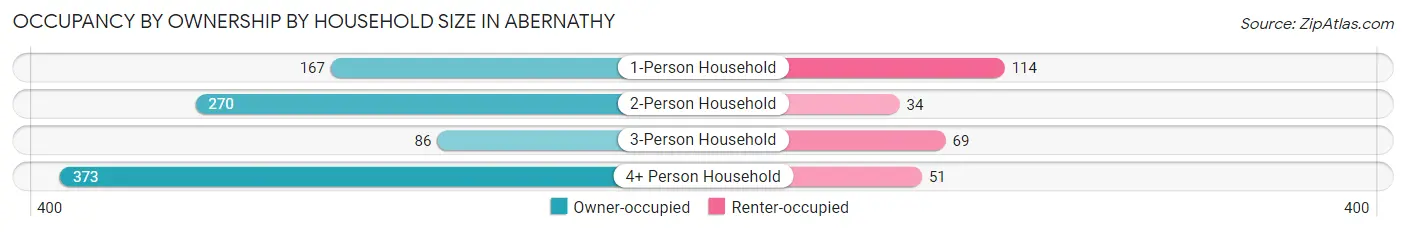
| Household Size | Owner-occupied | Renter-occupied |
| 1-Person Household | 167 (59.4%) | 114 (40.6%) |
| 2-Person Household | 270 (88.8%) | 34 (11.2%) |
| 3-Person Household | 86 (55.5%) | 69 (44.5%) |
| 4+ Person Household | 373 (88.0%) | 51 (12.0%) |
| Total Housing Units | 896 (77.0%) | 268 (23.0%) |
Occupancy by Educational Attainment in Abernathy
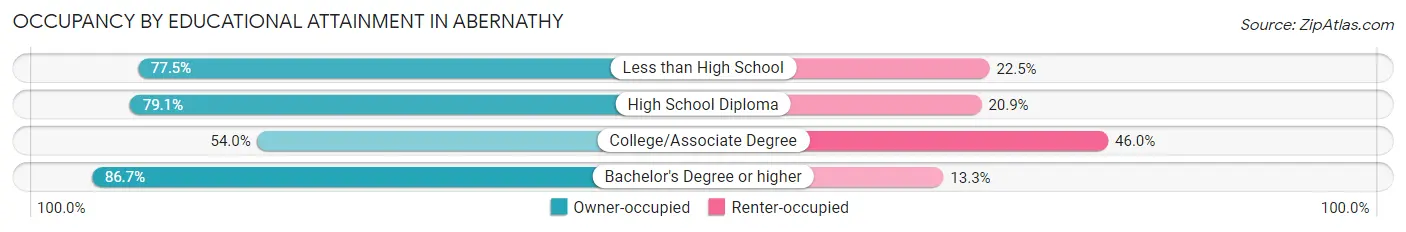
| Household Size | Owner-occupied | Renter-occupied |
| Less than High School | 145 (77.5%) | 42 (22.5%) |
| High School Diploma | 364 (79.1%) | 96 (20.9%) |
| College/Associate Degree | 101 (54.0%) | 86 (46.0%) |
| Bachelor's Degree or higher | 286 (86.7%) | 44 (13.3%) |
Occupancy by Age of Householder in Abernathy
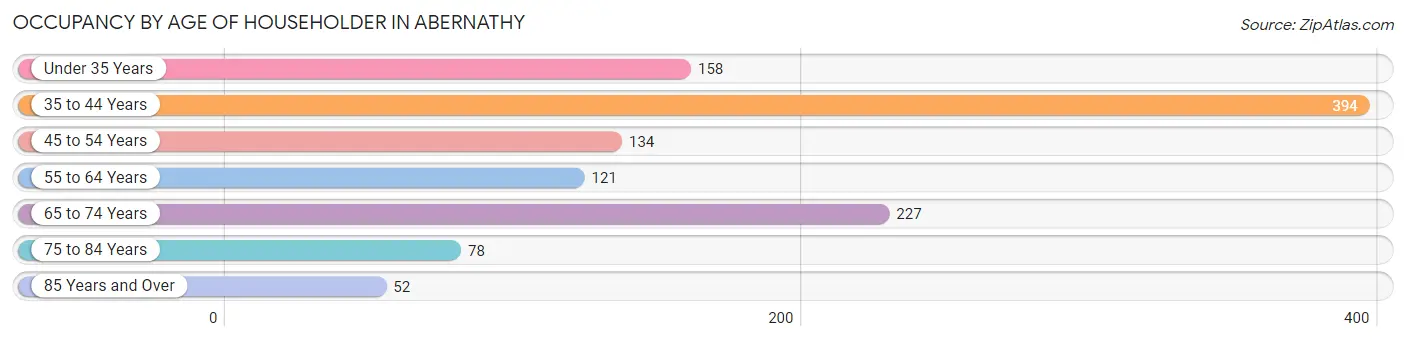
| Age Bracket | # Households | % Households |
| Under 35 Years | 158 | 13.6% |
| 35 to 44 Years | 394 | 33.9% |
| 45 to 54 Years | 134 | 11.5% |
| 55 to 64 Years | 121 | 10.4% |
| 65 to 74 Years | 227 | 19.5% |
| 75 to 84 Years | 78 | 6.7% |
| 85 Years and Over | 52 | 4.5% |
| Total | 1,164 | 100.0% |
Housing Finances in Abernathy
Median Income by Occupancy in Abernathy
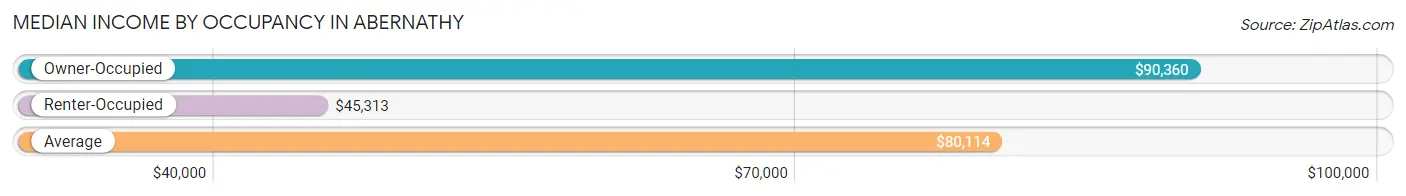
| Occupancy Type | # Households | Median Income |
| Owner-Occupied | 896 (77.0%) | $90,360 |
| Renter-Occupied | 268 (23.0%) | $45,313 |
| Average | 1,164 (100.0%) | $80,114 |
Occupancy by Householder Income Bracket in Abernathy
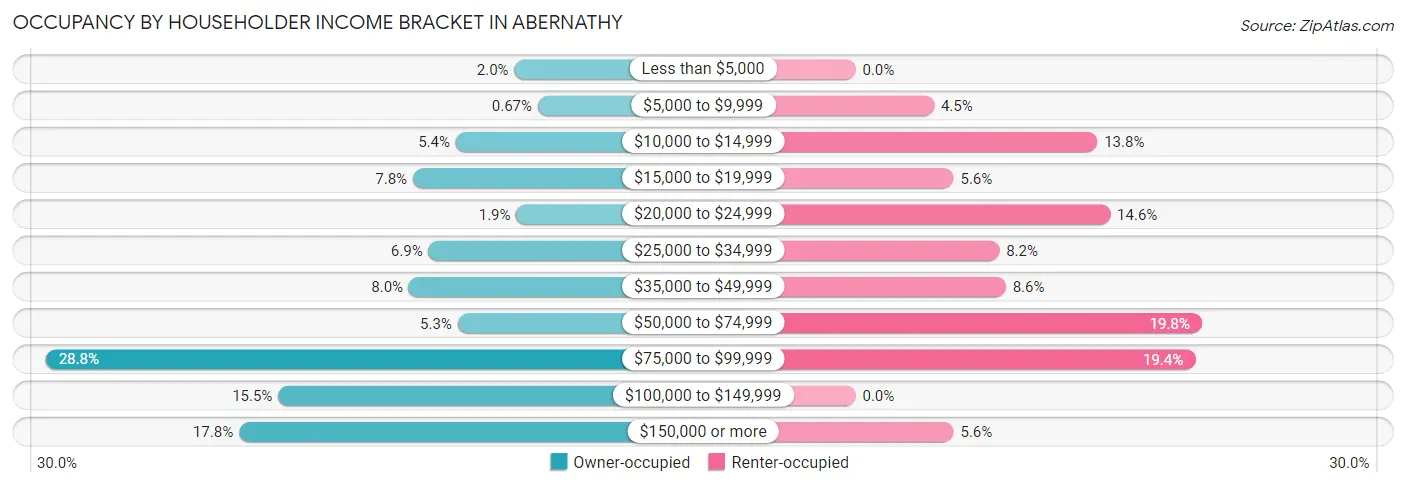
| Income Bracket | Owner-occupied | Renter-occupied |
| Less than $5,000 | 18 (2.0%) | 0 (0.0%) |
| $5,000 to $9,999 | 6 (0.7%) | 12 (4.5%) |
| $10,000 to $14,999 | 48 (5.4%) | 37 (13.8%) |
| $15,000 to $19,999 | 70 (7.8%) | 15 (5.6%) |
| $20,000 to $24,999 | 17 (1.9%) | 39 (14.5%) |
| $25,000 to $34,999 | 62 (6.9%) | 22 (8.2%) |
| $35,000 to $49,999 | 72 (8.0%) | 23 (8.6%) |
| $50,000 to $74,999 | 47 (5.2%) | 53 (19.8%) |
| $75,000 to $99,999 | 258 (28.8%) | 52 (19.4%) |
| $100,000 to $149,999 | 139 (15.5%) | 0 (0.0%) |
| $150,000 or more | 159 (17.7%) | 15 (5.6%) |
| Total | 896 (100.0%) | 268 (100.0%) |
Monthly Housing Cost Tiers in Abernathy
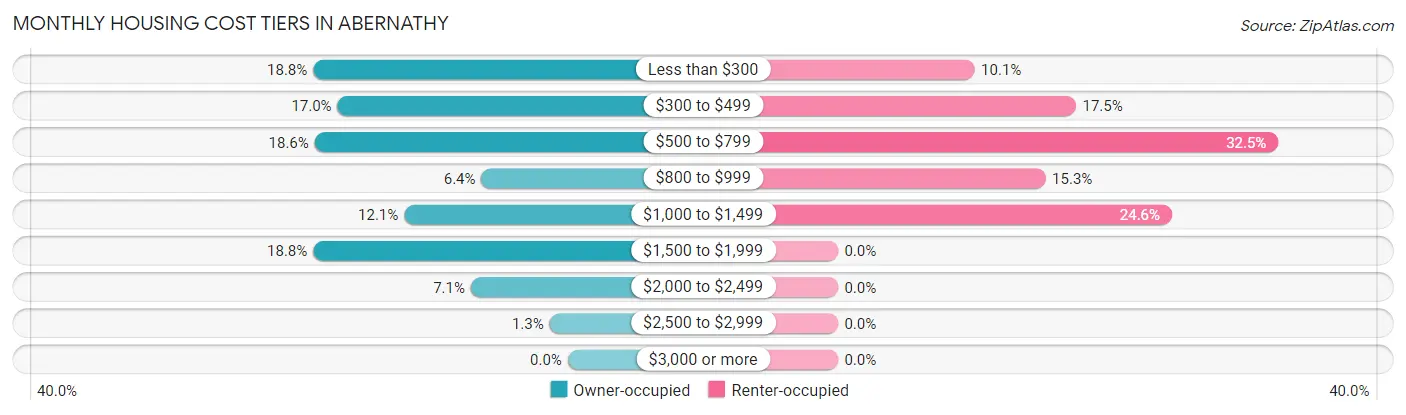
| Monthly Cost | Owner-occupied | Renter-occupied |
| Less than $300 | 168 (18.8%) | 27 (10.1%) |
| $300 to $499 | 152 (17.0%) | 47 (17.5%) |
| $500 to $799 | 167 (18.6%) | 87 (32.5%) |
| $800 to $999 | 57 (6.4%) | 41 (15.3%) |
| $1,000 to $1,499 | 108 (12.0%) | 66 (24.6%) |
| $1,500 to $1,999 | 168 (18.8%) | 0 (0.0%) |
| $2,000 to $2,499 | 64 (7.1%) | 0 (0.0%) |
| $2,500 to $2,999 | 12 (1.3%) | 0 (0.0%) |
| $3,000 or more | 0 (0.0%) | 0 (0.0%) |
| Total | 896 (100.0%) | 268 (100.0%) |
Physical Housing Characteristics in Abernathy
Housing Structures in Abernathy
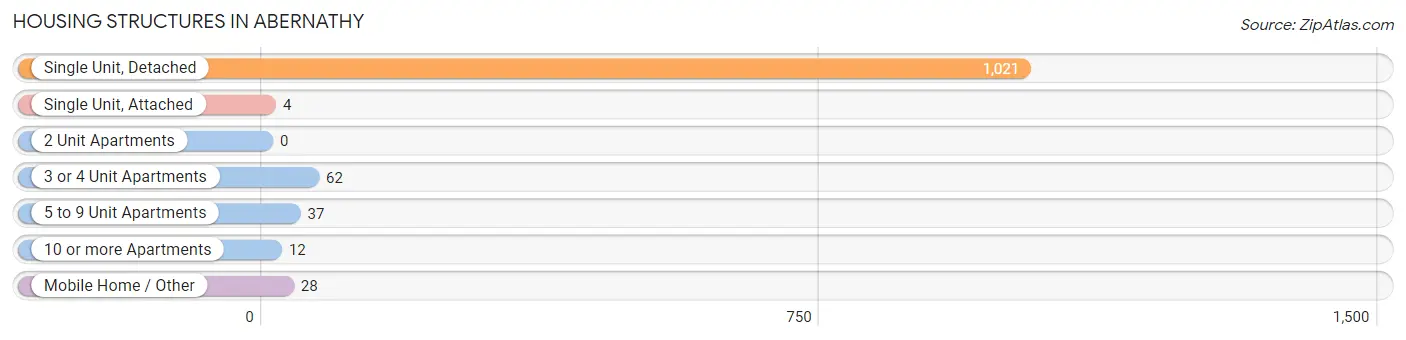
| Structure Type | # Housing Units | % Housing Units |
| Single Unit, Detached | 1,021 | 87.7% |
| Single Unit, Attached | 4 | 0.3% |
| 2 Unit Apartments | 0 | 0.0% |
| 3 or 4 Unit Apartments | 62 | 5.3% |
| 5 to 9 Unit Apartments | 37 | 3.2% |
| 10 or more Apartments | 12 | 1.0% |
| Mobile Home / Other | 28 | 2.4% |
| Total | 1,164 | 100.0% |
Housing Structures by Occupancy in Abernathy
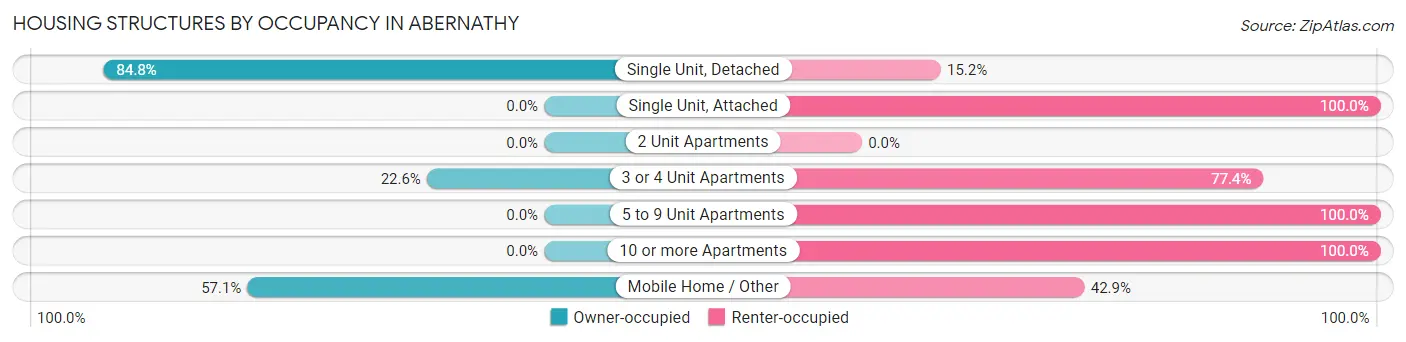
| Structure Type | Owner-occupied | Renter-occupied |
| Single Unit, Detached | 866 (84.8%) | 155 (15.2%) |
| Single Unit, Attached | 0 (0.0%) | 4 (100.0%) |
| 2 Unit Apartments | 0 (0.0%) | 0 (0.0%) |
| 3 or 4 Unit Apartments | 14 (22.6%) | 48 (77.4%) |
| 5 to 9 Unit Apartments | 0 (0.0%) | 37 (100.0%) |
| 10 or more Apartments | 0 (0.0%) | 12 (100.0%) |
| Mobile Home / Other | 16 (57.1%) | 12 (42.9%) |
| Total | 896 (77.0%) | 268 (23.0%) |
Housing Structures by Number of Rooms in Abernathy
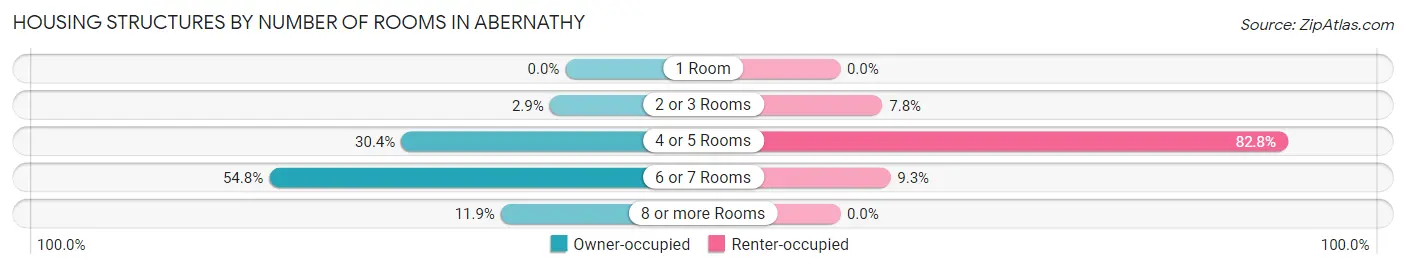
| Number of Rooms | Owner-occupied | Renter-occupied |
| 1 Room | 0 (0.0%) | 0 (0.0%) |
| 2 or 3 Rooms | 26 (2.9%) | 21 (7.8%) |
| 4 or 5 Rooms | 272 (30.4%) | 222 (82.8%) |
| 6 or 7 Rooms | 491 (54.8%) | 25 (9.3%) |
| 8 or more Rooms | 107 (11.9%) | 0 (0.0%) |
| Total | 896 (100.0%) | 268 (100.0%) |
Housing Structure by Heating Type in Abernathy
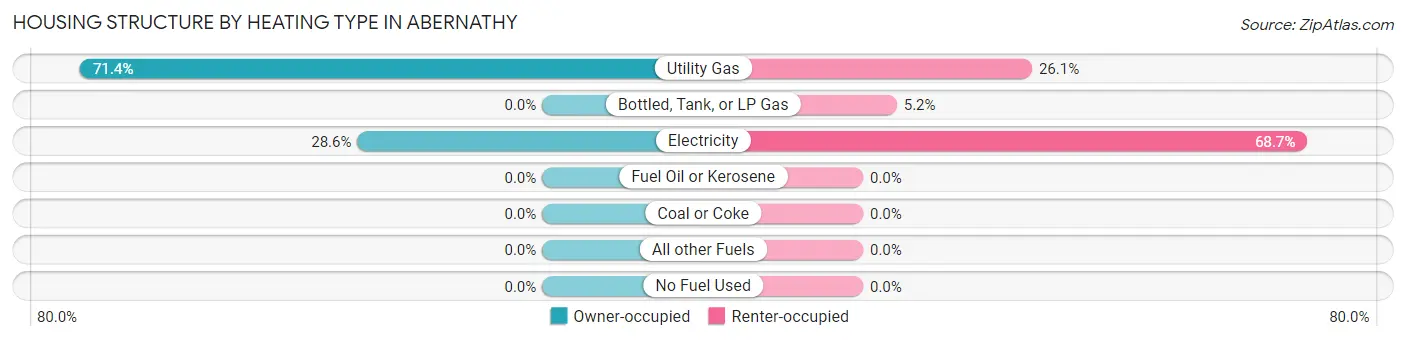
| Heating Type | Owner-occupied | Renter-occupied |
| Utility Gas | 640 (71.4%) | 70 (26.1%) |
| Bottled, Tank, or LP Gas | 0 (0.0%) | 14 (5.2%) |
| Electricity | 256 (28.6%) | 184 (68.7%) |
| Fuel Oil or Kerosene | 0 (0.0%) | 0 (0.0%) |
| Coal or Coke | 0 (0.0%) | 0 (0.0%) |
| All other Fuels | 0 (0.0%) | 0 (0.0%) |
| No Fuel Used | 0 (0.0%) | 0 (0.0%) |
| Total | 896 (100.0%) | 268 (100.0%) |
Household Vehicle Usage in Abernathy
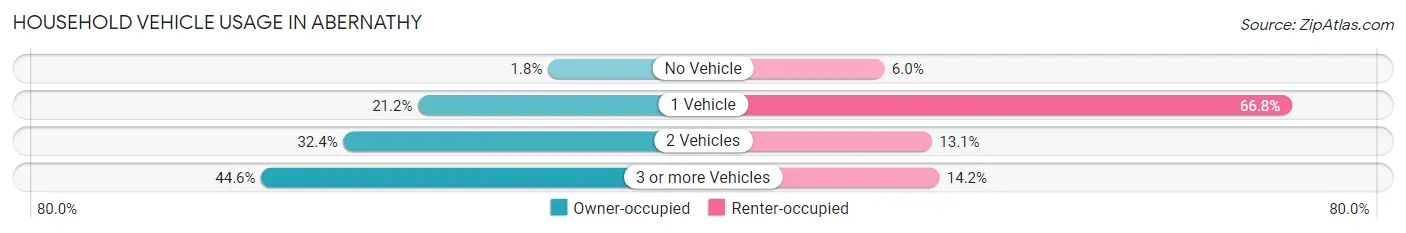
| Vehicles per Household | Owner-occupied | Renter-occupied |
| No Vehicle | 16 (1.8%) | 16 (6.0%) |
| 1 Vehicle | 190 (21.2%) | 179 (66.8%) |
| 2 Vehicles | 290 (32.4%) | 35 (13.1%) |
| 3 or more Vehicles | 400 (44.6%) | 38 (14.2%) |
| Total | 896 (100.0%) | 268 (100.0%) |
Real Estate & Mortgages in Abernathy
Real Estate and Mortgage Overview in Abernathy
| Characteristic | Without Mortgage | With Mortgage |
| Housing Units | 422 | 474 |
| Median Property Value | $58,300 | $156,900 |
| Median Household Income | $46,154 | $102 |
| Monthly Housing Costs | $335 | $0 |
| Real Estate Taxes | $743 | $0 |
Property Value by Mortgage Status in Abernathy
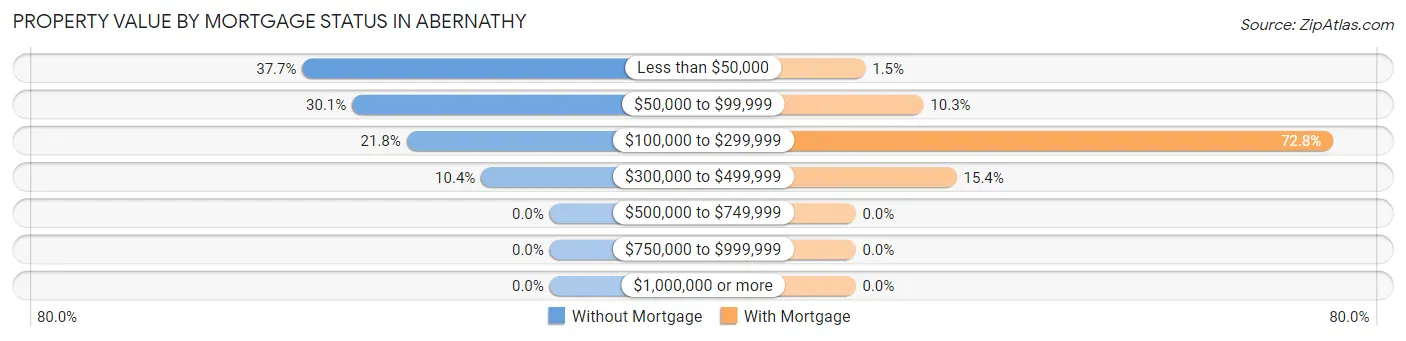
| Property Value | Without Mortgage | With Mortgage |
| Less than $50,000 | 159 (37.7%) | 7 (1.5%) |
| $50,000 to $99,999 | 127 (30.1%) | 49 (10.3%) |
| $100,000 to $299,999 | 92 (21.8%) | 345 (72.8%) |
| $300,000 to $499,999 | 44 (10.4%) | 73 (15.4%) |
| $500,000 to $749,999 | 0 (0.0%) | 0 (0.0%) |
| $750,000 to $999,999 | 0 (0.0%) | 0 (0.0%) |
| $1,000,000 or more | 0 (0.0%) | 0 (0.0%) |
| Total | 422 (100.0%) | 474 (100.0%) |
Household Income by Mortgage Status in Abernathy
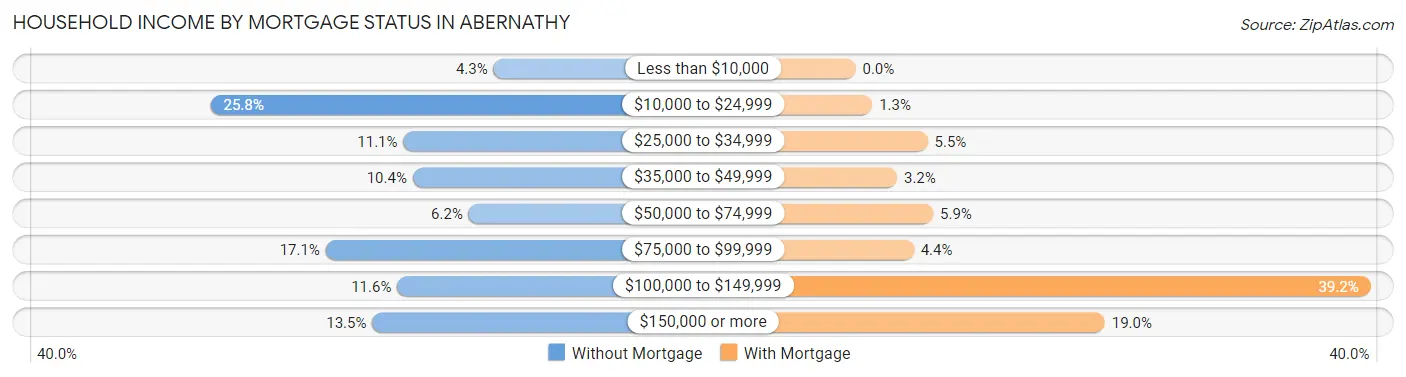
| Household Income | Without Mortgage | With Mortgage |
| Less than $10,000 | 18 (4.3%) | 0 (0.0%) |
| $10,000 to $24,999 | 109 (25.8%) | 6 (1.3%) |
| $25,000 to $34,999 | 47 (11.1%) | 26 (5.5%) |
| $35,000 to $49,999 | 44 (10.4%) | 15 (3.2%) |
| $50,000 to $74,999 | 26 (6.2%) | 28 (5.9%) |
| $75,000 to $99,999 | 72 (17.1%) | 21 (4.4%) |
| $100,000 to $149,999 | 49 (11.6%) | 186 (39.2%) |
| $150,000 or more | 57 (13.5%) | 90 (19.0%) |
| Total | 422 (100.0%) | 474 (100.0%) |
Property Value to Household Income Ratio in Abernathy
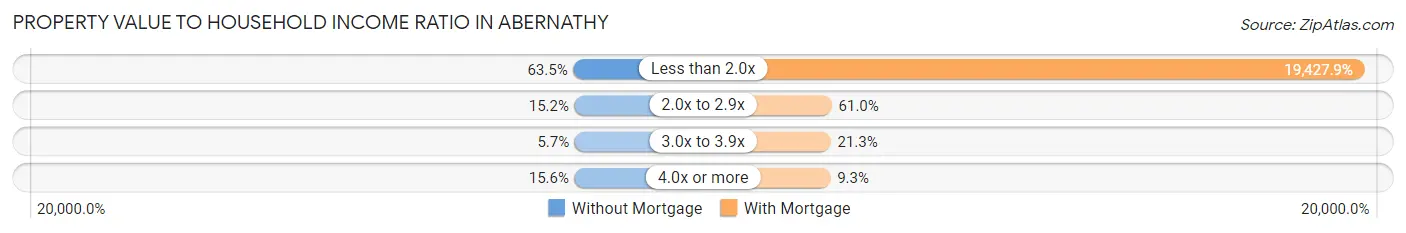
| Value-to-Income Ratio | Without Mortgage | With Mortgage |
| Less than 2.0x | 268 (63.5%) | 92,088 (19,427.9%) |
| 2.0x to 2.9x | 64 (15.2%) | 289 (61.0%) |
| 3.0x to 3.9x | 24 (5.7%) | 101 (21.3%) |
| 4.0x or more | 66 (15.6%) | 44 (9.3%) |
| Total | 422 (100.0%) | 474 (100.0%) |
Real Estate Taxes by Mortgage Status in Abernathy
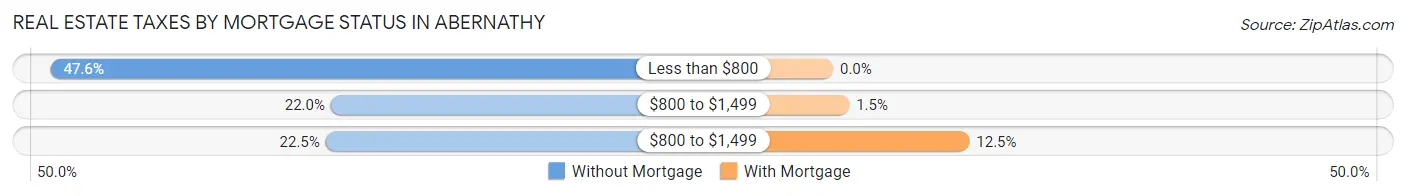
| Property Taxes | Without Mortgage | With Mortgage |
| Less than $800 | 201 (47.6%) | 0 (0.0%) |
| $800 to $1,499 | 93 (22.0%) | 7 (1.5%) |
| $800 to $1,499 | 95 (22.5%) | 59 (12.4%) |
| Total | 422 (100.0%) | 474 (100.0%) |
Health & Disability in Abernathy
Health Insurance Coverage by Age in Abernathy
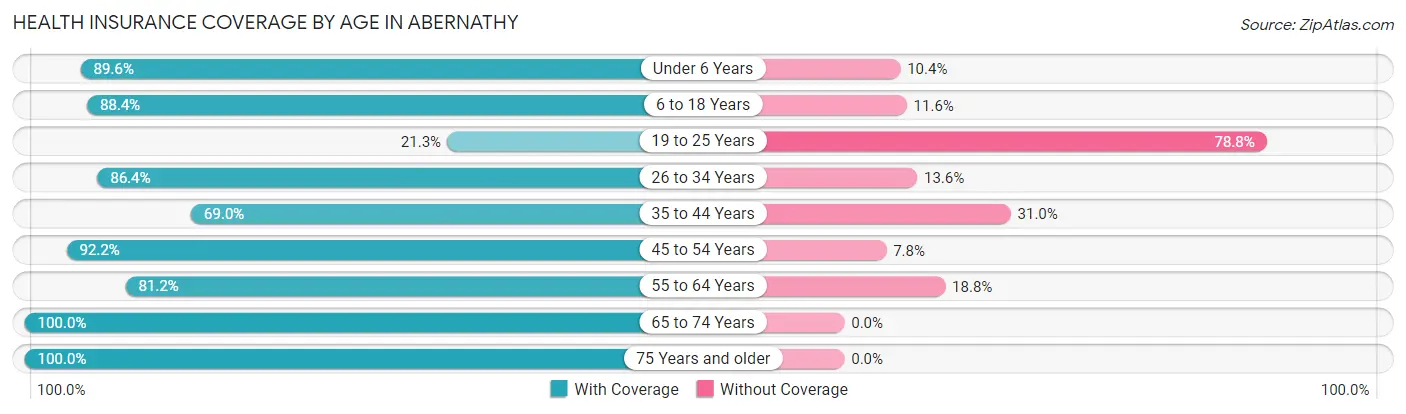
| Age Bracket | With Coverage | Without Coverage |
| Under 6 Years | 206 (89.6%) | 24 (10.4%) |
| 6 to 18 Years | 783 (88.4%) | 103 (11.6%) |
| 19 to 25 Years | 51 (21.2%) | 189 (78.7%) |
| 26 to 34 Years | 153 (86.4%) | 24 (13.6%) |
| 35 to 44 Years | 536 (69.0%) | 241 (31.0%) |
| 45 to 54 Years | 236 (92.2%) | 20 (7.8%) |
| 55 to 64 Years | 164 (81.2%) | 38 (18.8%) |
| 65 to 74 Years | 326 (100.0%) | 0 (0.0%) |
| 75 Years and older | 172 (100.0%) | 0 (0.0%) |
| Total | 2,627 (80.4%) | 639 (19.6%) |
Health Insurance Coverage by Citizenship Status in Abernathy
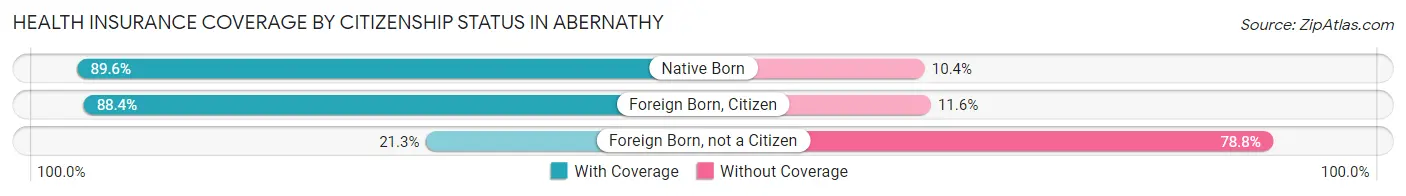
| Citizenship Status | With Coverage | Without Coverage |
| Native Born | 206 (89.6%) | 24 (10.4%) |
| Foreign Born, Citizen | 783 (88.4%) | 103 (11.6%) |
| Foreign Born, not a Citizen | 51 (21.2%) | 189 (78.7%) |
Health Insurance Coverage by Household Income in Abernathy
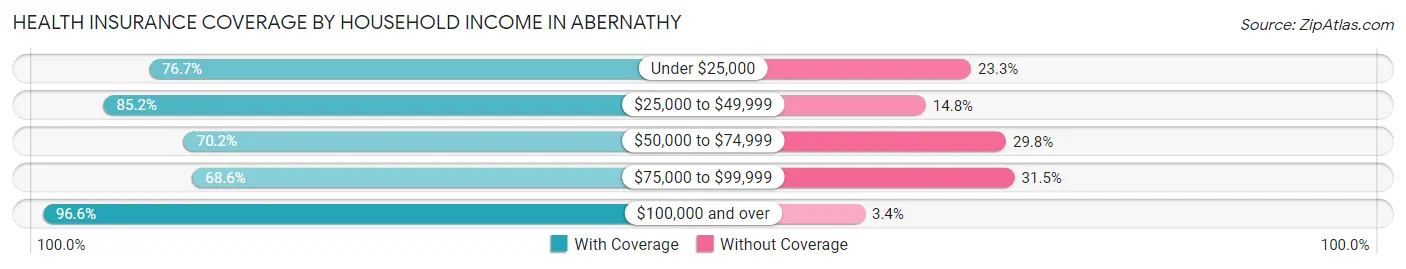
| Household Income | With Coverage | Without Coverage |
| Under $25,000 | 237 (76.7%) | 72 (23.3%) |
| $25,000 to $49,999 | 316 (85.2%) | 55 (14.8%) |
| $50,000 to $74,999 | 214 (70.2%) | 91 (29.8%) |
| $75,000 to $99,999 | 839 (68.5%) | 385 (31.5%) |
| $100,000 and over | 1,017 (96.6%) | 36 (3.4%) |
Public vs Private Health Insurance Coverage by Age in Abernathy
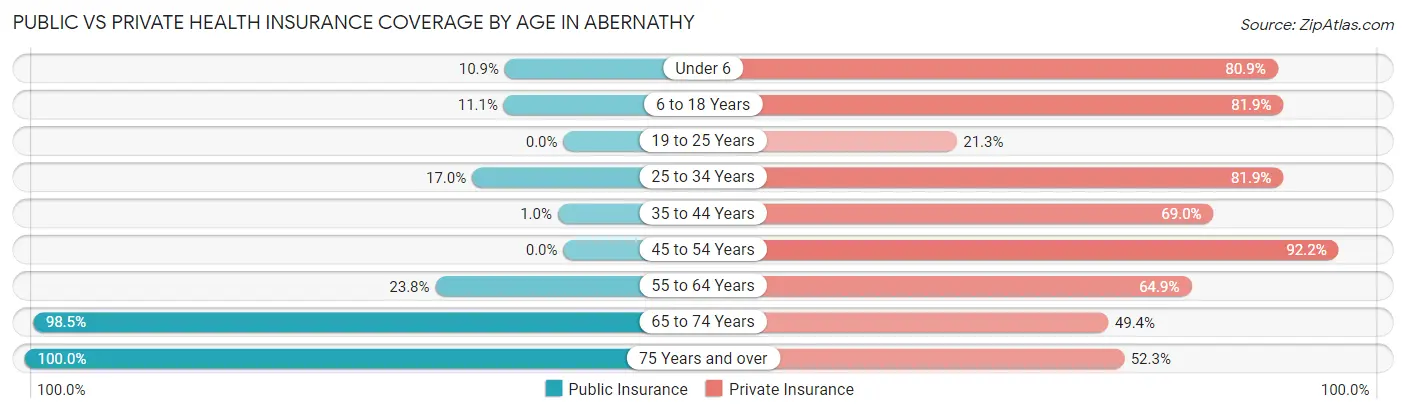
| Age Bracket | Public Insurance | Private Insurance |
| Under 6 | 25 (10.9%) | 186 (80.9%) |
| 6 to 18 Years | 98 (11.1%) | 726 (81.9%) |
| 19 to 25 Years | 0 (0.0%) | 51 (21.2%) |
| 25 to 34 Years | 30 (17.0%) | 145 (81.9%) |
| 35 to 44 Years | 8 (1.0%) | 536 (69.0%) |
| 45 to 54 Years | 0 (0.0%) | 236 (92.2%) |
| 55 to 64 Years | 48 (23.8%) | 131 (64.8%) |
| 65 to 74 Years | 321 (98.5%) | 161 (49.4%) |
| 75 Years and over | 172 (100.0%) | 90 (52.3%) |
| Total | 702 (21.5%) | 2,262 (69.3%) |
Disability Status by Sex by Age in Abernathy
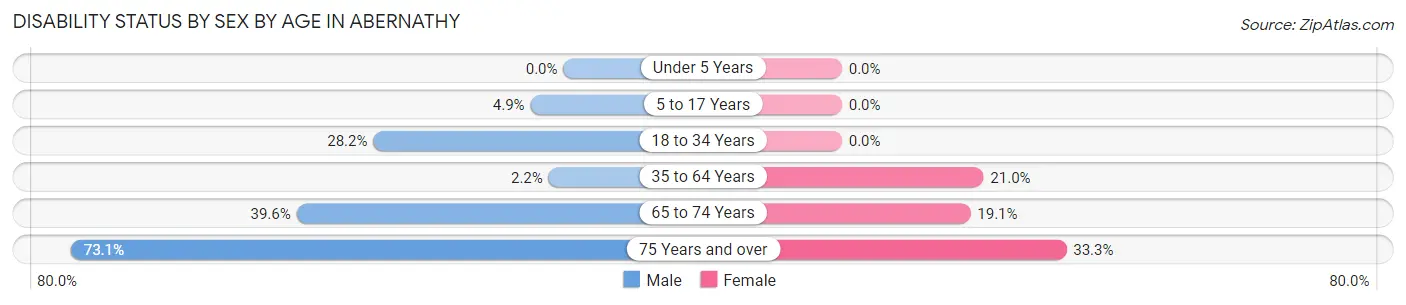
| Age Bracket | Male | Female |
| Under 5 Years | 0 (0.0%) | 0 (0.0%) |
| 5 to 17 Years | 24 (4.9%) | 0 (0.0%) |
| 18 to 34 Years | 46 (28.2%) | 0 (0.0%) |
| 35 to 64 Years | 13 (2.2%) | 135 (21.0%) |
| 65 to 74 Years | 42 (39.6%) | 42 (19.1%) |
| 75 Years and over | 49 (73.1%) | 35 (33.3%) |
Disability Class by Sex by Age in Abernathy
Disability Class: Hearing Difficulty
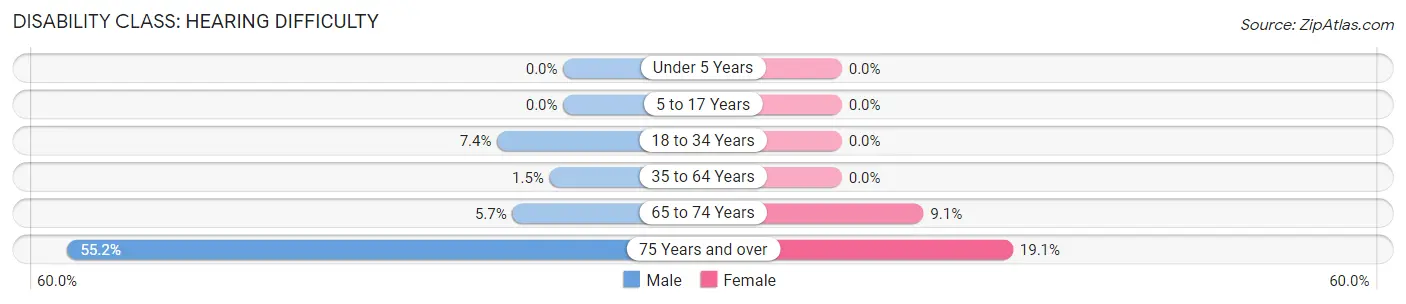
| Age Bracket | Male | Female |
| Under 5 Years | 0 (0.0%) | 0 (0.0%) |
| 5 to 17 Years | 0 (0.0%) | 0 (0.0%) |
| 18 to 34 Years | 12 (7.4%) | 0 (0.0%) |
| 35 to 64 Years | 9 (1.5%) | 0 (0.0%) |
| 65 to 74 Years | 6 (5.7%) | 20 (9.1%) |
| 75 Years and over | 37 (55.2%) | 20 (19.1%) |
Disability Class: Vision Difficulty
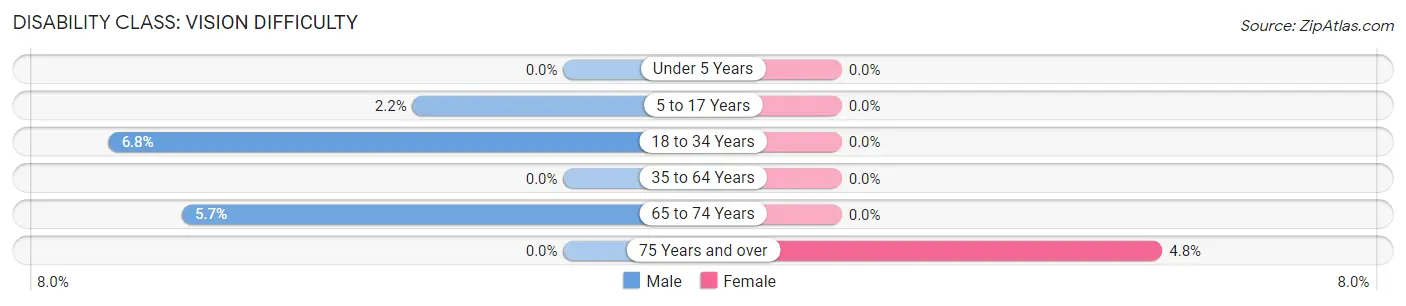
| Age Bracket | Male | Female |
| Under 5 Years | 0 (0.0%) | 0 (0.0%) |
| 5 to 17 Years | 11 (2.2%) | 0 (0.0%) |
| 18 to 34 Years | 11 (6.8%) | 0 (0.0%) |
| 35 to 64 Years | 0 (0.0%) | 0 (0.0%) |
| 65 to 74 Years | 6 (5.7%) | 0 (0.0%) |
| 75 Years and over | 0 (0.0%) | 5 (4.8%) |
Disability Class: Cognitive Difficulty
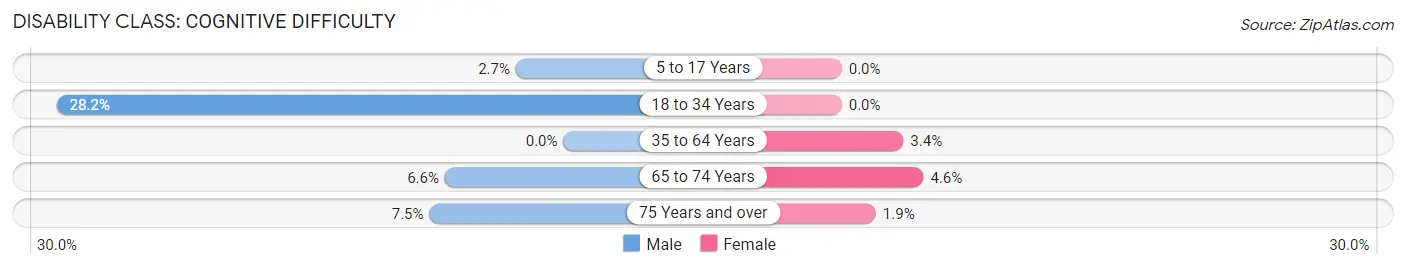
| Age Bracket | Male | Female |
| 5 to 17 Years | 13 (2.6%) | 0 (0.0%) |
| 18 to 34 Years | 46 (28.2%) | 0 (0.0%) |
| 35 to 64 Years | 0 (0.0%) | 22 (3.4%) |
| 65 to 74 Years | 7 (6.6%) | 10 (4.5%) |
| 75 Years and over | 5 (7.5%) | 2 (1.9%) |
Disability Class: Ambulatory Difficulty
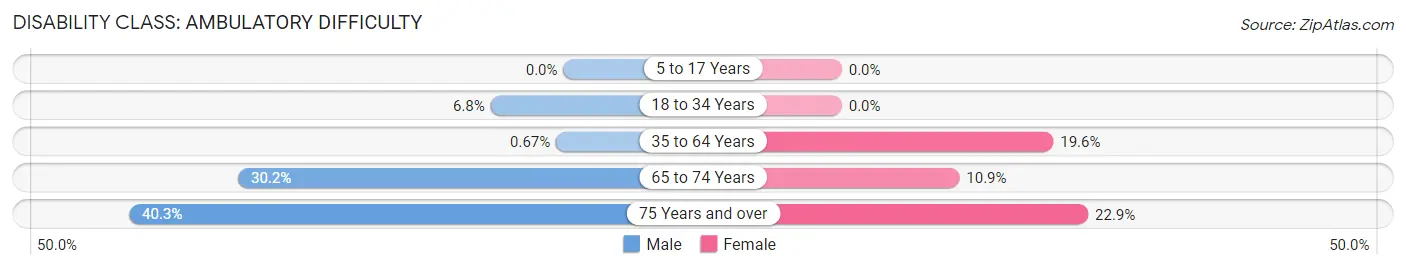
| Age Bracket | Male | Female |
| 5 to 17 Years | 0 (0.0%) | 0 (0.0%) |
| 18 to 34 Years | 11 (6.8%) | 0 (0.0%) |
| 35 to 64 Years | 4 (0.7%) | 126 (19.6%) |
| 65 to 74 Years | 32 (30.2%) | 24 (10.9%) |
| 75 Years and over | 27 (40.3%) | 24 (22.9%) |
Disability Class: Self-Care Difficulty
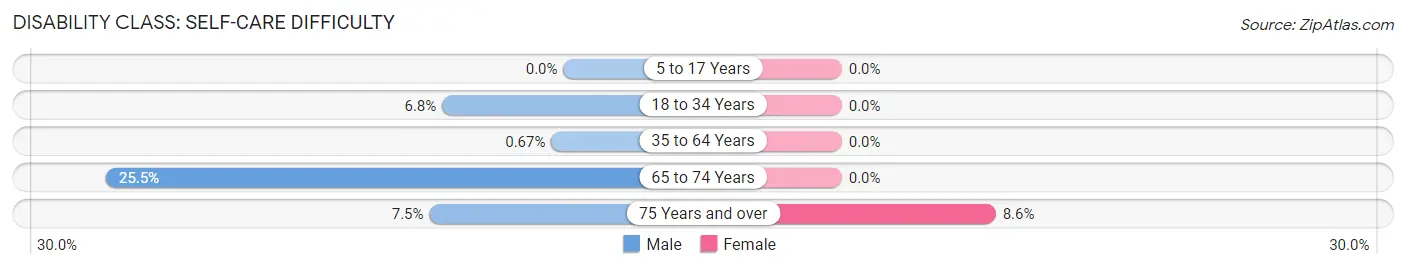
| Age Bracket | Male | Female |
| 5 to 17 Years | 0 (0.0%) | 0 (0.0%) |
| 18 to 34 Years | 11 (6.8%) | 0 (0.0%) |
| 35 to 64 Years | 4 (0.7%) | 0 (0.0%) |
| 65 to 74 Years | 27 (25.5%) | 0 (0.0%) |
| 75 Years and over | 5 (7.5%) | 9 (8.6%) |
Technology Access in Abernathy
Computing Device Access in Abernathy
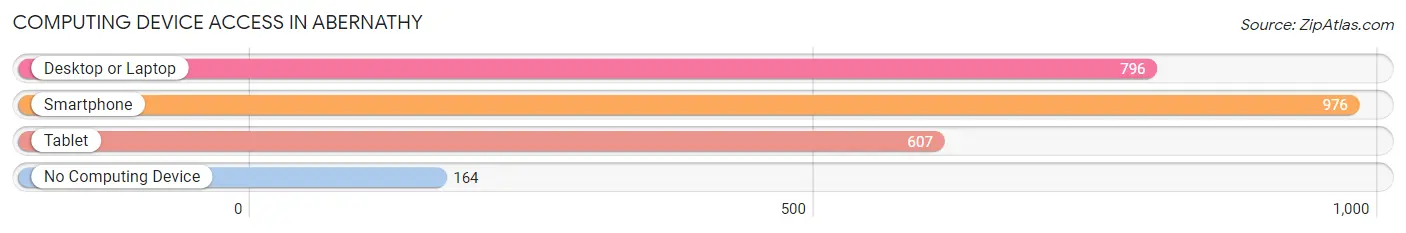
| Device Type | # Households | % Households |
| Desktop or Laptop | 796 | 68.4% |
| Smartphone | 976 | 83.9% |
| Tablet | 607 | 52.1% |
| No Computing Device | 164 | 14.1% |
| Total | 1,164 | 100.0% |
Internet Access in Abernathy
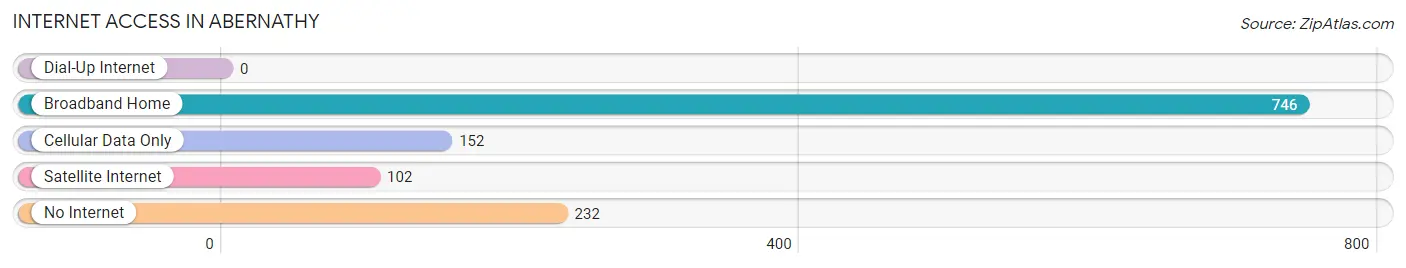
| Internet Type | # Households | % Households |
| Dial-Up Internet | 0 | 0.0% |
| Broadband Home | 746 | 64.1% |
| Cellular Data Only | 152 | 13.1% |
| Satellite Internet | 102 | 8.8% |
| No Internet | 232 | 19.9% |
| Total | 1,164 | 100.0% |
Abernathy Summary
Abernathy, Texas is a small town located in the northern part of the state, in Hale County. It is situated about 20 miles northeast of Lubbock and is part of the Lubbock Metropolitan Statistical Area. The town was founded in 1876 and named after a local rancher, William Abernathy. The population of Abernathy was 2,845 in the 2010 census, making it the second-largest town in Hale County.
History
Abernathy was founded in 1876 by William Abernathy, a rancher who had moved to the area from Tennessee. He established a trading post and a post office in the area, and the town was officially incorporated in 1891. The town grew slowly but steadily, and by the early 1900s, it had become a thriving agricultural center. Cotton was the main crop, and the town was home to several cotton gins and other businesses related to the cotton industry.
In the 1920s, the town began to diversify its economy, and several new businesses opened, including a bank, a hotel, and a movie theater. The Great Depression hit the town hard, but it managed to survive and even thrive in the years that followed. The town was home to several successful businesses, including a cotton gin, a feed store, and a grocery store.
In the 1950s, the town began to experience a population boom, as many people moved to the area to take advantage of the booming oil industry. The town was home to several oil-related businesses, and the population grew to over 4,000 by the 1960s.
Geography
Abernathy is located in the northern part of Hale County, about 20 miles northeast of Lubbock. The town is situated on the Llano Estacado, a large plateau that stretches across the Texas Panhandle. The town is surrounded by flat, open plains, and the terrain is mostly flat, with some rolling hills. The climate is semi-arid, with hot summers and mild winters.
Economy
Abernathy’s economy is largely based on agriculture and oil. The town is home to several cotton gins, as well as several businesses related to the oil industry. The town is also home to several small businesses, including restaurants, retail stores, and service providers.
Demographics
As of the 2010 census, the population of Abernathy was 2,845. The racial makeup of the town was 79.3% White, 0.7% African American, 0.3% Native American, 0.2% Asian, 0.1% Pacific Islander, 17.7% from other races, and 1.9% from two or more races. Hispanic or Latino of any race were 33.2% of the population.
The median income for a household in Abernathy was $31,250, and the median income for a family was $37,500. The per capita income for the town was $15,845. About 17.2% of families and 20.3% of the population were below the poverty line, including 28.2% of those under age 18 and 11.2% of those age 65 or over.
Abernathy is a small town with a rich history and a diverse economy. It is home to several businesses related to the oil and cotton industries, as well as several small businesses. The town has a diverse population, with a mix of races and ethnicities. The town is a great place to live and work, and it offers a unique blend of rural and urban life.
Common Questions
What is Per Capita Income in Abernathy?
Per Capita income in Abernathy is $28,433.
What is the Median Family Income in Abernathy?
Median Family Income in Abernathy is $90,541.
What is the Median Household income in Abernathy?
Median Household Income in Abernathy is $80,114.
What is Income or Wage Gap in Abernathy?
Income or Wage Gap in Abernathy is 64.2%.
Women in Abernathy earn 35.8 cents for every dollar earned by a man.
What is Inequality or Gini Index in Abernathy?
Inequality or Gini Index in Abernathy is 0.41.
What is the Total Population of Abernathy?
Total Population of Abernathy is 3,266.
What is the Total Male Population of Abernathy?
Total Male Population of Abernathy is 1,508.
What is the Total Female Population of Abernathy?
Total Female Population of Abernathy is 1,758.
What is the Ratio of Males per 100 Females in Abernathy?
There are 85.78 Males per 100 Females in Abernathy.
What is the Ratio of Females per 100 Males in Abernathy?
There are 116.58 Females per 100 Males in Abernathy.
What is the Median Population Age in Abernathy?
Median Population Age in Abernathy is 37.4 Years.
What is the Average Family Size in Abernathy
Average Family Size in Abernathy is 3.4 People.
What is the Average Household Size in Abernathy
Average Household Size in Abernathy is 2.8 People.
How Large is the Labor Force in Abernathy?
There are 1,506 People in the Labor Forcein in Abernathy.
What is the Percentage of People in the Labor Force in Abernathy?
60.6% of People are in the Labor Force in Abernathy.
What is the Unemployment Rate in Abernathy?
Unemployment Rate in Abernathy is 1.6%.