Zip Codes with the Highest Poverty Level Among Children Under the Age of 5 in Nashville, TN

RELATED REPORTS & OPTIONS

Highest Poverty | Child 0-5
Population
Families and Households
Female Fertility
Female Fertility (Unmarried)
Race (Community Size)
Race (Percentage)
Ancestry (Community Size)
AfghanAfricanAlbanianAmericanApacheArabArgentineanArmenianAustralianAustrianBahamianBasqueBelgianBelizeanBhutaneseBlackfeetBolivianBrazilianBritishBritish West IndianBulgarianBurmeseCajunCanadianCape VerdeanCelticCentral AmericanCentral American IndianCherokeeChickasawChileanChippewaChoctawColombianComancheCosta RicanCreekCroatianCubanCzechCzechoslovakianDanishDominicanDutchEastern EuropeanEcuadorianEgyptianEnglishEthiopianEuropeanFijianFilipinoFinnishFrenchFrench CanadianGermanGerman RussianGhanaianGreekGuamanian / ChamorroGuatemalanGuyaneseHaitianHonduranHungarianIcelanderIndian (Asian)IndonesianIranianIraqiIrishIroquoisIsraeliItalianJamaicanJapaneseJordanianKenyanKoreanLaotianLatvianLebaneseLiberianLithuanianLumbeeLuxembourgerMalaysianMexicanMexican American IndianMongolianMoroccanNative HawaiianNavajoNicaraguanNigerianNorthern EuropeanNorwegianPakistaniPalestinianPanamanianPeruvianPolishPortuguesePotawatomiPuerto RicanRomanianRussianSalvadoranSamoanScandinavianScotch-IrishScottishSerbianSierra LeoneanSlavicSlovakSloveneSomaliSouth AfricanSouth AmericanSouth American IndianSpaniardSpanishSri LankanSubsaharan AfricanSudaneseSwedishSwissSyrianThaiTrinidadian and TobagonianTurkishUkrainianVenezuelanVietnameseWelshWest IndianYugoslavian
Ancestry (Percentage)
AfghanAfricanAlbanianAmericanApacheArabArgentineanArmenianAustralianAustrianBahamianBasqueBelgianBelizeanBhutaneseBlackfeetBolivianBrazilianBritishBritish West IndianBulgarianBurmeseCajunCanadianCape VerdeanCelticCentral AmericanCentral American IndianCherokeeChickasawChileanChippewaChoctawColombianComancheCosta RicanCreekCroatianCubanCzechCzechoslovakianDanishDominicanDutchEastern EuropeanEcuadorianEgyptianEnglishEthiopianEuropeanFijianFilipinoFinnishFrenchFrench CanadianGermanGerman RussianGhanaianGreekGuamanian / ChamorroGuatemalanGuyaneseHaitianHonduranHungarianIcelanderIndian (Asian)IndonesianIranianIraqiIrishIroquoisIsraeliItalianJamaicanJapaneseJordanianKenyanKoreanLaotianLatvianLebaneseLiberianLithuanianLumbeeLuxembourgerMalaysianMexicanMexican American IndianMongolianMoroccanNative HawaiianNavajoNicaraguanNigerianNorthern EuropeanNorwegianPakistaniPalestinianPanamanianPeruvianPolishPortuguesePotawatomiPuerto RicanRomanianRussianSalvadoranSamoanScandinavianScotch-IrishScottishSerbianSierra LeoneanSlavicSlovakSloveneSomaliSouth AfricanSouth AmericanSouth American IndianSpaniardSpanishSri LankanSubsaharan AfricanSudaneseSwedishSwissSyrianThaiTrinidadian and TobagonianTurkishUkrainianVenezuelanVietnameseWelshWest IndianYugoslavian
Immigrant Origin (Total)
AfghanistanAfricaArgentinaAsiaAustraliaAustriaBahamasBangladeshBelgiumBelizeBoliviaBosnia and HerzegovinaBrazilBulgariaBurma / MyanmarCambodiaCameroonCanadaCaribbeanCentral AmericaChileChinaColombiaCongoCosta RicaCroatiaCubaCzechoslovakiaDenmarkDominicaDominican RepublicEastern AfricaEastern AsiaEastern EuropeEcuadorEgyptEl SalvadorEnglandEritreaEthiopiaEuropeFranceGermanyGhanaGreeceGrenadaGuatemalaGuyanaHaitiHondurasIndiaIndonesiaIranIraqIrelandIsraelItalyJamaicaJapanJordanKazakhstanKenyaKoreaKuwaitLaosLatin AmericaLebanonLiberiaMalaysiaMexicoMiddle AfricaMoroccoNepalNicaraguaNigeriaNorthern AfricaNorthern EuropeOceaniaPakistanPanamaPeruPhilippinesPolandRomaniaRussiaScotlandSingaporeSomaliaSouth AfricaSouth AmericaSouth Central AsiaSouth Eastern AsiaSouthern EuropeSpainSri LankaSudanSwedenSwitzerlandSyriaTaiwanThailandTrinidad and TobagoTurkeyUkraineUzbekistanVenezuelaVietnamWestern AfricaWestern AsiaWestern EuropeZaireZimbabwe
Immigrant Origin (Percentage)
AfghanistanAfricaArgentinaAsiaAustraliaAustriaBahamasBangladeshBelgiumBelizeBoliviaBosnia and HerzegovinaBrazilBulgariaBurma / MyanmarCambodiaCameroonCanadaCaribbeanCentral AmericaChileChinaColombiaCongoCosta RicaCroatiaCubaCzechoslovakiaDenmarkDominicaDominican RepublicEastern AfricaEastern AsiaEastern EuropeEcuadorEgyptEl SalvadorEnglandEritreaEthiopiaEuropeFranceGermanyGhanaGreeceGrenadaGuatemalaGuyanaHaitiHondurasIndiaIndonesiaIranIraqIrelandIsraelItalyJamaicaJapanJordanKazakhstanKenyaKoreaKuwaitLaosLatin AmericaLebanonLiberiaMalaysiaMexicoMiddle AfricaMoroccoNepalNicaraguaNigeriaNorthern AfricaNorthern EuropeOceaniaPakistanPanamaPeruPhilippinesPolandRomaniaRussiaScotlandSingaporeSomaliaSouth AfricaSouth AmericaSouth Central AsiaSouth Eastern AsiaSouthern EuropeSpainSri LankaSudanSwedenSwitzerlandSyriaTaiwanThailandTrinidad and TobagoTurkeyUkraineUzbekistanVenezuelaVietnamWestern AfricaWestern AsiaWestern EuropeZaireZimbabwe
Income
Income (Families)
Income (Households)
Poverty
Poverty (Families)
Unemployment
Employment Occupations
Employment Industries
Employer Class
Commute Time
Commute Means
School Enrollment
Education by Degree Field
Occupancy
Finances
Physical Characteristics
Nashville
Compare Zip Codes
Comparison Subject

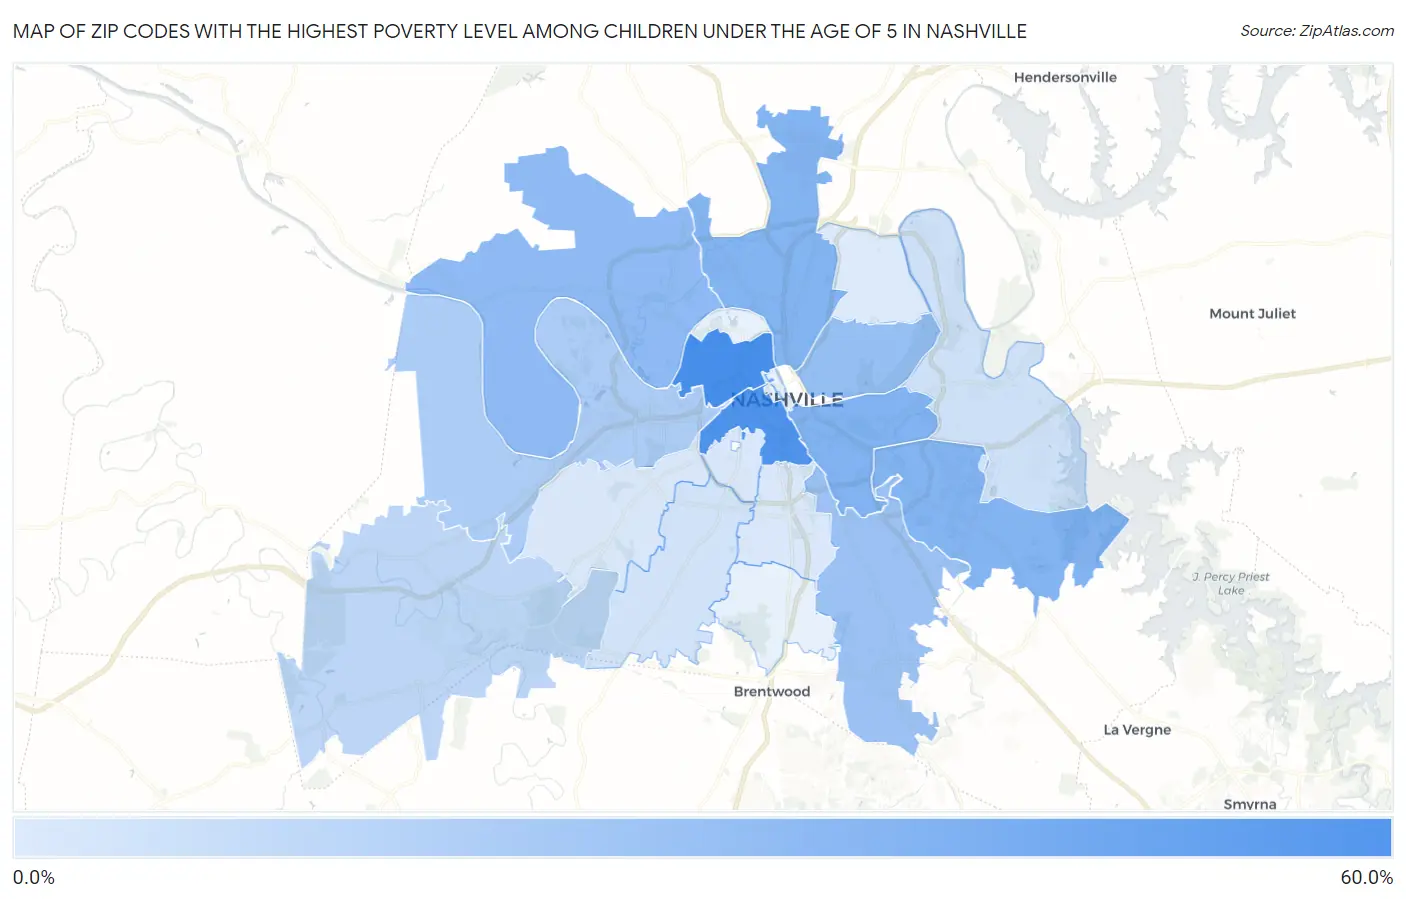
Map of Zip Codes with the Highest Poverty Level Among Children Under the Age of 5 in Nashville

0.0%
60.0%
Zip Codes with the Highest Poverty Level Among Children Under the Age of 5 in Nashville Map

Zip Codes with the Highest Poverty Level Among Children Under the Age of 5 in Nashville, TN

Zip Code Child Poverty vs State vs National
1.3720856.6%21.4%(+35.2)#3518.1%(+38.6)#1,936
2.3720353.6%21.4%(+32.2)#4518.1%(+35.5)#2,183
3.3721032.4%21.4%(+11.0)#12918.1%(+14.4)#5,732
4.3721731.5%21.4%(+10.1)#14218.1%(+13.4)#5,955
5.3720731.2%21.4%(+9.79)#14418.1%(+13.1)#6,038
6.3721826.9%21.4%(+5.48)#17818.1%(+8.81)#7,348
7.3720624.5%21.4%(+3.11)#20118.1%(+6.44)#8,175
8.3721123.2%21.4%(+1.80)#21418.1%(+5.13)#8,685
9.3720916.5%21.4%(-4.93)#29118.1%(-1.60)#11,665
10.3722110.9%21.4%(-10.5)#35218.1%(-7.14)#14,884
11.372145.5%21.4%(-15.9)#41818.1%(-12.6)#18,427
12.372154.3%21.4%(-17.1)#42518.1%(-13.8)#19,262
13.372122.7%21.4%(-18.7)#43918.1%(-15.4)#20,369
14.372052.6%21.4%(-18.8)#44218.1%(-15.4)#20,433
15.372041.4%21.4%(-20.0)#46218.1%(-16.6)#21,180
16.372160.99%21.4%(-20.4)#46618.1%(-17.1)#21,400

Common Questions

What are the Top 10 Zip Codes with the Highest Poverty Level Among Children Under the Age of 5 in Nashville, TN?
Top 10 Zip Codes with the Highest Poverty Level Among Children Under the Age of 5 in Nashville, TN are:
#1
56.6%
#2
53.6%
#3
32.4%
#4
31.5%
#5
31.2%
#6
26.9%
#7
24.5%
#8
23.2%
#9
16.5%
#10
10.9%
What zip code has the Highest Poverty Level Among Children Under the Age of 5 in Nashville, TN?
37208 has the Highest Poverty Level Among Children Under the Age of 5 in Nashville, TN with 56.6%.
What is the Poverty Level Among Children Under the Age of 5 in Nashville, TN?
Poverty Level Among Children Under the Age of 5 in Nashville is 21.2%.
What is the Poverty Level Among Children Under the Age of 5 in Tennessee?
Poverty Level Among Children Under the Age of 5 in Tennessee is 21.4%.
What is the Poverty Level Among Children Under the Age of 5 in the United States?
Poverty Level Among Children Under the Age of 5 in the United States is 18.1%.