Zip Codes with the Highest Percentage of Population Employed in Agriculture, Fishing & Hunting in Memphis, TN
RELATED REPORTS & OPTIONS
Agriculture, Fishing & Hunting
Memphis
Compare Zip Codes
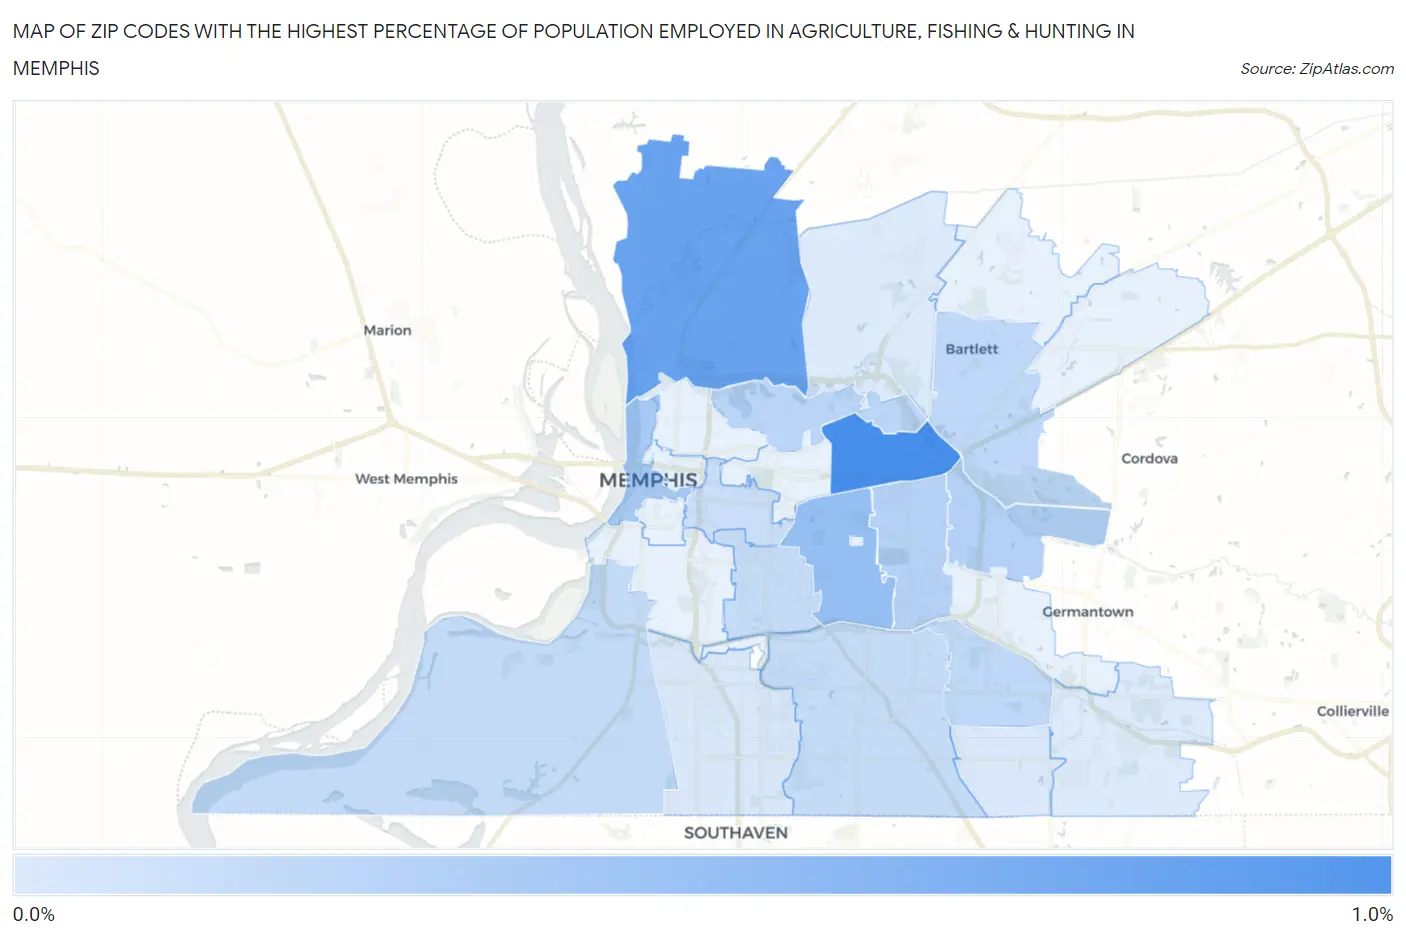
Map of Zip Codes with the Highest Percentage of Population Employed in Agriculture, Fishing & Hunting in Memphis
0.0%
1.0%
Zip Codes with the Highest Percentage of Population Employed in Agriculture, Fishing & Hunting in Memphis, TN
| Zip Code | % Employed | vs State | vs National | |
| 1. | 38122 | 0.94% | 0.74%(+0.205)#262 | 1.2%(-0.257)#16,487 |
| 2. | 38127 | 0.75% | 0.74%(+0.013)#289 | 1.2%(-0.450)#17,540 |
| 3. | 38111 | 0.48% | 0.74%(-0.259)#331 | 1.2%(-0.722)#19,466 |
| 4. | 38103 | 0.36% | 0.74%(-0.380)#360 | 1.2%(-0.843)#20,585 |
| 5. | 38120 | 0.29% | 0.74%(-0.449)#375 | 1.2%(-0.912)#21,320 |
| 6. | 38117 | 0.28% | 0.74%(-0.460)#381 | 1.2%(-0.923)#21,449 |
| 7. | 38108 | 0.25% | 0.74%(-0.488)#391 | 1.2%(-0.951)#21,780 |
| 8. | 38115 | 0.23% | 0.74%(-0.509)#400 | 1.2%(-0.972)#22,012 |
| 9. | 38134 | 0.22% | 0.74%(-0.516)#403 | 1.2%(-0.979)#22,099 |
| 10. | 38109 | 0.19% | 0.74%(-0.542)#413 | 1.2%(-1.01)#22,433 |
| 11. | 38114 | 0.18% | 0.74%(-0.552)#415 | 1.2%(-1.02)#22,544 |
| 12. | 38118 | 0.18% | 0.74%(-0.558)#417 | 1.2%(-1.02)#22,611 |
| 13. | 38104 | 0.15% | 0.74%(-0.586)#429 | 1.2%(-1.05)#23,004 |
| 14. | 38116 | 0.075% | 0.74%(-0.662)#456 | 1.2%(-1.12)#24,035 |
| 15. | 38141 | 0.062% | 0.74%(-0.674)#458 | 1.2%(-1.14)#24,196 |
| 16. | 38128 | 0.047% | 0.74%(-0.690)#462 | 1.2%(-1.15)#24,386 |
| 17. | 38125 | 0.045% | 0.74%(-0.692)#463 | 1.2%(-1.15)#24,403 |
1
Common Questions
What are the Top 10 Zip Codes with the Highest Percentage of Population Employed in Agriculture, Fishing & Hunting in Memphis, TN?
Top 10 Zip Codes with the Highest Percentage of Population Employed in Agriculture, Fishing & Hunting in Memphis, TN are:
What zip code has the Highest Percentage of Population Employed in Agriculture, Fishing & Hunting in Memphis, TN?
38122 has the Highest Percentage of Population Employed in Agriculture, Fishing & Hunting in Memphis, TN with 0.94%.
What is the Percentage of Population Employed in Agriculture, Fishing & Hunting in Memphis, TN?
Percentage of Population Employed in Agriculture, Fishing & Hunting in Memphis is 0.21%.
What is the Percentage of Population Employed in Agriculture, Fishing & Hunting in Tennessee?
Percentage of Population Employed in Agriculture, Fishing & Hunting in Tennessee is 0.74%.
What is the Percentage of Population Employed in Agriculture, Fishing & Hunting in the United States?
Percentage of Population Employed in Agriculture, Fishing & Hunting in the United States is 1.2%.