Zip Codes with the Highest Percentage of Population Employed in Farming, Fishing & Forestry in Memphis, TN

RELATED REPORTS & OPTIONS

Farming, Fishing & Forestry
Population
Families and Households
Female Fertility
Female Fertility (Unmarried)
Race (Community Size)
Race (Percentage)
Ancestry (Community Size)
AfricanAlbanianAmericanApacheArabArgentineanArmenianAustralianAustrianBahamianBangladeshiBelgianBelizeanBhutaneseBlackfeetBolivianBrazilianBritishBritish West IndianBurmeseCambodianCanadianCelticCentral AmericanCentral American IndianCherokeeChickasawChileanChoctawColombianCosta RicanCreekCroatianCubanCzechCzechoslovakianDanishDominicanDutchEastern EuropeanEcuadorianEgyptianEnglishEthiopianEuropeanFilipinoFinnishFrenchFrench CanadianGermanGhanaianGreekGuatemalanHaitianHonduranHungarianIndian (Asian)IndonesianIranianIrishIroquoisIsraeliItalianJamaicanJapaneseJordanianKenyanKoreanLaotianLatvianLebaneseLithuanianMalaysianMexicanMexican American IndianMoroccanNative HawaiianNavajoNicaraguanNigerianNorthern EuropeanNorwegianPakistaniPalestinianPanamanianPennsylvania GermanPeruvianPolishPortuguesePuerto RicanRomanianRussianSalvadoranSamoanScandinavianScotch-IrishScottishSeminoleSenegaleseSerbianSiouxSlavicSlovakSomaliSouth AfricanSouth AmericanSpaniardSpanishSri LankanSubsaharan AfricanSwedishSwissSyrianThaiTrinidadian and TobagonianTurkishUkrainianUruguayanVenezuelanVietnameseWelshWest IndianYugoslavian
Ancestry (Percentage)
AfricanAlbanianAmericanApacheArabArgentineanArmenianAustralianAustrianBahamianBangladeshiBelgianBelizeanBhutaneseBlackfeetBolivianBrazilianBritishBritish West IndianBurmeseCambodianCanadianCelticCentral AmericanCentral American IndianCherokeeChickasawChileanChoctawColombianCosta RicanCreekCroatianCubanCzechCzechoslovakianDanishDominicanDutchEastern EuropeanEcuadorianEgyptianEnglishEthiopianEuropeanFilipinoFinnishFrenchFrench CanadianGermanGhanaianGreekGuatemalanHaitianHonduranHungarianIndian (Asian)IndonesianIranianIrishIroquoisIsraeliItalianJamaicanJapaneseJordanianKenyanKoreanLaotianLatvianLebaneseLithuanianMalaysianMexicanMexican American IndianMoroccanNative HawaiianNavajoNicaraguanNigerianNorthern EuropeanNorwegianPakistaniPalestinianPanamanianPennsylvania GermanPeruvianPolishPortuguesePuerto RicanRomanianRussianSalvadoranSamoanScandinavianScotch-IrishScottishSeminoleSenegaleseSerbianSiouxSlavicSlovakSomaliSouth AfricanSouth AmericanSpaniardSpanishSri LankanSubsaharan AfricanSwedishSwissSyrianThaiTrinidadian and TobagonianTurkishUkrainianUruguayanVenezuelanVietnameseWelshWest IndianYugoslavian
Immigrant Origin (Total)
Immigrant Origin (Percentage)
Income
Income (Families)
Income (Households)
Poverty
Poverty (Families)
Unemployment
Employment Occupations
Employment Industries
Employer Class
Commute Time
Commute Means
School Enrollment
Education by Degree Field
Occupancy
Finances
Physical Characteristics
Memphis
Compare Zip Codes
Comparison Subject

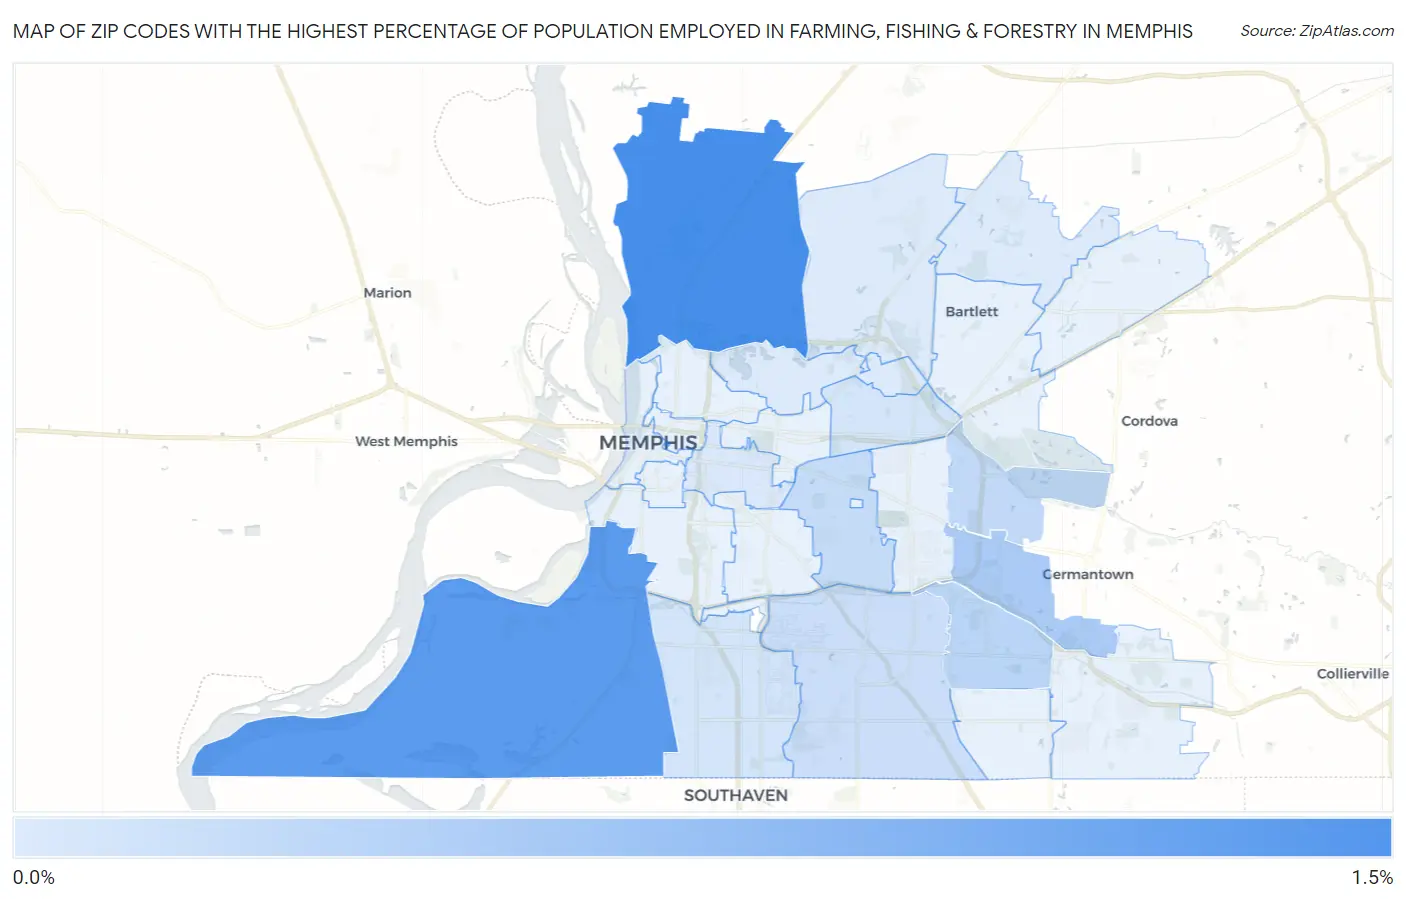
Map of Zip Codes with the Highest Percentage of Population Employed in Farming, Fishing & Forestry in Memphis

0.0%
1.5%
Zip Codes with the Highest Percentage of Population Employed in Farming, Fishing & Forestry in Memphis Map

Zip Codes with the Highest Percentage of Population Employed in Farming, Fishing & Forestry in Memphis, TN

Zip Code % Employed vs State vs National
1.381271.0%0.36%(+0.663)#1350.61%(+0.415)#9,648
2.381090.89%0.36%(+0.529)#1460.61%(+0.281)#10,299
3.381190.39%0.36%(+0.036)#2020.61%(-0.212)#13,813
4.381150.28%0.36%(-0.076)#2250.61%(-0.324)#15,046
5.381200.25%0.36%(-0.110)#2330.61%(-0.357)#15,447
6.381110.22%0.36%(-0.140)#2470.61%(-0.388)#15,880
7.381180.18%0.36%(-0.179)#2580.61%(-0.427)#16,436
8.381220.12%0.36%(-0.239)#2850.61%(-0.487)#17,451
9.381160.12%0.36%(-0.239)#2860.61%(-0.487)#17,465
10.381040.079%0.36%(-0.279)#3020.61%(-0.527)#18,142
11.381280.072%0.36%(-0.285)#3070.61%(-0.533)#18,256
12.381350.071%0.36%(-0.286)#3080.61%(-0.534)#18,276
13.381080.066%0.36%(-0.291)#3100.61%(-0.539)#18,364

Common Questions

What are the Top 10 Zip Codes with the Highest Percentage of Population Employed in Farming, Fishing & Forestry in Memphis, TN?
Top 10 Zip Codes with the Highest Percentage of Population Employed in Farming, Fishing & Forestry in Memphis, TN are:
#1
1.0%
#2
0.89%
#3
0.39%
#4
0.28%
#5
0.25%
#6
0.22%
#7
0.18%
#8
0.12%
#9
0.12%
#10
0.079%
What zip code has the Highest Percentage of Population Employed in Farming, Fishing & Forestry in Memphis, TN?
38127 has the Highest Percentage of Population Employed in Farming, Fishing & Forestry in Memphis, TN with 1.0%.
What is the Percentage of Population Employed in Farming, Fishing & Forestry in Memphis, TN?
Percentage of Population Employed in Farming, Fishing & Forestry in Memphis is 0.19%.
What is the Percentage of Population Employed in Farming, Fishing & Forestry in Tennessee?
Percentage of Population Employed in Farming, Fishing & Forestry in Tennessee is 0.36%.
What is the Percentage of Population Employed in Farming, Fishing & Forestry in the United States?
Percentage of Population Employed in Farming, Fishing & Forestry in the United States is 0.61%.