Zip Codes with the Highest Percentage of Population Employed in Arts, Entertainment & Recreation in Franklin, TN
RELATED REPORTS & OPTIONS
Arts, Entertainment & Recreation
Franklin
Compare Zip Codes
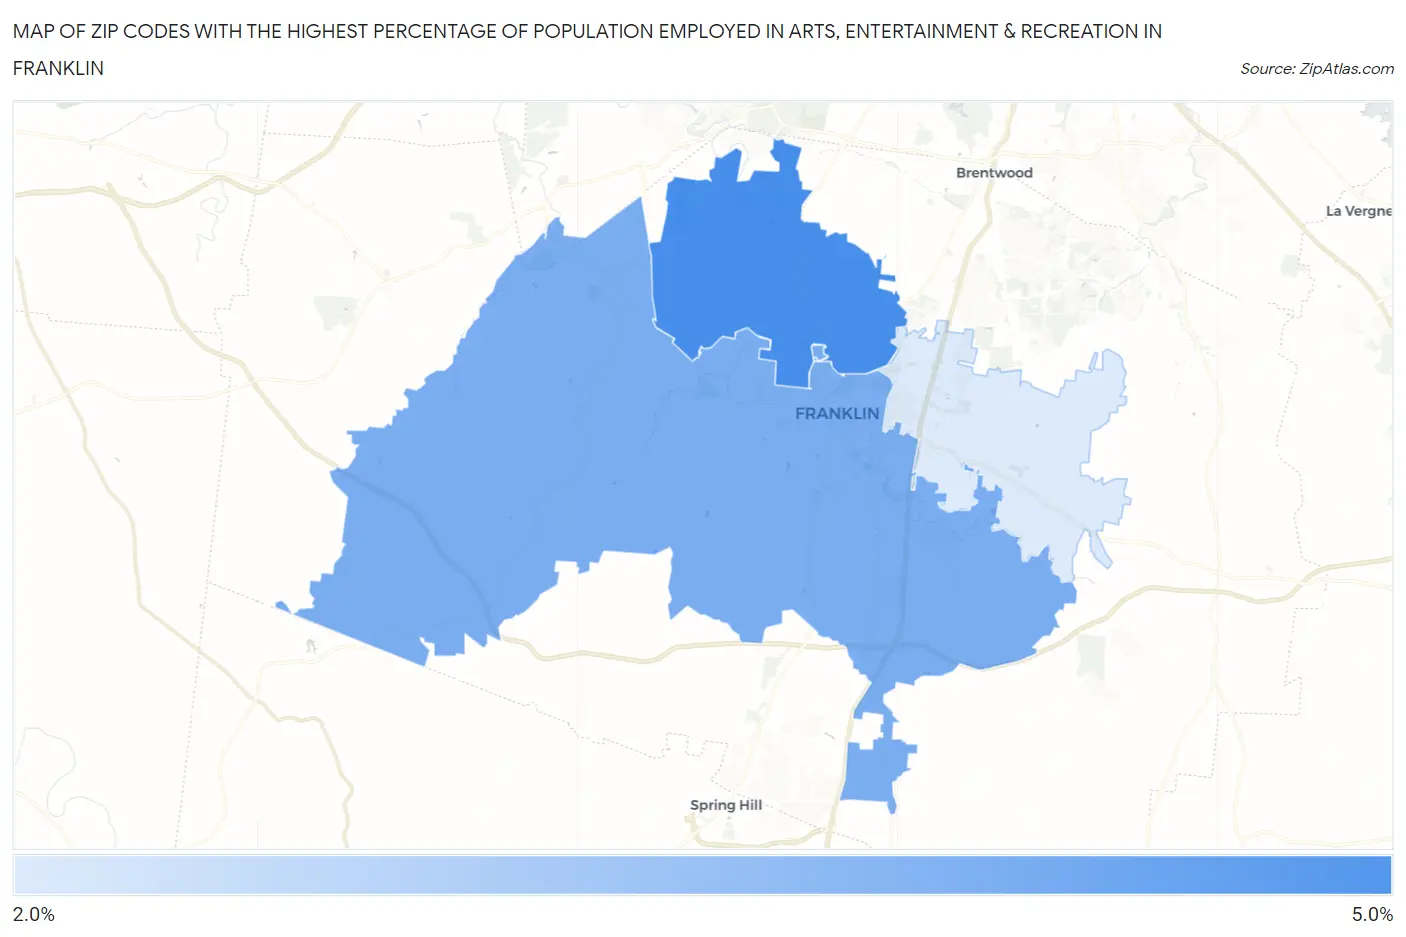
Map of Zip Codes with the Highest Percentage of Population Employed in Arts, Entertainment & Recreation in Franklin
0.0%
5.0%
Zip Codes with the Highest Percentage of Population Employed in Arts, Entertainment & Recreation in Franklin, TN
| Zip Code | % Employed | vs State | vs National | |
| 1. | 37069 | 4.5% | 1.8%(+2.67)#39 | 2.1%(+2.37)#2,794 |
| 2. | 37064 | 3.9% | 1.8%(+2.08)#53 | 2.1%(+1.78)#3,530 |
| 3. | 37067 | 2.8% | 1.8%(+0.971)#90 | 2.1%(+0.676)#6,142 |
1
Common Questions
What are the Top Zip Codes with the Highest Percentage of Population Employed in Arts, Entertainment & Recreation in Franklin, TN?
Top Zip Codes with the Highest Percentage of Population Employed in Arts, Entertainment & Recreation in Franklin, TN are:
What zip code has the Highest Percentage of Population Employed in Arts, Entertainment & Recreation in Franklin, TN?
37069 has the Highest Percentage of Population Employed in Arts, Entertainment & Recreation in Franklin, TN with 4.5%.
What is the Percentage of Population Employed in Arts, Entertainment & Recreation in Franklin, TN?
Percentage of Population Employed in Arts, Entertainment & Recreation in Franklin is 3.5%.
What is the Percentage of Population Employed in Arts, Entertainment & Recreation in Tennessee?
Percentage of Population Employed in Arts, Entertainment & Recreation in Tennessee is 1.8%.
What is the Percentage of Population Employed in Arts, Entertainment & Recreation in the United States?
Percentage of Population Employed in Arts, Entertainment & Recreation in the United States is 2.1%.