Zip Codes with the Highest Percentage of Population Employed in Office & Administration in Simpsonville, SC
RELATED REPORTS & OPTIONS
Office & Administration
Simpsonville
Compare Zip Codes
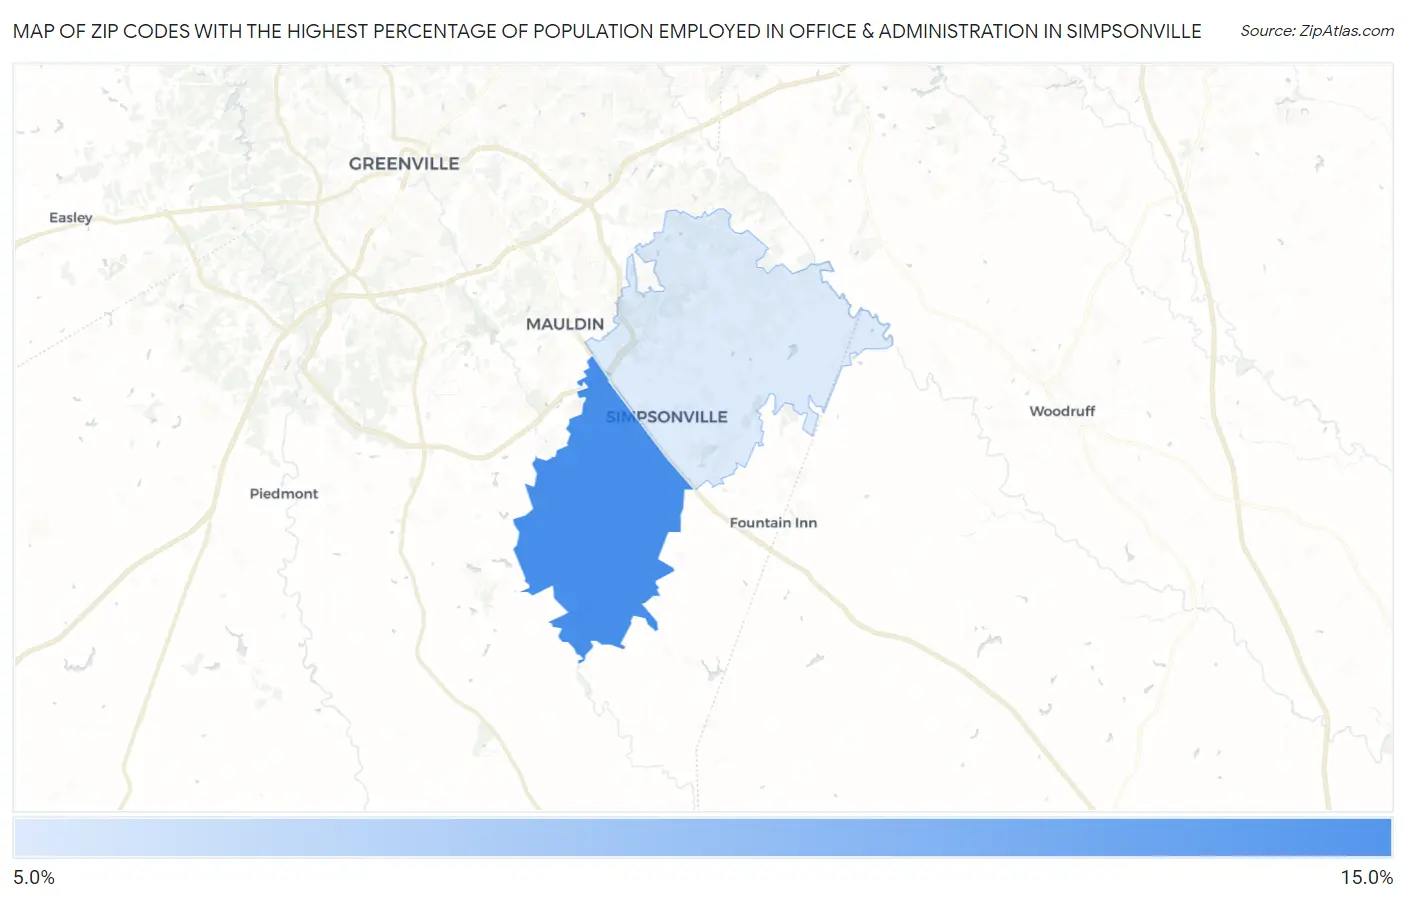
Map of Zip Codes with the Highest Percentage of Population Employed in Office & Administration in Simpsonville
9.7%
11.1%
Zip Codes with the Highest Percentage of Population Employed in Office & Administration in Simpsonville, SC
| Zip Code | % Employed | vs State | vs National | |
| 1. | 29680 | 11.1% | 10.7%(+0.427)#154 | 10.9%(+0.223)#13,599 |
| 2. | 29681 | 9.7% | 10.7%(-0.965)#206 | 10.9%(-1.17)#18,122 |
1
Common Questions
What are the Top Zip Codes with the Highest Percentage of Population Employed in Office & Administration in Simpsonville, SC?
Top Zip Codes with the Highest Percentage of Population Employed in Office & Administration in Simpsonville, SC are:
What zip code has the Highest Percentage of Population Employed in Office & Administration in Simpsonville, SC?
29680 has the Highest Percentage of Population Employed in Office & Administration in Simpsonville, SC with 11.1%.
What is the Percentage of Population Employed in Office & Administration in Simpsonville, SC?
Percentage of Population Employed in Office & Administration in Simpsonville is 13.7%.
What is the Percentage of Population Employed in Office & Administration in South Carolina?
Percentage of Population Employed in Office & Administration in South Carolina is 10.7%.
What is the Percentage of Population Employed in Office & Administration in the United States?
Percentage of Population Employed in Office & Administration in the United States is 10.9%.