Zip Codes with the Lowest Percentage of Renter-Occupied Units in North Charleston, SC
RELATED REPORTS & OPTIONS
Lowest Renter-Occupied
North Charleston
Compare Zip Codes
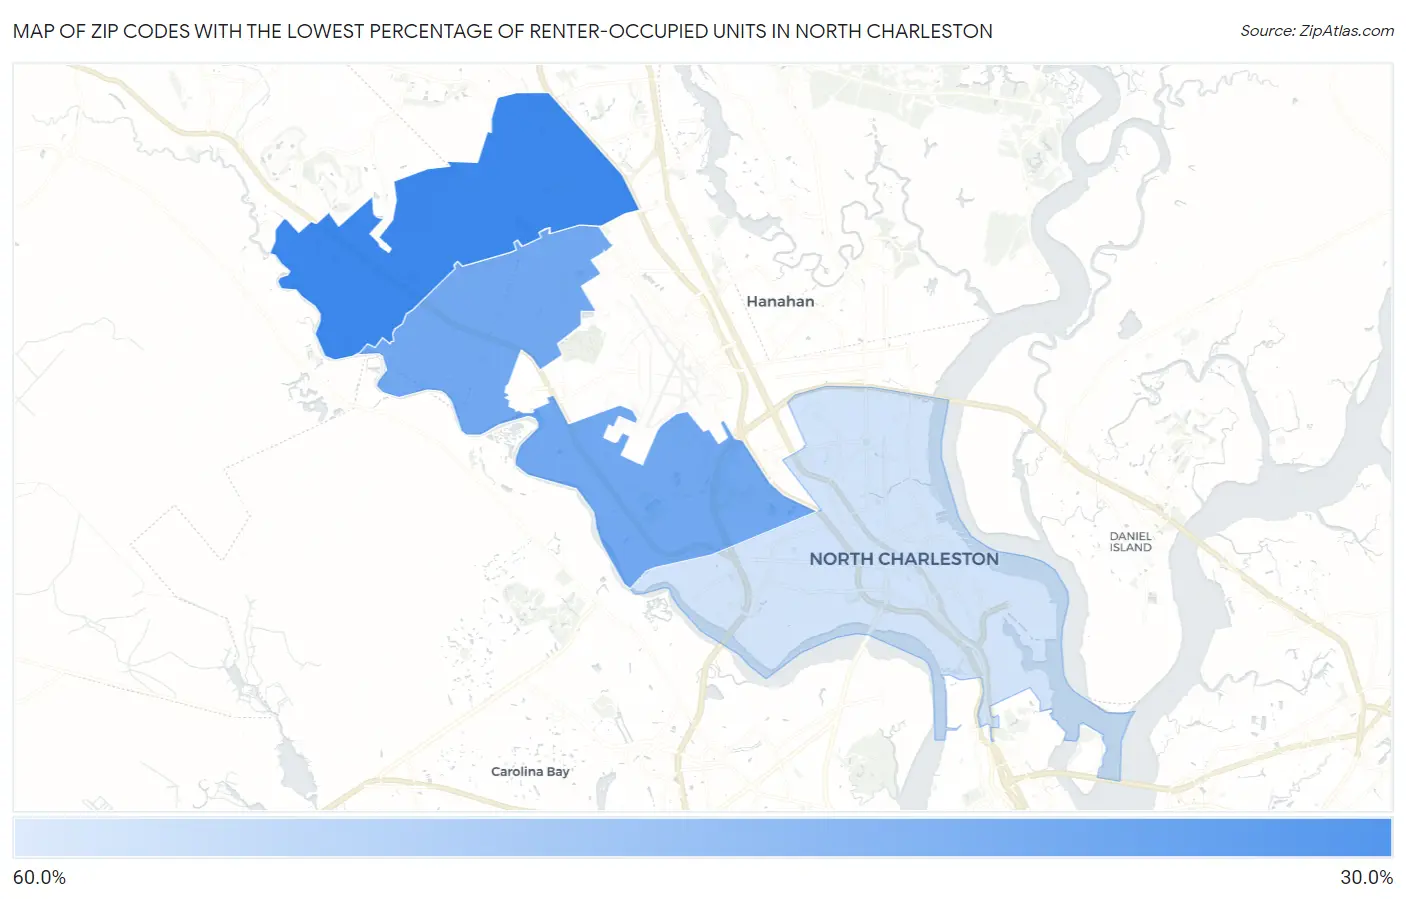
Map of Zip Codes with the Lowest Percentage of Renter-Occupied Units in North Charleston
53.9%
37.9%
Zip Codes with the Lowest Percentage of Renter-Occupied Units in North Charleston, SC
| Zip Code | % Renter-Occupied | vs State | vs National | |
| 1. | 29420 | 37.9% | 29.1%(+8.79)#330 | 35.2%(+2.69)#24,963 |
| 2. | 29418 | 43.4% | 29.1%(+14.3)#354 | 35.2%(+8.19)#26,628 |
| 3. | 29405 | 53.9% | 29.1%(+24.9)#378 | 35.2%(+18.8)#28,619 |
1
Common Questions
What are the Top Zip Codes with the Lowest Percentage of Renter-Occupied Units in North Charleston, SC?
Top Zip Codes with the Lowest Percentage of Renter-Occupied Units in North Charleston, SC are:
What zip code has the Lowest Percentage of Renter-Occupied Units in North Charleston, SC?
29420 has the Lowest Percentage of Renter-Occupied Units in North Charleston, SC with 37.9%.
What is the Percentage of Renter-Occupied Units in North Charleston, SC?
Percentage of Renter-Occupied Units in North Charleston is 50.6%.
What is the Percentage of Renter-Occupied Units in South Carolina?
Percentage of Renter-Occupied Units in South Carolina is 29.1%.
What is the Percentage of Renter-Occupied Units in the United States?
Percentage of Renter-Occupied Units in the United States is 35.2%.