Zip Codes with the Highest Percentage of Families with Income Above $200,000 in Greenwood, SC
RELATED REPORTS & OPTIONS
Family Income | $200k+
Greenwood
Compare Zip Codes
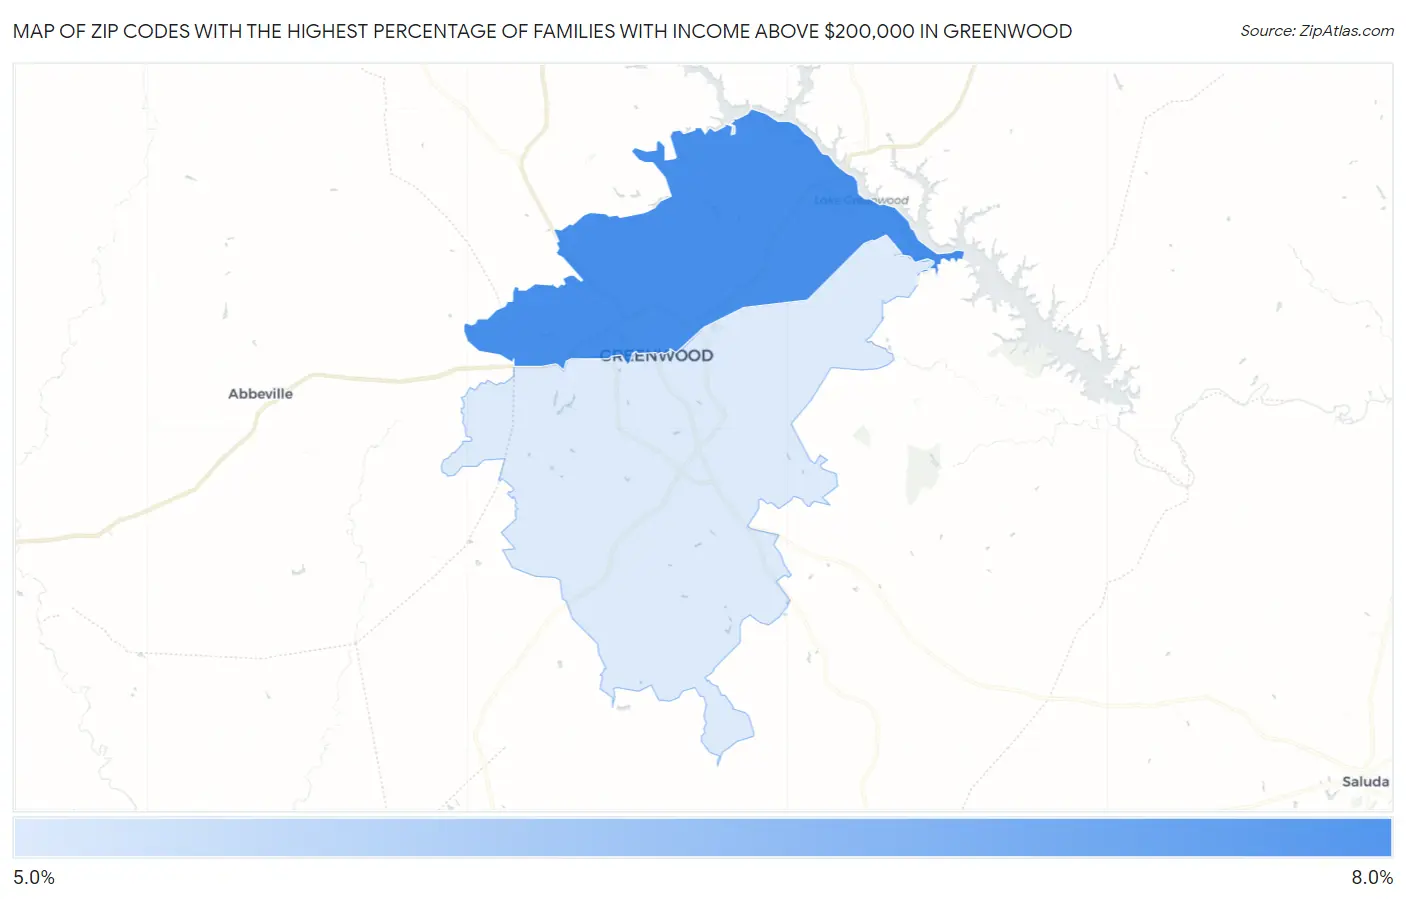
Map of Zip Codes with the Highest Percentage of Families with Income Above $200,000 in Greenwood
5.1%
6.3%
Zip Codes with the Highest Percentage of Families with Income Above $200,000 in Greenwood, SC
| Zip Code | Families with Income > $200k | vs State | vs National | |
| 1. | 29649 | 6.3% | 9.8%(-3.50)#151 | 14.8%(-8.50)#15,882 |
| 2. | 29646 | 5.1% | 9.8%(-4.70)#186 | 14.8%(-9.70)#18,188 |
1
Common Questions
What are the Top Zip Codes with the Highest Percentage of Families with Income Above $200,000 in Greenwood, SC?
Top Zip Codes with the Highest Percentage of Families with Income Above $200,000 in Greenwood, SC are:
What zip code has the Highest Percentage of Families with Income Above $200,000 in Greenwood, SC?
29649 has the Highest Percentage of Families with Income Above $200,000 in Greenwood, SC with 6.3%.
What is the Percentage of Families with Income Above $200,000 in Greenwood, SC?
Percentage of Families with Income Above $200,000 in Greenwood is 2.1%.
What is the Percentage of Families with Income Above $200,000 in South Carolina?
Percentage of Families with Income Above $200,000 in South Carolina is 9.8%.
What is the Percentage of Families with Income Above $200,000 in the United States?
Percentage of Families with Income Above $200,000 in the United States is 14.8%.