Zip Codes with the Highest Percentage of Families with Income Above $200,000 in Greenville, SC

RELATED REPORTS & OPTIONS

Family Income | $200k+
Population
Families and Households
Female Fertility
Female Fertility (Unmarried)
Race (Community Size)
Race (Percentage)
Ancestry (Community Size)
AfricanAlsatianAmericanArabArgentineanArmenianAustralianAustrianBahamianBelgianBhutaneseBlackfeetBolivianBrazilianBritishBritish West IndianBulgarianBurmeseCanadianCentral AmericanCentral American IndianCherokeeChileanChoctawColombianCosta RicanCreekCroatianCubanCzechCzechoslovakianDanishDominicanDutchEastern EuropeanEcuadorianEgyptianEnglishEuropeanFilipinoFinnishFrenchFrench CanadianGermanGhanaianGreekGuatemalanHaitianHonduranHungarianIndian (Asian)IndonesianIranianIraqiIrishIroquoisIsraeliItalianJamaicanKoreanLaotianLatvianLebaneseLiberianLithuanianLumbeeLuxembourgerMexicanMexican American IndianNative HawaiianNicaraguanNigerianNorthern EuropeanNorwegianPakistaniPalestinianPanamanianParaguayanPennsylvania GermanPeruvianPolishPortuguesePotawatomiPuerto RicanRomanianRussianSalvadoranScandinavianScotch-IrishScottishSerbianSiouxSlovakSloveneSouth AfricanSouth AmericanSouth American IndianSpaniardSpanishSri LankanSubsaharan AfricanSwedishSwissSyrianThaiTrinidadian and TobagonianTurkishUkrainianUruguayanVenezuelanWelshWest IndianYugoslavian
Ancestry (Percentage)
AfricanAlsatianAmericanArabArgentineanArmenianAustralianAustrianBahamianBelgianBhutaneseBlackfeetBolivianBrazilianBritishBritish West IndianBulgarianBurmeseCanadianCentral AmericanCentral American IndianCherokeeChileanChoctawColombianCosta RicanCreekCroatianCubanCzechCzechoslovakianDanishDominicanDutchEastern EuropeanEcuadorianEgyptianEnglishEuropeanFilipinoFinnishFrenchFrench CanadianGermanGhanaianGreekGuatemalanHaitianHonduranHungarianIndian (Asian)IndonesianIranianIraqiIrishIroquoisIsraeliItalianJamaicanKoreanLaotianLatvianLebaneseLiberianLithuanianLumbeeLuxembourgerMexicanMexican American IndianNative HawaiianNicaraguanNigerianNorthern EuropeanNorwegianPakistaniPalestinianPanamanianParaguayanPennsylvania GermanPeruvianPolishPortuguesePotawatomiPuerto RicanRomanianRussianSalvadoranScandinavianScotch-IrishScottishSerbianSiouxSlovakSloveneSouth AfricanSouth AmericanSouth American IndianSpaniardSpanishSri LankanSubsaharan AfricanSwedishSwissSyrianThaiTrinidadian and TobagonianTurkishUkrainianUruguayanVenezuelanWelshWest IndianYugoslavian
Immigrant Origin (Total)
Immigrant Origin (Percentage)
Income
Income (Families)
Income (Households)
Poverty
Poverty (Families)
Unemployment
Employment Occupations
Employment Industries
Employer Class
Commute Time
Commute Means
School Enrollment
Education by Degree Field
Occupancy
Finances
Physical Characteristics
Greenville
Compare Zip Codes
Comparison Subject

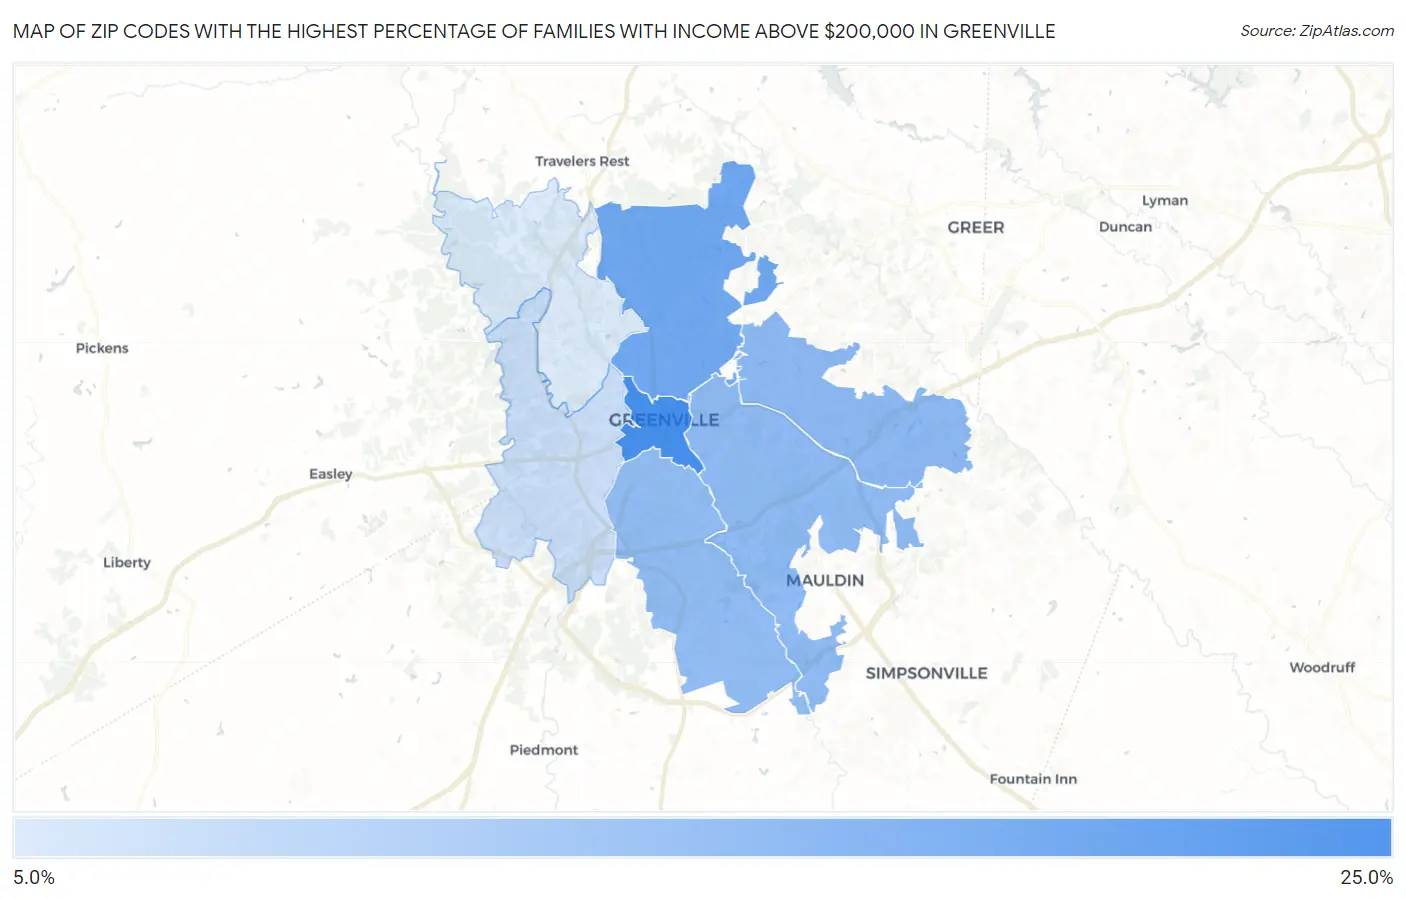
Map of Zip Codes with the Highest Percentage of Families with Income Above $200,000 in Greenville

0.0%
25.0%
Zip Codes with the Highest Percentage of Families with Income Above $200,000 in Greenville Map

Zip Codes with the Highest Percentage of Families with Income Above $200,000 in Greenville, SC

Zip Code Families with Income > $200k vs State vs National
1.2960124.9%9.8%(+15.1)#1514.8%(+10.1)#3,502
2.2960919.4%9.8%(+9.60)#3214.8%(+4.60)#5,006
3.2961515.8%9.8%(+6.00)#4614.8%(+1.000)#6,530
4.2960715.4%9.8%(+5.60)#4914.8%(+0.600)#6,729
5.2960515.0%9.8%(+5.20)#5314.8%(+0.200)#6,977
6.296118.0%9.8%(-1.80)#11914.8%(-6.80)#13,177
7.296175.8%9.8%(-4.00)#16814.8%(-9.00)#16,791

Common Questions

What are the Top 5 Zip Codes with the Highest Percentage of Families with Income Above $200,000 in Greenville, SC?
Top 5 Zip Codes with the Highest Percentage of Families with Income Above $200,000 in Greenville, SC are:
#1
24.9%
#2
19.4%
#3
15.8%
#4
15.4%
#5
15.0%
What zip code has the Highest Percentage of Families with Income Above $200,000 in Greenville, SC?
29601 has the Highest Percentage of Families with Income Above $200,000 in Greenville, SC with 24.9%.
What is the Percentage of Families with Income Above $200,000 in Greenville, SC?
Percentage of Families with Income Above $200,000 in Greenville is 22.0%.
What is the Percentage of Families with Income Above $200,000 in South Carolina?
Percentage of Families with Income Above $200,000 in South Carolina is 9.8%.
What is the Percentage of Families with Income Above $200,000 in the United States?
Percentage of Families with Income Above $200,000 in the United States is 14.8%.