Zip Codes with the Highest Percentage of Population with a Degree in Communications in Charleston, SC

RELATED REPORTS & OPTIONS

Communications
Population
Families and Households
Female Fertility
Female Fertility (Unmarried)
Race (Community Size)
Race (Percentage)
Ancestry (Community Size)
AfricanAlbanianAlsatianAmericanArabArgentineanArmenianAustralianAustrianBahamianBelgianBhutaneseBlackfeetBolivianBrazilianBritishBurmeseCajunCanadianCelticCentral AmericanCentral American IndianCherokeeChippewaColombianCosta RicanCreekCroatianCubanCzechCzechoslovakianDanishDominicanDutchEastern EuropeanEcuadorianEgyptianEnglishEstonianEuropeanFilipinoFinnishFrenchFrench CanadianGermanGhanaianGreekGuamanian / ChamorroGuatemalanHaitianHonduranHungarianIndian (Asian)IndonesianIranianIrishIsraeliItalianJamaicanJordanianKoreanLatvianLebaneseLithuanianMalaysianMexicanMexican American IndianNative HawaiianNicaraguanNigerianNorthern EuropeanNorwegianPakistaniPanamanianPennsylvania GermanPeruvianPolishPortuguesePuerto RicanRomanianRussianSalvadoranScandinavianScotch-IrishScottishSerbianSiouxSlavicSlovakSloveneSouth AfricanSouth AmericanSpaniardSpanishSri LankanSubsaharan AfricanSwedishSwissSyrianThaiTrinidadian and TobagonianTurkishUkrainianVenezuelanWelshWest IndianYugoslavianYup'ik
Ancestry (Percentage)
AfricanAlbanianAlsatianAmericanArabArgentineanArmenianAustralianAustrianBahamianBelgianBhutaneseBlackfeetBolivianBrazilianBritishBurmeseCajunCanadianCelticCentral AmericanCentral American IndianCherokeeChippewaColombianCosta RicanCreekCroatianCubanCzechCzechoslovakianDanishDominicanDutchEastern EuropeanEcuadorianEgyptianEnglishEstonianEuropeanFilipinoFinnishFrenchFrench CanadianGermanGhanaianGreekGuamanian / ChamorroGuatemalanHaitianHonduranHungarianIndian (Asian)IndonesianIranianIrishIsraeliItalianJamaicanJordanianKoreanLatvianLebaneseLithuanianMalaysianMexicanMexican American IndianNative HawaiianNicaraguanNigerianNorthern EuropeanNorwegianPakistaniPanamanianPennsylvania GermanPeruvianPolishPortuguesePuerto RicanRomanianRussianSalvadoranScandinavianScotch-IrishScottishSerbianSiouxSlavicSlovakSloveneSouth AfricanSouth AmericanSpaniardSpanishSri LankanSubsaharan AfricanSwedishSwissSyrianThaiTrinidadian and TobagonianTurkishUkrainianVenezuelanWelshWest IndianYugoslavianYup'ik
Immigrant Origin (Total)
Immigrant Origin (Percentage)
Income
Income (Families)
Income (Households)
Poverty
Poverty (Families)
Unemployment
Employment Occupations
Employment Industries
Employer Class
Commute Time
Commute Means
School Enrollment
Education by Degree Field
Occupancy
Finances
Physical Characteristics
Charleston
Compare Zip Codes
Comparison Subject

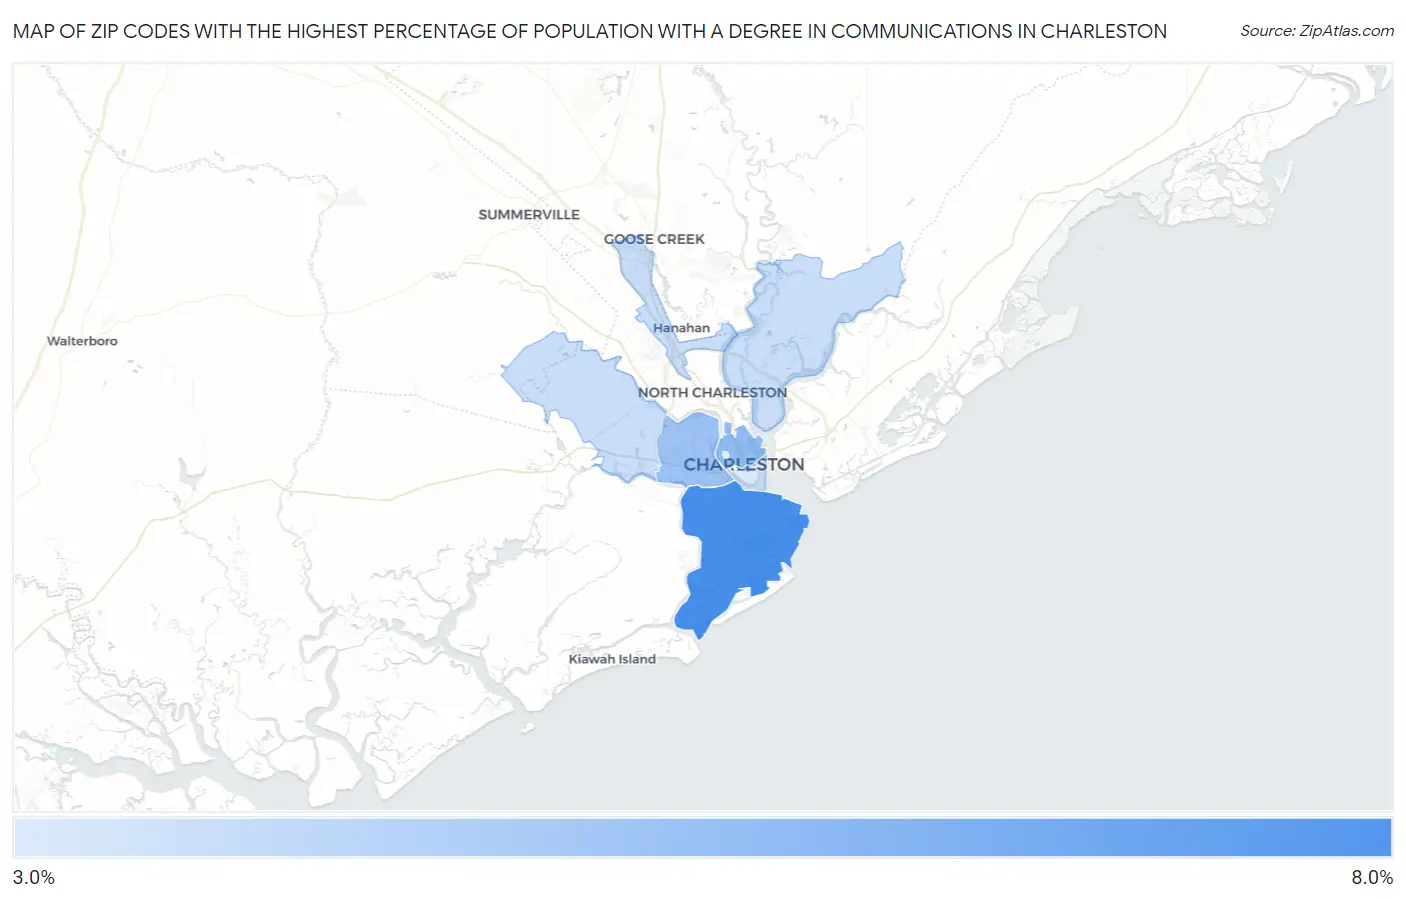
Map of Zip Codes with the Highest Percentage of Population with a Degree in Communications in Charleston

0.0%
8.0%
Zip Codes with the Highest Percentage of Population with a Degree in Communications in Charleston Map

Zip Codes with the Highest Percentage of Population with a Degree in Communications in Charleston, SC

Zip Code % Graduates vs State vs National
1.294126.3%3.3%(+3.00)#264.1%(+2.17)#3,352
2.294034.8%3.3%(+1.48)#494.1%(+0.650)#6,211
3.294074.5%3.3%(+1.21)#604.1%(+0.376)#6,929
4.294063.6%3.3%(+0.346)#874.1%(-0.486)#9,808
5.294143.6%3.3%(+0.329)#894.1%(-0.502)#9,862
6.294923.6%3.3%(+0.315)#904.1%(-0.517)#9,898
7.294013.2%3.3%(-0.096)#1124.1%(-0.927)#11,430

Common Questions

What are the Top 5 Zip Codes with the Highest Percentage of Population with a Degree in Communications in Charleston, SC?
Top 5 Zip Codes with the Highest Percentage of Population with a Degree in Communications in Charleston, SC are:
#1
6.3%
#2
4.8%
#3
4.5%
#4
3.6%
#5
3.6%
What zip code has the Highest Percentage of Population with a Degree in Communications in Charleston, SC?
29412 has the Highest Percentage of Population with a Degree in Communications in Charleston, SC with 6.3%.
What is the Percentage of Population with a Degree in Communications in Charleston, SC?
Percentage of Population with a Degree in Communications in Charleston is 4.6%.
What is the Percentage of Population with a Degree in Communications in South Carolina?
Percentage of Population with a Degree in Communications in South Carolina is 3.3%.
What is the Percentage of Population with a Degree in Communications in the United States?
Percentage of Population with a Degree in Communications in the United States is 4.1%.