Zip Codes with the Highest Percentage of Local Government Employees in Beaufort, SC
RELATED REPORTS & OPTIONS
Local Government Employees
Beaufort
Compare Zip Codes
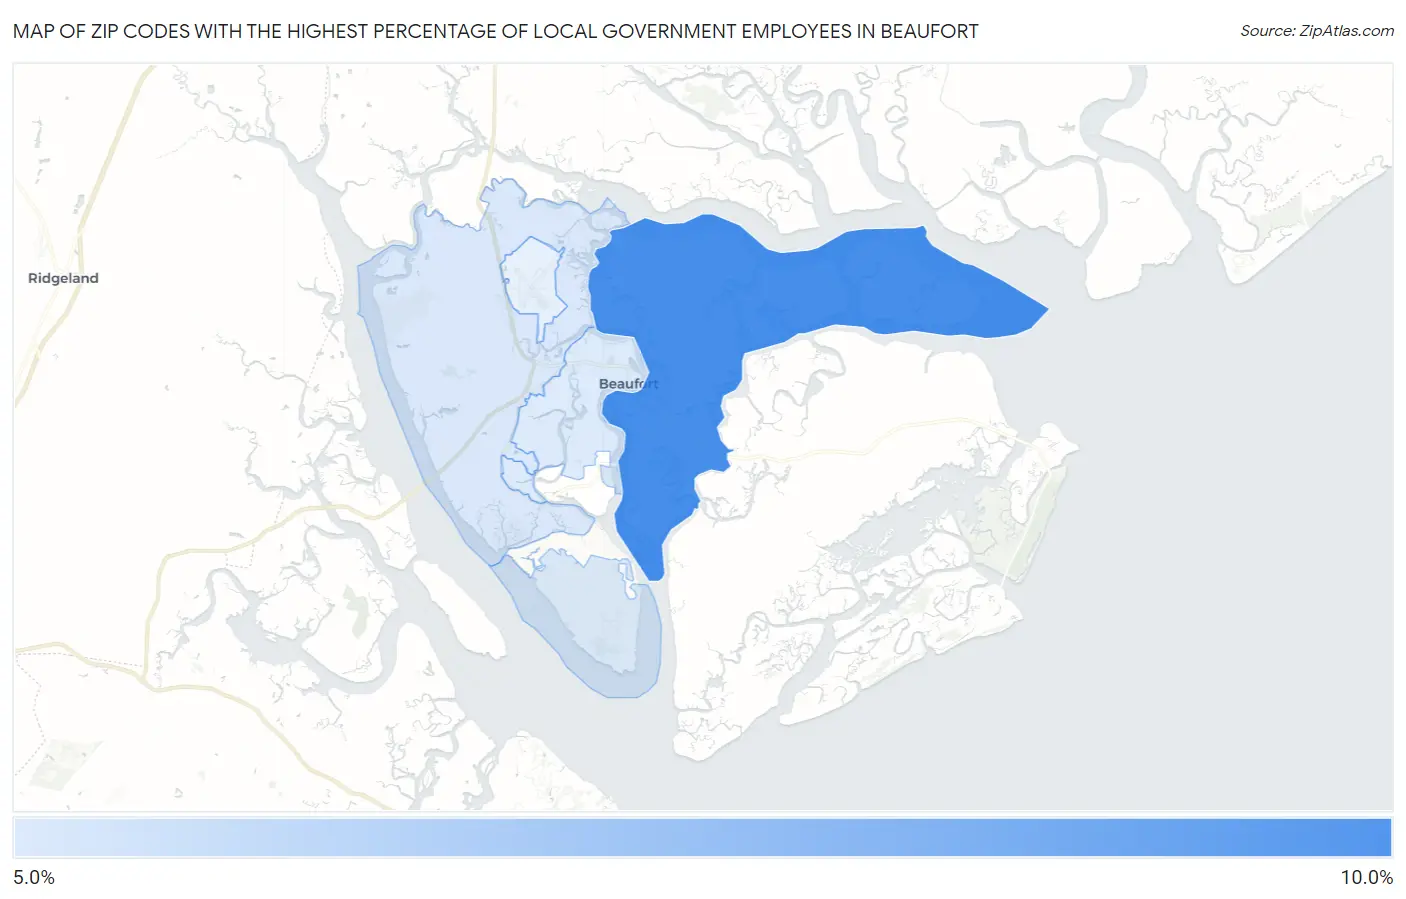
Map of Zip Codes with the Highest Percentage of Local Government Employees in Beaufort
5.2%
8.3%
Zip Codes with the Highest Percentage of Local Government Employees in Beaufort, SC
| Zip Code | % Local Government Employees | vs State | vs National | |
| 1. | 29907 | 8.3% | 6.4%(+1.90)#114 | 7.2%(+1.02)#12,481 |
| 2. | 29906 | 5.2% | 6.4%(-1.16)#266 | 7.2%(-2.04)#22,465 |
| 3. | 29902 | 5.2% | 6.4%(-1.19)#267 | 7.2%(-2.06)#22,550 |
1
Common Questions
What are the Top 3 Zip Codes with the Highest Percentage of Local Government Employees in Beaufort, SC?
Top 3 Zip Codes with the Highest Percentage of Local Government Employees in Beaufort, SC are:
What zip code has the Highest Percentage of Local Government Employees in Beaufort, SC?
29907 has the Highest Percentage of Local Government Employees in Beaufort, SC with 8.3%.
What is the Percentage of Local Government Employees in Beaufort, SC?
Percentage of Local Government Employees in Beaufort is 6.0%.
What is the Percentage of Local Government Employees in South Carolina?
Percentage of Local Government Employees in South Carolina is 6.4%.
What is the Percentage of Local Government Employees in the United States?
Percentage of Local Government Employees in the United States is 7.2%.