Zimbabwean vs Immigrants from Philippines Family Poverty
COMPARE
Zimbabwean
Immigrants from Philippines
Family Poverty
Family Poverty Comparison
Zimbabweans
Immigrants from Philippines
7.8%
FAMILY POVERTY
98.4/ 100
METRIC RATING
63rd/ 347
METRIC RANK
8.0%
FAMILY POVERTY
96.5/ 100
METRIC RATING
95th/ 347
METRIC RANK
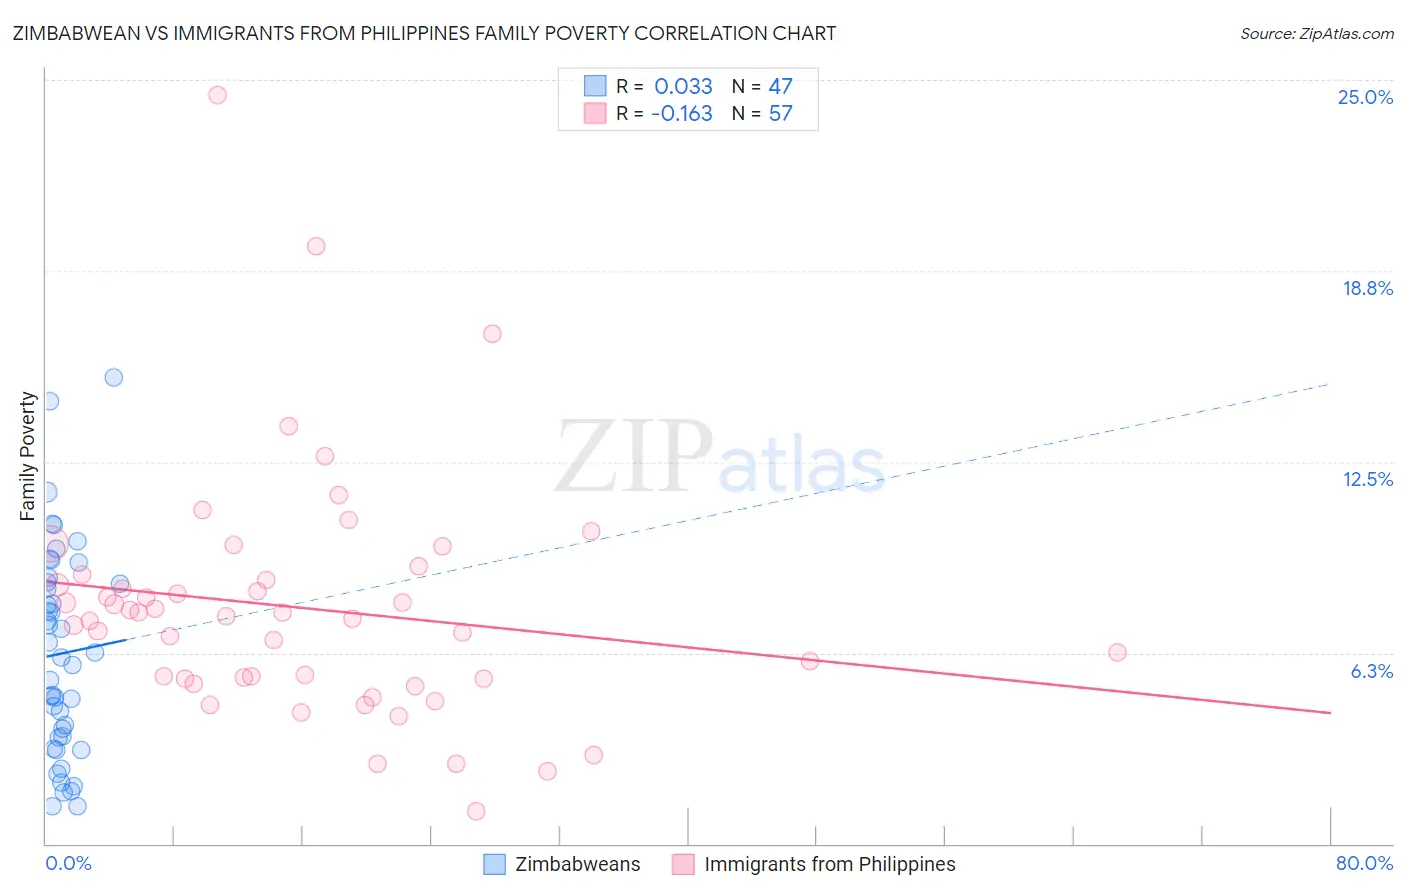
Zimbabwean vs Immigrants from Philippines Family Poverty Correlation Chart
The statistical analysis conducted on geographies consisting of 69,162,841 people shows no correlation between the proportion of Zimbabweans and poverty level among families in the United States with a correlation coefficient (R) of 0.033 and weighted average of 7.8%. Similarly, the statistical analysis conducted on geographies consisting of 469,729,486 people shows a poor negative correlation between the proportion of Immigrants from Philippines and poverty level among families in the United States with a correlation coefficient (R) of -0.163 and weighted average of 8.0%, a difference of 2.9%.
Family Poverty Correlation Summary
| Measurement | Zimbabwean | Immigrants from Philippines |
| Minimum | 1.2% | 1.1% |
| Maximum | 15.3% | 24.5% |
| Range | 14.0% | 23.5% |
| Mean | 6.2% | 7.7% |
| Median | 6.1% | 7.4% |
| Interquartile 25% (IQ1) | 3.5% | 5.4% |
| Interquartile 75% (IQ3) | 8.6% | 8.7% |
| Interquartile Range (IQR) | 5.1% | 3.3% |
| Standard Deviation (Sample) | 3.4% | 4.0% |
| Standard Deviation (Population) | 3.4% | 3.9% |
Similar Demographics by Family Poverty
Demographics Similar to Zimbabweans by Family Poverty
In terms of family poverty, the demographic groups most similar to Zimbabweans are Korean (7.8%, a difference of 0.15%), Immigrants from Bulgaria (7.8%, a difference of 0.16%), Dutch (7.8%, a difference of 0.22%), Northern European (7.8%, a difference of 0.23%), and Australian (7.8%, a difference of 0.27%).
| Demographics | Rating | Rank | Family Poverty |
| Immigrants | Serbia | 98.7 /100 | #56 | Exceptional 7.7% |
| Asians | 98.7 /100 | #57 | Exceptional 7.7% |
| Finns | 98.7 /100 | #58 | Exceptional 7.7% |
| Europeans | 98.7 /100 | #59 | Exceptional 7.7% |
| Immigrants | Greece | 98.7 /100 | #60 | Exceptional 7.7% |
| Immigrants | Netherlands | 98.6 /100 | #61 | Exceptional 7.7% |
| Macedonians | 98.6 /100 | #62 | Exceptional 7.8% |
| Zimbabweans | 98.4 /100 | #63 | Exceptional 7.8% |
| Koreans | 98.3 /100 | #64 | Exceptional 7.8% |
| Immigrants | Bulgaria | 98.3 /100 | #65 | Exceptional 7.8% |
| Dutch | 98.3 /100 | #66 | Exceptional 7.8% |
| Northern Europeans | 98.3 /100 | #67 | Exceptional 7.8% |
| Australians | 98.2 /100 | #68 | Exceptional 7.8% |
| Immigrants | Belgium | 98.2 /100 | #69 | Exceptional 7.8% |
| Immigrants | Canada | 98.2 /100 | #70 | Exceptional 7.8% |
Demographics Similar to Immigrants from Philippines by Family Poverty
In terms of family poverty, the demographic groups most similar to Immigrants from Philippines are Immigrants from Pakistan (8.0%, a difference of 0.010%), Immigrants from Turkey (8.0%, a difference of 0.020%), Tlingit-Haida (8.0%, a difference of 0.12%), Czechoslovakian (8.0%, a difference of 0.30%), and Immigrants from Switzerland (8.1%, a difference of 0.43%).
| Demographics | Rating | Rank | Family Poverty |
| Serbians | 97.2 /100 | #88 | Exceptional 8.0% |
| Immigrants | Denmark | 97.1 /100 | #89 | Exceptional 8.0% |
| Immigrants | England | 97.1 /100 | #90 | Exceptional 8.0% |
| Immigrants | Italy | 97.0 /100 | #91 | Exceptional 8.0% |
| Czechoslovakians | 96.8 /100 | #92 | Exceptional 8.0% |
| Tlingit-Haida | 96.7 /100 | #93 | Exceptional 8.0% |
| Immigrants | Pakistan | 96.6 /100 | #94 | Exceptional 8.0% |
| Immigrants | Philippines | 96.5 /100 | #95 | Exceptional 8.0% |
| Immigrants | Turkey | 96.5 /100 | #96 | Exceptional 8.0% |
| Immigrants | Switzerland | 96.1 /100 | #97 | Exceptional 8.1% |
| Immigrants | South Africa | 95.9 /100 | #98 | Exceptional 8.1% |
| Welsh | 95.8 /100 | #99 | Exceptional 8.1% |
| New Zealanders | 95.8 /100 | #100 | Exceptional 8.1% |
| Immigrants | Norway | 95.7 /100 | #101 | Exceptional 8.1% |
| Immigrants | Indonesia | 95.7 /100 | #102 | Exceptional 8.1% |