Zimbabwean vs Immigrants from Philippines Disability Age 65 to 74
COMPARE
Zimbabwean
Immigrants from Philippines
Disability Age 65 to 74
Disability Age 65 to 74 Comparison
Zimbabweans
Immigrants from Philippines
21.5%
DISABILITY AGE 65 TO 74
99.5/ 100
METRIC RATING
59th/ 347
METRIC RANK
23.2%
DISABILITY AGE 65 TO 74
61.1/ 100
METRIC RATING
163rd/ 347
METRIC RANK
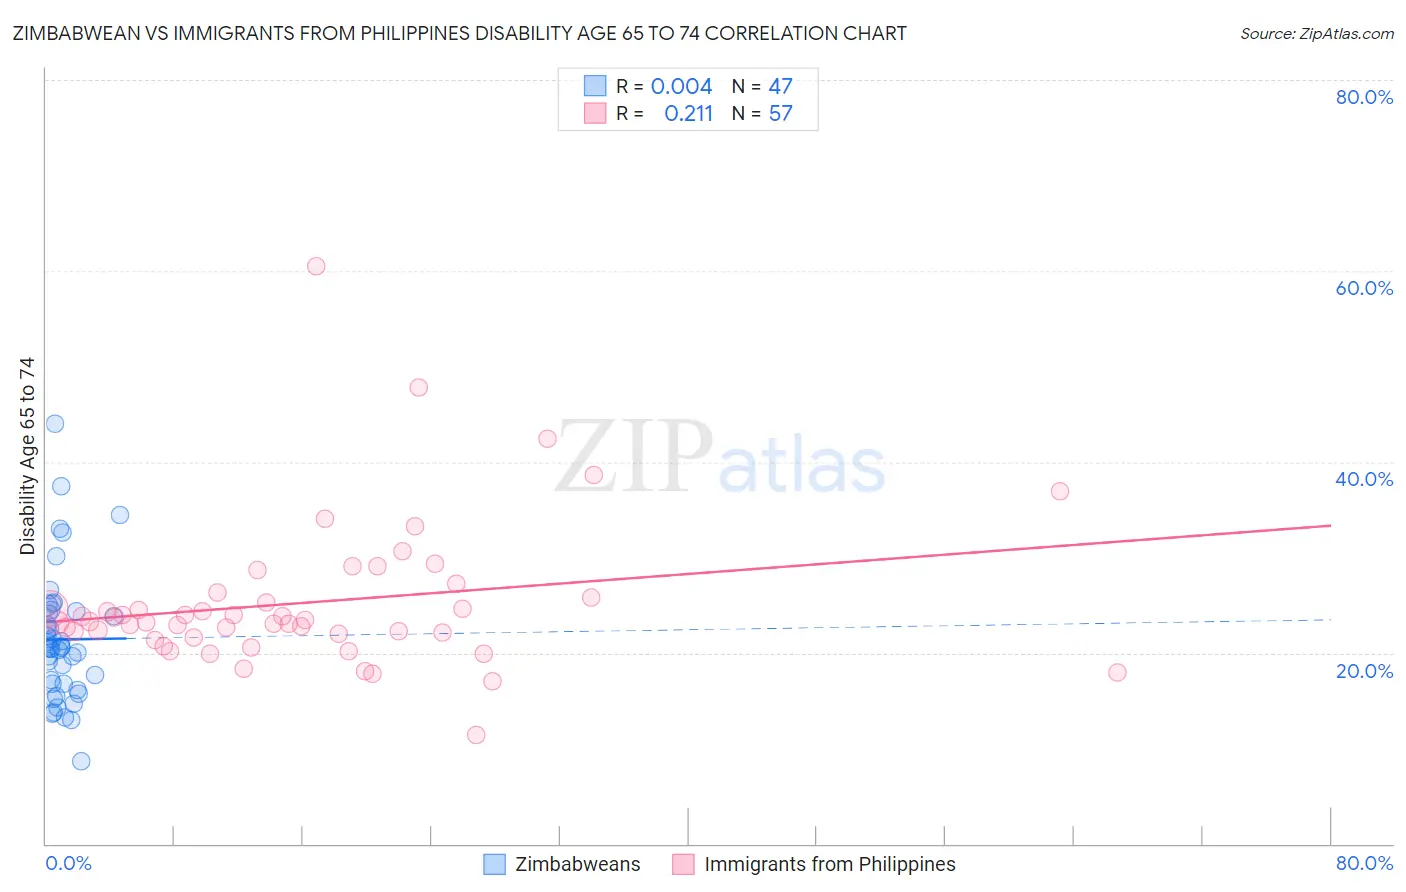
Zimbabwean vs Immigrants from Philippines Disability Age 65 to 74 Correlation Chart
The statistical analysis conducted on geographies consisting of 69,127,978 people shows no correlation between the proportion of Zimbabweans and percentage of population with a disability between the ages 65 and 75 in the United States with a correlation coefficient (R) of 0.004 and weighted average of 21.5%. Similarly, the statistical analysis conducted on geographies consisting of 470,156,643 people shows a weak positive correlation between the proportion of Immigrants from Philippines and percentage of population with a disability between the ages 65 and 75 in the United States with a correlation coefficient (R) of 0.211 and weighted average of 23.2%, a difference of 7.6%.
Disability Age 65 to 74 Correlation Summary
| Measurement | Zimbabwean | Immigrants from Philippines |
| Minimum | 8.6% | 11.4% |
| Maximum | 44.0% | 60.5% |
| Range | 35.4% | 49.1% |
| Mean | 21.4% | 25.3% |
| Median | 20.5% | 23.3% |
| Interquartile 25% (IQ1) | 16.7% | 21.8% |
| Interquartile 75% (IQ3) | 24.4% | 26.1% |
| Interquartile Range (IQR) | 7.7% | 4.3% |
| Standard Deviation (Sample) | 6.8% | 7.7% |
| Standard Deviation (Population) | 6.7% | 7.7% |
Similar Demographics by Disability Age 65 to 74
Demographics Similar to Zimbabweans by Disability Age 65 to 74
In terms of disability age 65 to 74, the demographic groups most similar to Zimbabweans are Immigrants from Pakistan (21.5%, a difference of 0.030%), Immigrants from North Macedonia (21.6%, a difference of 0.030%), Egyptian (21.6%, a difference of 0.050%), Immigrants from Asia (21.5%, a difference of 0.070%), and Carpatho Rusyn (21.6%, a difference of 0.080%).
| Demographics | Rating | Rank | Disability Age 65 to 74 |
| Immigrants | France | 99.6 /100 | #52 | Exceptional 21.5% |
| Bhutanese | 99.6 /100 | #53 | Exceptional 21.5% |
| Immigrants | Italy | 99.6 /100 | #54 | Exceptional 21.5% |
| Immigrants | Romania | 99.5 /100 | #55 | Exceptional 21.5% |
| Immigrants | Denmark | 99.5 /100 | #56 | Exceptional 21.5% |
| Immigrants | Asia | 99.5 /100 | #57 | Exceptional 21.5% |
| Immigrants | Pakistan | 99.5 /100 | #58 | Exceptional 21.5% |
| Zimbabweans | 99.5 /100 | #59 | Exceptional 21.5% |
| Immigrants | North Macedonia | 99.5 /100 | #60 | Exceptional 21.6% |
| Egyptians | 99.5 /100 | #61 | Exceptional 21.6% |
| Carpatho Rusyns | 99.5 /100 | #62 | Exceptional 21.6% |
| Immigrants | Europe | 99.4 /100 | #63 | Exceptional 21.6% |
| Immigrants | Latvia | 99.4 /100 | #64 | Exceptional 21.6% |
| Immigrants | Russia | 99.4 /100 | #65 | Exceptional 21.6% |
| Maltese | 99.4 /100 | #66 | Exceptional 21.6% |
Demographics Similar to Immigrants from Philippines by Disability Age 65 to 74
In terms of disability age 65 to 74, the demographic groups most similar to Immigrants from Philippines are European (23.2%, a difference of 0.0%), Sierra Leonean (23.2%, a difference of 0.010%), Vietnamese (23.2%, a difference of 0.020%), Immigrants from Afghanistan (23.2%, a difference of 0.040%), and Immigrants from Cameroon (23.1%, a difference of 0.16%).
| Demographics | Rating | Rank | Disability Age 65 to 74 |
| Immigrants | Western Asia | 73.8 /100 | #156 | Good 23.0% |
| Czechoslovakians | 72.4 /100 | #157 | Good 23.0% |
| Immigrants | Vietnam | 69.1 /100 | #158 | Good 23.1% |
| South American Indians | 65.5 /100 | #159 | Good 23.1% |
| Koreans | 64.2 /100 | #160 | Good 23.1% |
| Immigrants | Cameroon | 63.8 /100 | #161 | Good 23.1% |
| Europeans | 61.2 /100 | #162 | Good 23.2% |
| Immigrants | Philippines | 61.1 /100 | #163 | Good 23.2% |
| Sierra Leoneans | 60.9 /100 | #164 | Good 23.2% |
| Vietnamese | 60.8 /100 | #165 | Good 23.2% |
| Immigrants | Afghanistan | 60.5 /100 | #166 | Good 23.2% |
| Immigrants | Bosnia and Herzegovina | 57.6 /100 | #167 | Average 23.2% |
| Pakistanis | 57.0 /100 | #168 | Average 23.2% |
| Icelanders | 54.3 /100 | #169 | Average 23.3% |
| Moroccans | 54.2 /100 | #170 | Average 23.3% |