Yugoslavian vs Immigrants from St. Vincent and the Grenadines Female Poverty Among 18-24 Year Olds
COMPARE
Yugoslavian
Immigrants from St. Vincent and the Grenadines
Female Poverty Among 18-24 Year Olds
Female Poverty Among 18-24 Year Olds Comparison
Yugoslavians
Immigrants from St. Vincent and the Grenadines
19.8%
FEMALE POVERTY AMONG 18-24 YEAR OLDS
79.0/ 100
METRIC RATING
152nd/ 347
METRIC RANK
20.8%
FEMALE POVERTY AMONG 18-24 YEAR OLDS
6.0/ 100
METRIC RATING
231st/ 347
METRIC RANK
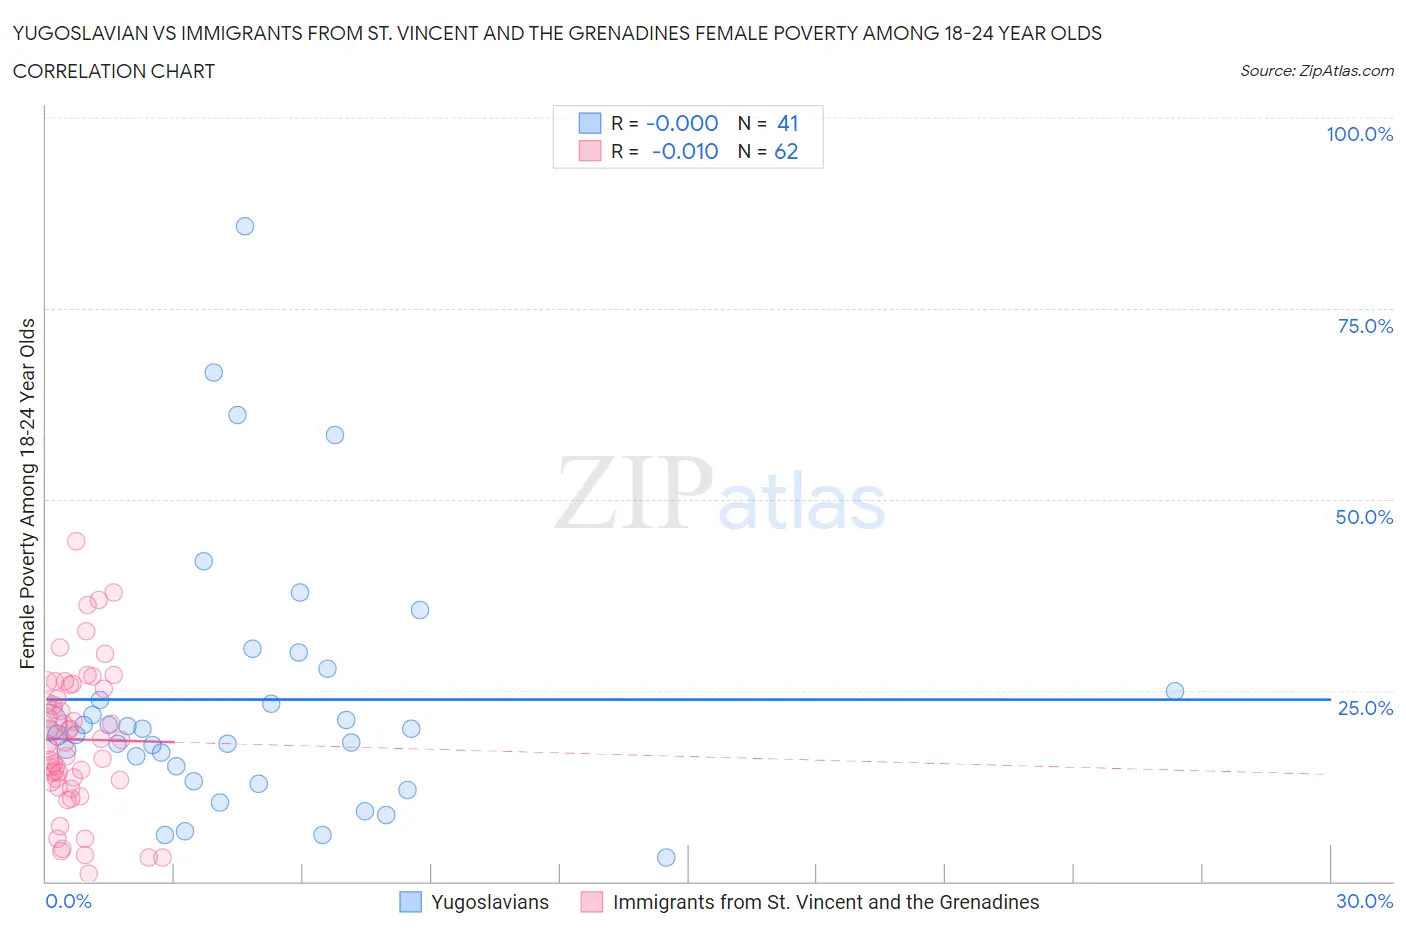
Yugoslavian vs Immigrants from St. Vincent and the Grenadines Female Poverty Among 18-24 Year Olds Correlation Chart
The statistical analysis conducted on geographies consisting of 280,461,515 people shows no correlation between the proportion of Yugoslavians and poverty level among females between the ages 18 and 24 in the United States with a correlation coefficient (R) of -0.000 and weighted average of 19.8%. Similarly, the statistical analysis conducted on geographies consisting of 56,017,716 people shows no correlation between the proportion of Immigrants from St. Vincent and the Grenadines and poverty level among females between the ages 18 and 24 in the United States with a correlation coefficient (R) of -0.010 and weighted average of 20.8%, a difference of 5.1%.
Female Poverty Among 18-24 Year Olds Correlation Summary
| Measurement | Yugoslavian | Immigrants from St. Vincent and the Grenadines |
| Minimum | 3.2% | 0.92% |
| Maximum | 85.7% | 44.4% |
| Range | 82.5% | 43.5% |
| Mean | 23.8% | 18.6% |
| Median | 20.0% | 18.3% |
| Interquartile 25% (IQ1) | 14.1% | 13.3% |
| Interquartile 75% (IQ3) | 26.3% | 25.2% |
| Interquartile Range (IQR) | 12.2% | 12.0% |
| Standard Deviation (Sample) | 17.2% | 9.2% |
| Standard Deviation (Population) | 17.0% | 9.2% |
Similar Demographics by Female Poverty Among 18-24 Year Olds
Demographics Similar to Yugoslavians by Female Poverty Among 18-24 Year Olds
In terms of female poverty among 18-24 year olds, the demographic groups most similar to Yugoslavians are Immigrants from Eastern Asia (19.8%, a difference of 0.050%), Immigrants from Japan (19.8%, a difference of 0.060%), Syrian (19.8%, a difference of 0.090%), Immigrants from Oceania (19.7%, a difference of 0.17%), and Immigrants from Zimbabwe (19.8%, a difference of 0.17%).
| Demographics | Rating | Rank | Female Poverty Among 18-24 Year Olds |
| Canadians | 83.8 /100 | #145 | Excellent 19.7% |
| Immigrants | Bosnia and Herzegovina | 83.6 /100 | #146 | Excellent 19.7% |
| Immigrants | Austria | 83.1 /100 | #147 | Excellent 19.7% |
| Immigrants | Latin America | 81.3 /100 | #148 | Excellent 19.7% |
| Immigrants | Oceania | 81.2 /100 | #149 | Excellent 19.7% |
| Syrians | 80.2 /100 | #150 | Excellent 19.8% |
| Immigrants | Eastern Asia | 79.7 /100 | #151 | Good 19.8% |
| Yugoslavians | 79.0 /100 | #152 | Good 19.8% |
| Immigrants | Japan | 78.1 /100 | #153 | Good 19.8% |
| Immigrants | Zimbabwe | 76.7 /100 | #154 | Good 19.8% |
| Hungarians | 76.6 /100 | #155 | Good 19.8% |
| Immigrants | Belgium | 76.4 /100 | #156 | Good 19.8% |
| Danes | 75.5 /100 | #157 | Good 19.8% |
| Immigrants | Lebanon | 75.3 /100 | #158 | Good 19.8% |
| Trinidadians and Tobagonians | 74.4 /100 | #159 | Good 19.8% |
Demographics Similar to Immigrants from St. Vincent and the Grenadines by Female Poverty Among 18-24 Year Olds
In terms of female poverty among 18-24 year olds, the demographic groups most similar to Immigrants from St. Vincent and the Grenadines are Finnish (20.8%, a difference of 0.0%), White/Caucasian (20.8%, a difference of 0.020%), Australian (20.8%, a difference of 0.030%), Immigrants from Denmark (20.8%, a difference of 0.040%), and Ghanaian (20.8%, a difference of 0.090%).
| Demographics | Rating | Rank | Female Poverty Among 18-24 Year Olds |
| Immigrants | Liberia | 7.6 /100 | #224 | Tragic 20.7% |
| Norwegians | 7.3 /100 | #225 | Tragic 20.7% |
| Estonians | 7.2 /100 | #226 | Tragic 20.7% |
| Immigrants | Sweden | 6.8 /100 | #227 | Tragic 20.7% |
| Ghanaians | 6.5 /100 | #228 | Tragic 20.8% |
| Australians | 6.1 /100 | #229 | Tragic 20.8% |
| Whites/Caucasians | 6.1 /100 | #230 | Tragic 20.8% |
| Immigrants | St. Vincent and the Grenadines | 6.0 /100 | #231 | Tragic 20.8% |
| Finns | 6.0 /100 | #232 | Tragic 20.8% |
| Immigrants | Denmark | 5.8 /100 | #233 | Tragic 20.8% |
| Welsh | 5.4 /100 | #234 | Tragic 20.8% |
| Immigrants | Uganda | 5.1 /100 | #235 | Tragic 20.8% |
| Okinawans | 4.9 /100 | #236 | Tragic 20.8% |
| Scottish | 4.5 /100 | #237 | Tragic 20.9% |
| Immigrants | Singapore | 4.4 /100 | #238 | Tragic 20.9% |