Asian vs Immigrants from St. Vincent and the Grenadines Female Poverty Among 18-24 Year Olds

COMPARE

Asian
Race
Ancestry
AfghanAfricanAlaska NativeAlaskan AthabascanAlbanianAleutAlsatianAmericanApacheArabArapahoArgentineanArmenianAssyrian/Chaldean/SyriacAustralianAustrianBahamianBangladeshiBarbadianBasqueBelgianBelizeanBermudanBhutaneseBlackfeetBolivianBrazilianBritishBritish West IndianBulgarianBurmeseCajunCambodianCanadianCape VerdeanCarpatho RusynCelticCentral AmericanCentral American IndianCherokeeCheyenneChickasawChileanChineseChippewaChoctawColombianColvilleComancheCosta RicanCreeCreekCroatianCrowCubanCypriotCzechCzechoslovakianDanishDelawareDominicanDutchDutch West IndianEastern EuropeanEcuadorianEgyptianEnglishEstonianEthiopianEuropeanFijianFilipinoFinnishFrenchFrench American IndianFrench CanadianGermanGerman RussianGhanaianGreekGuamanian/ChamorroGuatemalanGuyaneseHaitianHmongHonduranHopiHoumaHungarianIcelanderIndian (Asian)IndonesianInupiatIranianIraqiIrishIroquoisIsraeliItalianJamaicanJapaneseJordanianKenyanKiowaKoreanLaotianLatvianLebaneseLiberianLithuanianLumbeeLuxembourgerMacedonianMalaysianMalteseMarshalleseMenomineeMexicanMexican American IndianMongolianMoroccanNative HawaiianNavajoNepaleseNew ZealanderNicaraguanNigerianNorthern EuropeanNorwegianOkinawanOsageOttawaPaiutePakistaniPalestinianPanamanianParaguayanPennsylvania GermanPeruvianPimaPolishPortuguesePotawatomiPuebloPuerto RicanPuget Sound SalishRomanianRussianSalvadoranSamoanScandinavianScotch-IrishScottishSeminoleSenegaleseSerbianShoshoneSierra LeoneanSiouxSlavicSlovakSloveneSomaliSouth AfricanSouth AmericanSouth American IndianSoviet UnionSpaniardSpanishSpanish AmericanSpanish American IndianSri LankanSubsaharan AfricanSudaneseSwedishSwissSyrianTaiwaneseThaiTlingit-HaidaTohono O'OdhamTonganTrinidadian and TobagonianTsimshianTurkishU.S. Virgin IslanderUgandanUkrainianUruguayanUteVenezuelanVietnameseWelshWest IndianYakamaYaquiYugoslavianYumanYup'ikZimbabwean
Immigration
NonimmigrantsImmigrantsAfghanistanAfricaAlbaniaArgentinaArmeniaAsiaAustraliaAustriaBahamasBangladeshBarbadosBelarusBelgiumBelizeBoliviaBosnia and HerzegovinaBrazilBulgariaBurma/MyanmarCabo VerdeCambodiaCameroonCanadaCaribbeanCentral AmericaChileChinaColombiaCongoCosta RicaCroatiaCubaCzechoslovakiaDenmarkDominicaDominican RepublicEastern AfricaEastern AsiaEastern EuropeEcuadorEgyptEl SalvadorEnglandEritreaEthiopiaEuropeFijiFranceGermanyGhanaGreeceGrenadaGuatemalaGuyanaHaitiHondurasHong KongHungaryIndiaIndonesiaIranIraqIrelandIsraelItalyJamaicaJapanJordanKazakhstanKenyaKoreaKuwaitLaosLatin AmericaLatviaLebanonLiberiaLithuaniaMalaysiaMexicoMicronesiaMiddle AfricaMoldovaMoroccoNepalNetherlandsNicaraguaNigeriaNorth AmericaNorth MacedoniaNorthern AfricaNorthern EuropeNorwayOceaniaPakistanPanamaPeruPhilippinesPolandPortugalRomaniaRussiaSaudi ArabiaScotlandSenegalSerbiaSierra LeoneSingaporeSomaliaSouth AfricaSouth AmericaSouth Central AsiaSouth Eastern AsiaSouthern EuropeSpainSri LankaSudanSwedenSwitzerlandSyriaTaiwanThailandTrinidad and TobagoTurkeyUgandaUkraineUruguayUzbekistanVenezuelaVietnamWest IndiesWestern AfricaWestern AsiaWestern EuropeYemenZaireZimbabweAzores
Immigrants from St. Vincent and the Grenadines
Race
Ancestry
AfghanAfricanAlaska NativeAlaskan AthabascanAlbanianAleutAlsatianAmericanApacheArabArapahoArgentineanArmenianAssyrian/Chaldean/SyriacAustralianAustrianBahamianBangladeshiBarbadianBasqueBelgianBelizeanBermudanBhutaneseBlackfeetBolivianBrazilianBritishBritish West IndianBulgarianBurmeseCajunCambodianCanadianCape VerdeanCarpatho RusynCelticCentral AmericanCentral American IndianCherokeeCheyenneChickasawChileanChineseChippewaChoctawColombianColvilleComancheCosta RicanCreeCreekCroatianCrowCubanCypriotCzechCzechoslovakianDanishDelawareDominicanDutchDutch West IndianEastern EuropeanEcuadorianEgyptianEnglishEstonianEthiopianEuropeanFijianFilipinoFinnishFrenchFrench American IndianFrench CanadianGermanGerman RussianGhanaianGreekGuamanian/ChamorroGuatemalanGuyaneseHaitianHmongHonduranHopiHoumaHungarianIcelanderIndian (Asian)IndonesianInupiatIranianIraqiIrishIroquoisIsraeliItalianJamaicanJapaneseJordanianKenyanKiowaKoreanLaotianLatvianLebaneseLiberianLithuanianLumbeeLuxembourgerMacedonianMalaysianMalteseMarshalleseMenomineeMexicanMexican American IndianMongolianMoroccanNative HawaiianNavajoNepaleseNew ZealanderNicaraguanNigerianNorthern EuropeanNorwegianOkinawanOsageOttawaPaiutePakistaniPalestinianPanamanianParaguayanPennsylvania GermanPeruvianPimaPolishPortuguesePotawatomiPuebloPuerto RicanPuget Sound SalishRomanianRussianSalvadoranSamoanScandinavianScotch-IrishScottishSeminoleSenegaleseSerbianShoshoneSierra LeoneanSiouxSlavicSlovakSloveneSomaliSouth AfricanSouth AmericanSouth American IndianSoviet UnionSpaniardSpanishSpanish AmericanSpanish American IndianSri LankanSubsaharan AfricanSudaneseSwedishSwissSyrianTaiwaneseThaiTlingit-HaidaTohono O'OdhamTonganTrinidadian and TobagonianTsimshianTurkishU.S. Virgin IslanderUgandanUkrainianUruguayanUteVenezuelanVietnameseWelshWest IndianYakamaYaquiYugoslavianYumanYup'ikZimbabwean
Immigration
NonimmigrantsImmigrantsAfghanistanAfricaAlbaniaArgentinaArmeniaAsiaAustraliaAustriaBahamasBangladeshBarbadosBelarusBelgiumBelizeBoliviaBosnia and HerzegovinaBrazilBulgariaBurma/MyanmarCabo VerdeCambodiaCameroonCanadaCaribbeanCentral AmericaChileChinaColombiaCongoCosta RicaCroatiaCubaCzechoslovakiaDenmarkDominicaDominican RepublicEastern AfricaEastern AsiaEastern EuropeEcuadorEgyptEl SalvadorEnglandEritreaEthiopiaEuropeFijiFranceGermanyGhanaGreeceGrenadaGuatemalaGuyanaHaitiHondurasHong KongHungaryIndiaIndonesiaIranIraqIrelandIsraelItalyJamaicaJapanJordanKazakhstanKenyaKoreaKuwaitLaosLatin AmericaLatviaLebanonLiberiaLithuaniaMalaysiaMexicoMicronesiaMiddle AfricaMoldovaMoroccoNepalNetherlandsNicaraguaNigeriaNorth AmericaNorth MacedoniaNorthern AfricaNorthern EuropeNorwayOceaniaPakistanPanamaPeruPhilippinesPolandPortugalRomaniaRussiaSaudi ArabiaScotlandSenegalSerbiaSierra LeoneSingaporeSomaliaSouth AfricaSouth AmericaSouth Central AsiaSouth Eastern AsiaSouthern EuropeSpainSri LankaSt. Vincent and the GrenadinesSudanSwedenSwitzerlandSyriaTaiwanThailandTrinidad and TobagoTurkeyUgandaUkraineUruguayUzbekistanVenezuelaVietnamWest IndiesWestern AfricaWestern AsiaWestern EuropeYemenZaireZimbabweAzores
Female Poverty Among 18-24 Year Olds
Income
Poverty
Unemployment
Labor Participation
Family Structure
Vehicle Availability
Education Level
Disability

Female Poverty Among 18-24 Year Olds Comparison

Asians

Immigrants from St. Vincent and the Grenadines

Exceptional
Tragic
18.2%
FEMALE POVERTY AMONG 18-24 YEAR OLDS
100.0/ 100
METRIC RATING
47th/ 347
METRIC RANK
20.8%
FEMALE POVERTY AMONG 18-24 YEAR OLDS
6.0/ 100
METRIC RATING
231st/ 347
METRIC RANK

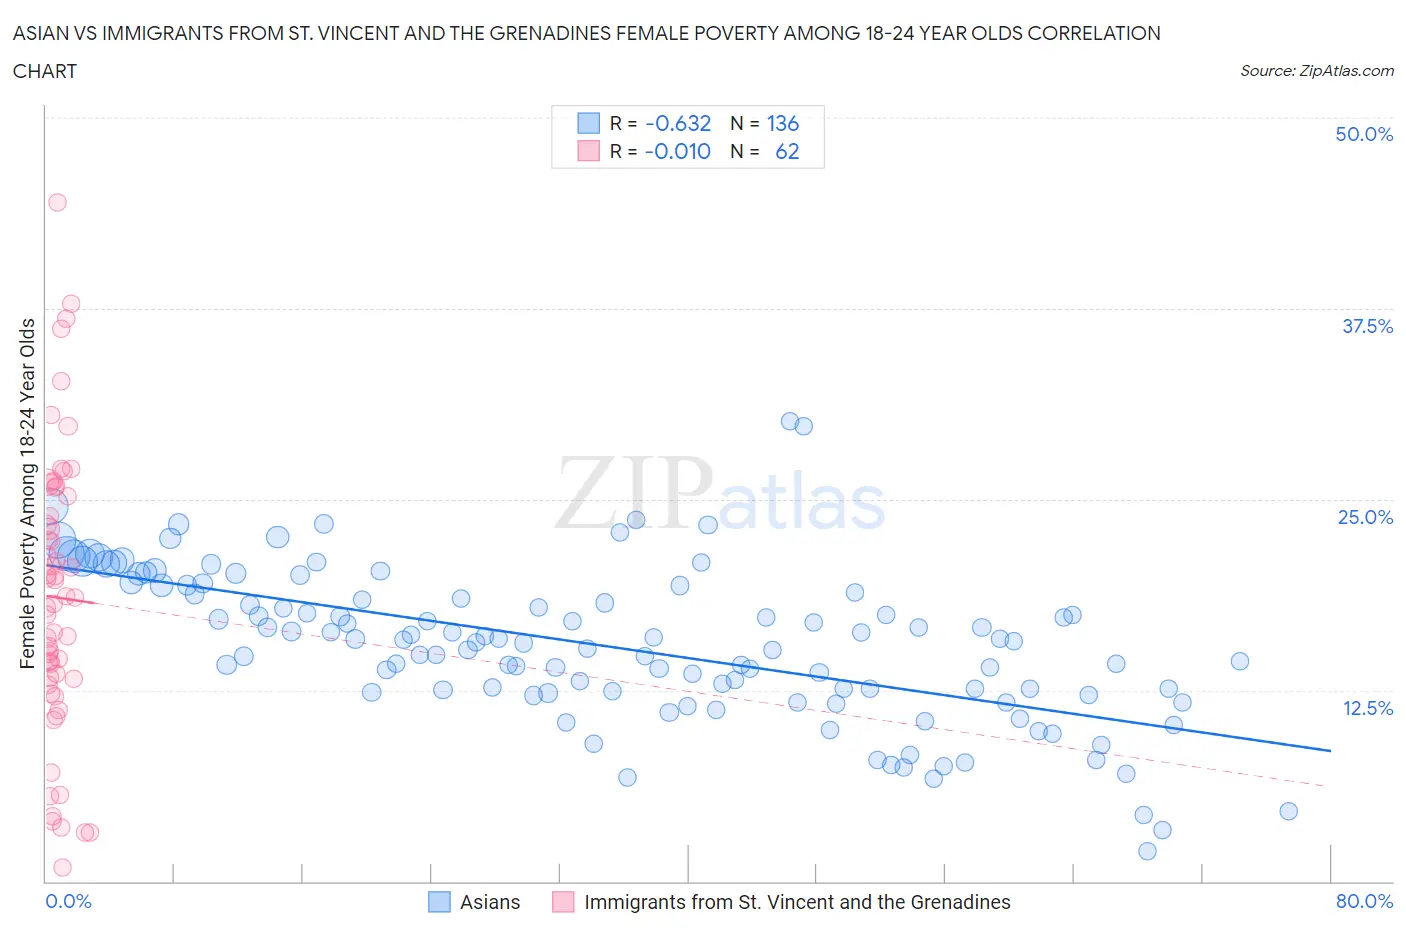
Asian vs Immigrants from St. Vincent and the Grenadines Female Poverty Among 18-24 Year Olds Correlation Chart

The statistical analysis conducted on geographies consisting of 523,051,207 people shows a significant negative correlation between the proportion of Asians and poverty level among females between the ages 18 and 24 in the United States with a correlation coefficient (R) of -0.632 and weighted average of 18.2%. Similarly, the statistical analysis conducted on geographies consisting of 56,017,716 people shows no correlation between the proportion of Immigrants from St. Vincent and the Grenadines and poverty level among females between the ages 18 and 24 in the United States with a correlation coefficient (R) of -0.010 and weighted average of 20.8%, a difference of 14.3%.
Asian vs Immigrants from St. Vincent and the Grenadines Female Poverty Among 18-24 Year Olds

Female Poverty Among 18-24 Year Olds Correlation Summary

MeasurementAsianImmigrants from St. Vincent and the Grenadines
Minimum1.9%0.92%
Maximum30.1%44.4%
Range28.2%43.5%
Mean15.4%18.6%
Median15.7%18.3%
Interquartile 25% (IQ1)12.4%13.3%
Interquartile 75% (IQ3)18.9%25.2%
Interquartile Range (IQR)6.5%12.0%
Standard Deviation (Sample)5.0%9.2%
Standard Deviation (Population)5.0%9.2%

Similar Demographics by Female Poverty Among 18-24 Year Olds

Demographics Similar to Asians by Female Poverty Among 18-24 Year Olds

In terms of female poverty among 18-24 year olds, the demographic groups most similar to Asians are Sri Lankan (18.2%, a difference of 0.050%), Immigrants from Southern Europe (18.2%, a difference of 0.080%), Bhutanese (18.2%, a difference of 0.080%), Samoan (18.2%, a difference of 0.19%), and Immigrants from Eastern Europe (18.2%, a difference of 0.36%).
DemographicsRating | RankFemale Poverty Among 18-24 Year Olds
Immigrants | Romania
100.0
/100
|
#40
Exceptional
18.0%
Immigrants | Argentina
100.0
/100
|
#41
Exceptional
18.0%
Bulgarians
100.0
/100
|
#42
Exceptional
18.1%
Macedonians
100.0
/100
|
#43
Exceptional
18.1%
Nicaraguans
100.0
/100
|
#44
Exceptional
18.1%
Spanish American Indians
100.0
/100
|
#45
Exceptional
18.1%
Immigrants | Southern Europe
100.0
/100
|
#46
Exceptional
18.2%
Asians
100.0
/100
|
#47
Exceptional
18.2%
Sri Lankans
100.0
/100
|
#48
Exceptional
18.2%
Bhutanese
100.0
/100
|
#49
Exceptional
18.2%
Samoans
100.0
/100
|
#50
Exceptional
18.2%
Immigrants | Eastern Europe
99.9
/100
|
#51
Exceptional
18.2%
Immigrants | Ireland
99.9
/100
|
#52
Exceptional
18.3%
Italians
99.9
/100
|
#53
Exceptional
18.3%
Immigrants | Egypt
99.9
/100
|
#54
Exceptional
18.4%

Demographics Similar to Immigrants from St. Vincent and the Grenadines by Female Poverty Among 18-24 Year Olds

In terms of female poverty among 18-24 year olds, the demographic groups most similar to Immigrants from St. Vincent and the Grenadines are Finnish (20.8%, a difference of 0.0%), White/Caucasian (20.8%, a difference of 0.020%), Australian (20.8%, a difference of 0.030%), Immigrants from Denmark (20.8%, a difference of 0.040%), and Ghanaian (20.8%, a difference of 0.090%).
DemographicsRating | RankFemale Poverty Among 18-24 Year Olds
Immigrants | Liberia
7.6
/100
|
#224
Tragic
20.7%
Norwegians
7.3
/100
|
#225
Tragic
20.7%
Estonians
7.2
/100
|
#226
Tragic
20.7%
Immigrants | Sweden
6.8
/100
|
#227
Tragic
20.7%
Ghanaians
6.5
/100
|
#228
Tragic
20.8%
Australians
6.1
/100
|
#229
Tragic
20.8%
Whites/Caucasians
6.1
/100
|
#230
Tragic
20.8%
Immigrants | St. Vincent and the Grenadines
6.0
/100
|
#231
Tragic
20.8%
Finns
6.0
/100
|
#232
Tragic
20.8%
Immigrants | Denmark
5.8
/100
|
#233
Tragic
20.8%
Welsh
5.4
/100
|
#234
Tragic
20.8%
Immigrants | Uganda
5.1
/100
|
#235
Tragic
20.8%
Okinawans
4.9
/100
|
#236
Tragic
20.8%
Scottish
4.5
/100
|
#237
Tragic
20.9%
Immigrants | Singapore
4.4
/100
|
#238
Tragic
20.9%