Yaqui vs Guatemalan Family Poverty
COMPARE
Yaqui
Guatemalan
Family Poverty
Family Poverty Comparison
Yaqui
Guatemalans
11.3%
FAMILY POVERTY
0.0/ 100
METRIC RATING
284th/ 347
METRIC RANK
11.7%
FAMILY POVERTY
0.0/ 100
METRIC RATING
302nd/ 347
METRIC RANK
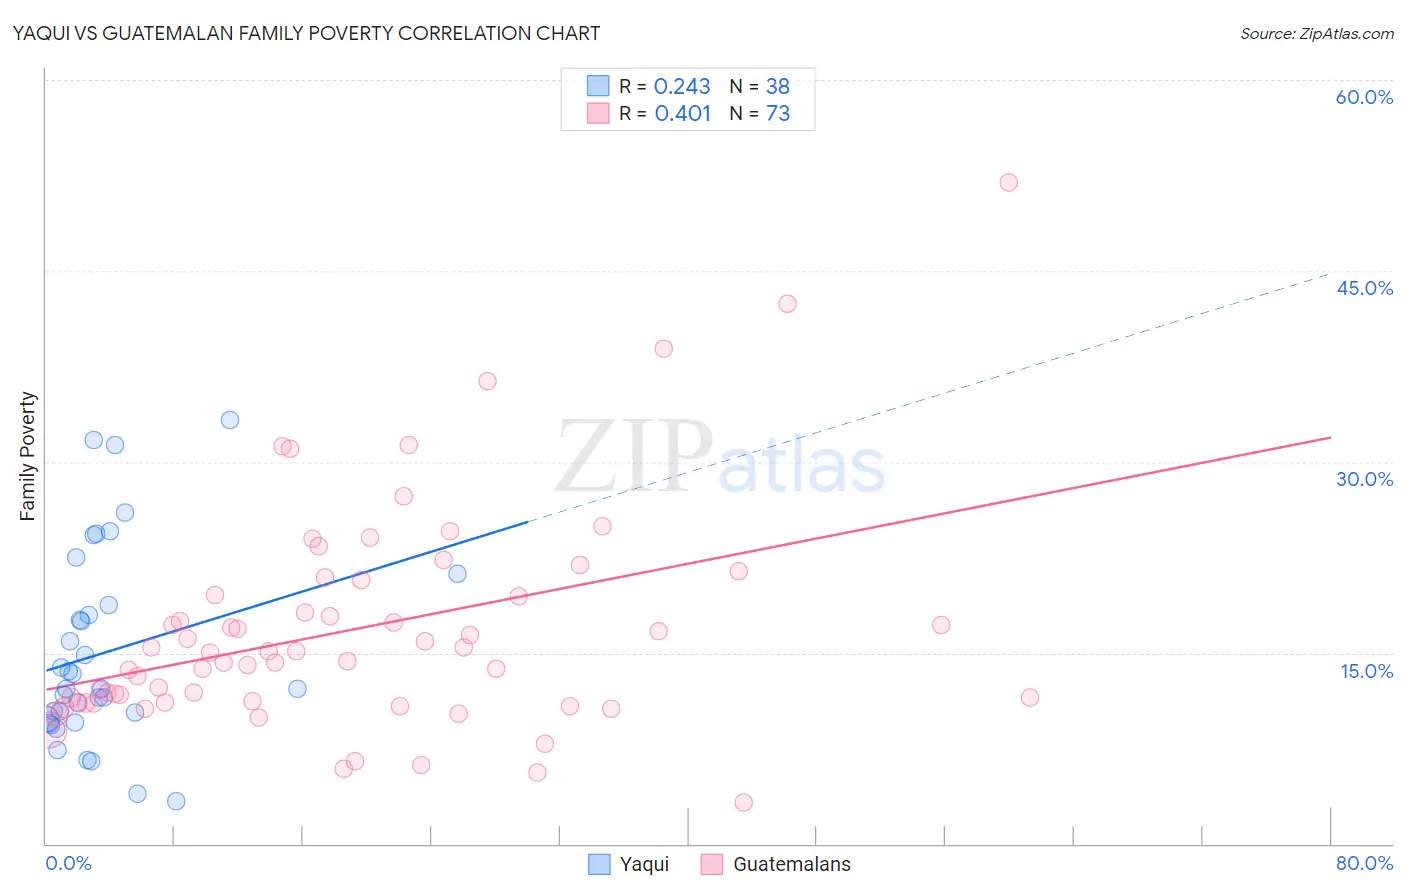
Yaqui vs Guatemalan Family Poverty Correlation Chart
The statistical analysis conducted on geographies consisting of 107,688,240 people shows a weak positive correlation between the proportion of Yaqui and poverty level among families in the United States with a correlation coefficient (R) of 0.243 and weighted average of 11.3%. Similarly, the statistical analysis conducted on geographies consisting of 408,686,067 people shows a moderate positive correlation between the proportion of Guatemalans and poverty level among families in the United States with a correlation coefficient (R) of 0.401 and weighted average of 11.7%, a difference of 3.3%.
Family Poverty Correlation Summary
| Measurement | Yaqui | Guatemalan |
| Minimum | 3.3% | 3.3% |
| Maximum | 33.3% | 51.9% |
| Range | 30.0% | 48.7% |
| Mean | 15.0% | 16.8% |
| Median | 12.2% | 15.0% |
| Interquartile 25% (IQ1) | 9.8% | 11.1% |
| Interquartile 75% (IQ3) | 18.8% | 20.1% |
| Interquartile Range (IQR) | 8.9% | 9.0% |
| Standard Deviation (Sample) | 7.6% | 8.7% |
| Standard Deviation (Population) | 7.5% | 8.6% |
Demographics Similar to Yaqui and Guatemalans by Family Poverty
In terms of family poverty, the demographic groups most similar to Yaqui are Barbadian (11.3%, a difference of 0.080%), Indonesian (11.3%, a difference of 0.12%), Senegalese (11.5%, a difference of 1.1%), Vietnamese (11.5%, a difference of 1.4%), and Immigrants from Belize (11.5%, a difference of 1.6%). Similarly, the demographic groups most similar to Guatemalans are Bahamian (11.7%, a difference of 0.040%), Immigrants from Bangladesh (11.7%, a difference of 0.29%), Dutch West Indian (11.7%, a difference of 0.31%), Immigrants from Senegal (11.7%, a difference of 0.41%), and African (11.8%, a difference of 0.50%).
| Demographics | Rating | Rank | Family Poverty |
| Indonesians | 0.0 /100 | #283 | Tragic 11.3% |
| Yaqui | 0.0 /100 | #284 | Tragic 11.3% |
| Barbadians | 0.0 /100 | #285 | Tragic 11.3% |
| Senegalese | 0.0 /100 | #286 | Tragic 11.5% |
| Vietnamese | 0.0 /100 | #287 | Tragic 11.5% |
| Immigrants | Belize | 0.0 /100 | #288 | Tragic 11.5% |
| Immigrants | Barbados | 0.0 /100 | #289 | Tragic 11.5% |
| West Indians | 0.0 /100 | #290 | Tragic 11.5% |
| Haitians | 0.0 /100 | #291 | Tragic 11.5% |
| Immigrants | Somalia | 0.0 /100 | #292 | Tragic 11.5% |
| Immigrants | Cabo Verde | 0.0 /100 | #293 | Tragic 11.6% |
| Immigrants | St. Vincent and the Grenadines | 0.0 /100 | #294 | Tragic 11.6% |
| Immigrants | Haiti | 0.0 /100 | #295 | Tragic 11.6% |
| Choctaw | 0.0 /100 | #296 | Tragic 11.6% |
| Creek | 0.0 /100 | #297 | Tragic 11.7% |
| Immigrants | Senegal | 0.0 /100 | #298 | Tragic 11.7% |
| Dutch West Indians | 0.0 /100 | #299 | Tragic 11.7% |
| Immigrants | Bangladesh | 0.0 /100 | #300 | Tragic 11.7% |
| Bahamians | 0.0 /100 | #301 | Tragic 11.7% |
| Guatemalans | 0.0 /100 | #302 | Tragic 11.7% |
| Africans | 0.0 /100 | #303 | Tragic 11.8% |