White/Caucasian vs Cajun Seniors Poverty Over the Age of 75
COMPARE
White/Caucasian
Cajun
Seniors Poverty Over the Age of 75
Seniors Poverty Over the Age of 75 Comparison
Whites/Caucasians
Cajuns
11.4%
SENIORS POVERTY OVER THE AGE OF 75
95.5/ 100
METRIC RATING
77th/ 347
METRIC RANK
14.0%
SENIORS POVERTY OVER THE AGE OF 75
0.1/ 100
METRIC RATING
262nd/ 347
METRIC RANK
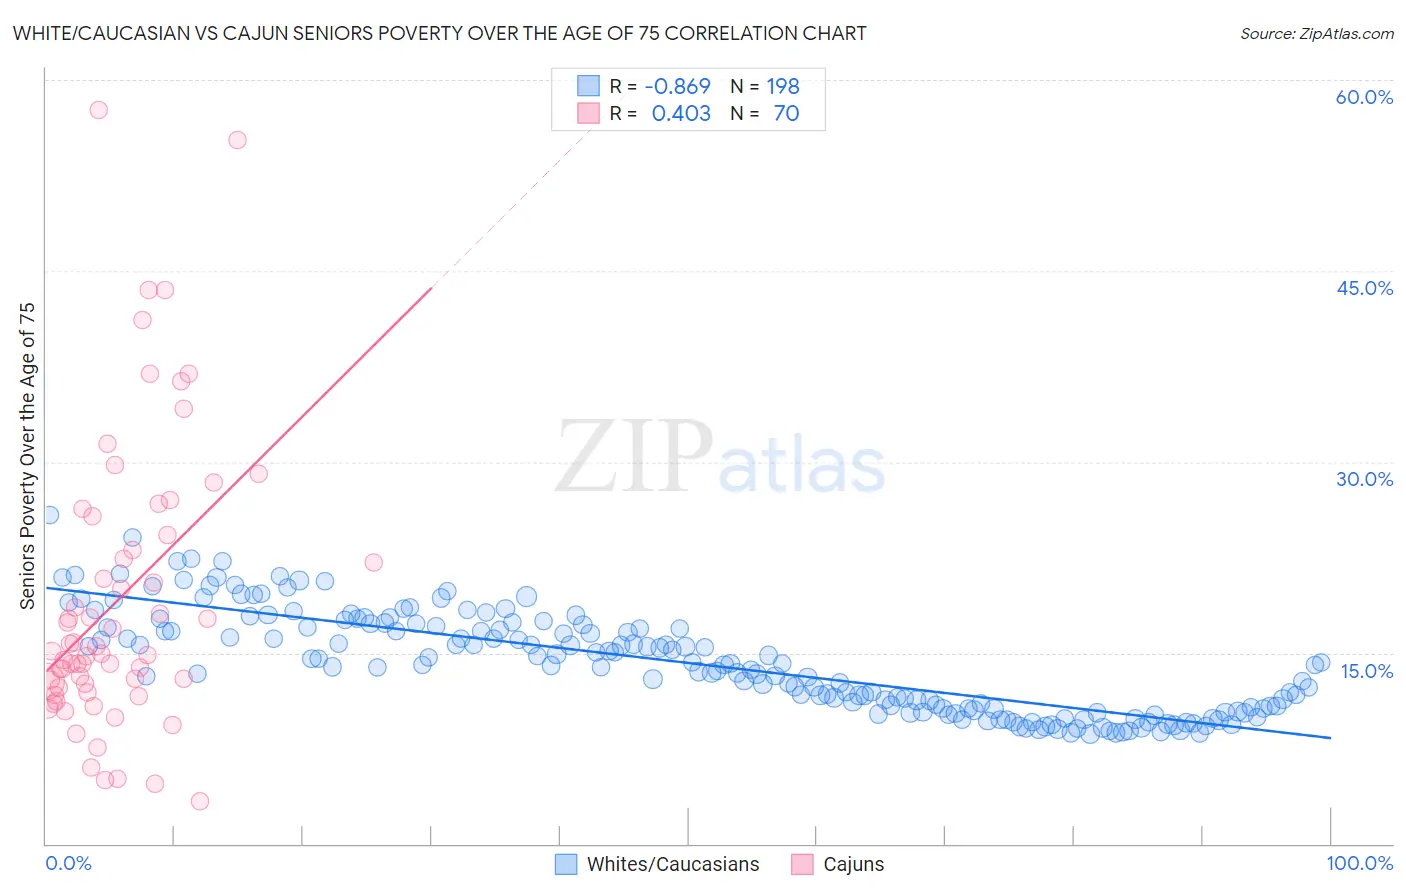
White/Caucasian vs Cajun Seniors Poverty Over the Age of 75 Correlation Chart
The statistical analysis conducted on geographies consisting of 563,847,839 people shows a very strong negative correlation between the proportion of Whites/Caucasians and poverty level among seniors over the age of 75 in the United States with a correlation coefficient (R) of -0.869 and weighted average of 11.4%. Similarly, the statistical analysis conducted on geographies consisting of 148,432,378 people shows a moderate positive correlation between the proportion of Cajuns and poverty level among seniors over the age of 75 in the United States with a correlation coefficient (R) of 0.403 and weighted average of 14.0%, a difference of 22.4%.
Seniors Poverty Over the Age of 75 Correlation Summary
| Measurement | White/Caucasian | Cajun |
| Minimum | 8.6% | 3.4% |
| Maximum | 25.8% | 57.7% |
| Range | 17.1% | 54.3% |
| Mean | 14.2% | 19.2% |
| Median | 14.0% | 15.1% |
| Interquartile 25% (IQ1) | 10.6% | 12.2% |
| Interquartile 75% (IQ3) | 17.1% | 24.2% |
| Interquartile Range (IQR) | 6.5% | 12.0% |
| Standard Deviation (Sample) | 3.9% | 11.4% |
| Standard Deviation (Population) | 3.9% | 11.3% |
Similar Demographics by Seniors Poverty Over the Age of 75
Demographics Similar to Whites/Caucasians by Seniors Poverty Over the Age of 75
In terms of seniors poverty over the age of 75, the demographic groups most similar to Whites/Caucasians are Macedonian (11.4%, a difference of 0.010%), Filipino (11.4%, a difference of 0.020%), Alaska Native (11.4%, a difference of 0.070%), French Canadian (11.4%, a difference of 0.080%), and Palestinian (11.4%, a difference of 0.15%).
| Demographics | Rating | Rank | Seniors Poverty Over the Age of 75 |
| Immigrants | South Central Asia | 96.4 /100 | #70 | Exceptional 11.4% |
| Osage | 96.3 /100 | #71 | Exceptional 11.4% |
| Sierra Leoneans | 96.1 /100 | #72 | Exceptional 11.4% |
| Immigrants | Micronesia | 96.0 /100 | #73 | Exceptional 11.4% |
| Delaware | 96.0 /100 | #74 | Exceptional 11.4% |
| Palestinians | 95.8 /100 | #75 | Exceptional 11.4% |
| French Canadians | 95.7 /100 | #76 | Exceptional 11.4% |
| Whites/Caucasians | 95.5 /100 | #77 | Exceptional 11.4% |
| Macedonians | 95.5 /100 | #78 | Exceptional 11.4% |
| Filipinos | 95.5 /100 | #79 | Exceptional 11.4% |
| Alaska Natives | 95.4 /100 | #80 | Exceptional 11.4% |
| Basques | 95.1 /100 | #81 | Exceptional 11.5% |
| Iranians | 95.1 /100 | #82 | Exceptional 11.5% |
| Immigrants | South Africa | 94.9 /100 | #83 | Exceptional 11.5% |
| Immigrants | Iraq | 94.9 /100 | #84 | Exceptional 11.5% |
Demographics Similar to Cajuns by Seniors Poverty Over the Age of 75
In terms of seniors poverty over the age of 75, the demographic groups most similar to Cajuns are Iroquois (14.0%, a difference of 0.13%), Ghanaian (14.0%, a difference of 0.23%), Immigrants (13.9%, a difference of 0.33%), Immigrants from Portugal (13.9%, a difference of 0.40%), and Immigrants from Panama (13.9%, a difference of 0.44%).
| Demographics | Rating | Rank | Seniors Poverty Over the Age of 75 |
| Immigrants | Belarus | 0.2 /100 | #255 | Tragic 13.8% |
| Inupiat | 0.1 /100 | #256 | Tragic 13.8% |
| Immigrants | Western Africa | 0.1 /100 | #257 | Tragic 13.9% |
| Immigrants | Panama | 0.1 /100 | #258 | Tragic 13.9% |
| Immigrants | Portugal | 0.1 /100 | #259 | Tragic 13.9% |
| Immigrants | Immigrants | 0.1 /100 | #260 | Tragic 13.9% |
| Ghanaians | 0.1 /100 | #261 | Tragic 14.0% |
| Cajuns | 0.1 /100 | #262 | Tragic 14.0% |
| Iroquois | 0.1 /100 | #263 | Tragic 14.0% |
| South Americans | 0.0 /100 | #264 | Tragic 14.1% |
| Salvadorans | 0.0 /100 | #265 | Tragic 14.2% |
| Armenians | 0.0 /100 | #266 | Tragic 14.2% |
| Venezuelans | 0.0 /100 | #267 | Tragic 14.2% |
| Colombians | 0.0 /100 | #268 | Tragic 14.3% |
| Immigrants | Venezuela | 0.0 /100 | #269 | Tragic 14.3% |