Shoshone vs Cajun Seniors Poverty Over the Age of 75
COMPARE
Shoshone
Cajun
Seniors Poverty Over the Age of 75
Seniors Poverty Over the Age of 75 Comparison
Shoshone
Cajuns
13.1%
SENIORS POVERTY OVER THE AGE OF 75
2.6/ 100
METRIC RATING
226th/ 347
METRIC RANK
14.0%
SENIORS POVERTY OVER THE AGE OF 75
0.1/ 100
METRIC RATING
262nd/ 347
METRIC RANK
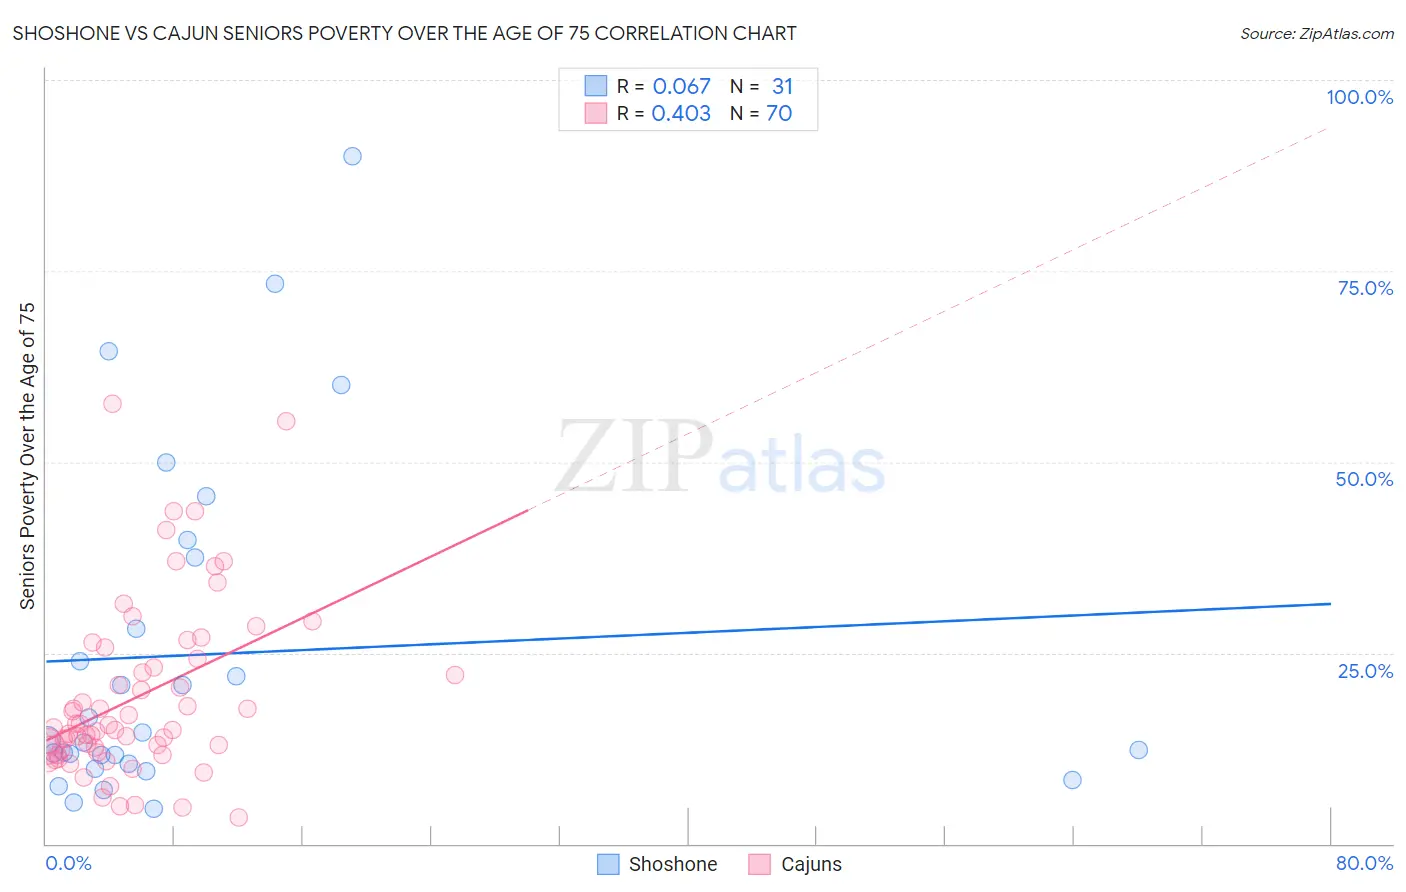
Shoshone vs Cajun Seniors Poverty Over the Age of 75 Correlation Chart
The statistical analysis conducted on geographies consisting of 66,327,855 people shows a slight positive correlation between the proportion of Shoshone and poverty level among seniors over the age of 75 in the United States with a correlation coefficient (R) of 0.067 and weighted average of 13.1%. Similarly, the statistical analysis conducted on geographies consisting of 148,432,378 people shows a moderate positive correlation between the proportion of Cajuns and poverty level among seniors over the age of 75 in the United States with a correlation coefficient (R) of 0.403 and weighted average of 14.0%, a difference of 6.9%.
Seniors Poverty Over the Age of 75 Correlation Summary
| Measurement | Shoshone | Cajun |
| Minimum | 4.6% | 3.4% |
| Maximum | 90.0% | 57.7% |
| Range | 85.4% | 54.3% |
| Mean | 24.8% | 19.2% |
| Median | 13.7% | 15.1% |
| Interquartile 25% (IQ1) | 10.6% | 12.2% |
| Interquartile 75% (IQ3) | 37.5% | 24.2% |
| Interquartile Range (IQR) | 26.9% | 12.0% |
| Standard Deviation (Sample) | 22.1% | 11.4% |
| Standard Deviation (Population) | 21.8% | 11.3% |
Similar Demographics by Seniors Poverty Over the Age of 75
Demographics Similar to Shoshone by Seniors Poverty Over the Age of 75
In terms of seniors poverty over the age of 75, the demographic groups most similar to Shoshone are Immigrants from Morocco (13.1%, a difference of 0.16%), Chippewa (13.1%, a difference of 0.23%), Cree (13.1%, a difference of 0.26%), Immigrants from Nigeria (13.0%, a difference of 0.43%), and Nigerian (13.0%, a difference of 0.52%).
| Demographics | Rating | Rank | Seniors Poverty Over the Age of 75 |
| Ute | 4.7 /100 | #219 | Tragic 12.9% |
| Seminole | 4.5 /100 | #220 | Tragic 12.9% |
| Immigrants | Kazakhstan | 4.3 /100 | #221 | Tragic 13.0% |
| Nigerians | 3.4 /100 | #222 | Tragic 13.0% |
| Immigrants | Nigeria | 3.3 /100 | #223 | Tragic 13.0% |
| Chippewa | 2.9 /100 | #224 | Tragic 13.1% |
| Immigrants | Morocco | 2.8 /100 | #225 | Tragic 13.1% |
| Shoshone | 2.6 /100 | #226 | Tragic 13.1% |
| Cree | 2.3 /100 | #227 | Tragic 13.1% |
| Israelis | 2.0 /100 | #228 | Tragic 13.2% |
| Somalis | 1.6 /100 | #229 | Tragic 13.2% |
| Immigrants | China | 1.5 /100 | #230 | Tragic 13.2% |
| Sub-Saharan Africans | 1.5 /100 | #231 | Tragic 13.2% |
| Immigrants | Chile | 1.3 /100 | #232 | Tragic 13.3% |
| Immigrants | Costa Rica | 1.3 /100 | #233 | Tragic 13.3% |
Demographics Similar to Cajuns by Seniors Poverty Over the Age of 75
In terms of seniors poverty over the age of 75, the demographic groups most similar to Cajuns are Iroquois (14.0%, a difference of 0.13%), Ghanaian (14.0%, a difference of 0.23%), Immigrants (13.9%, a difference of 0.33%), Immigrants from Portugal (13.9%, a difference of 0.40%), and Immigrants from Panama (13.9%, a difference of 0.44%).
| Demographics | Rating | Rank | Seniors Poverty Over the Age of 75 |
| Immigrants | Belarus | 0.2 /100 | #255 | Tragic 13.8% |
| Inupiat | 0.1 /100 | #256 | Tragic 13.8% |
| Immigrants | Western Africa | 0.1 /100 | #257 | Tragic 13.9% |
| Immigrants | Panama | 0.1 /100 | #258 | Tragic 13.9% |
| Immigrants | Portugal | 0.1 /100 | #259 | Tragic 13.9% |
| Immigrants | Immigrants | 0.1 /100 | #260 | Tragic 13.9% |
| Ghanaians | 0.1 /100 | #261 | Tragic 14.0% |
| Cajuns | 0.1 /100 | #262 | Tragic 14.0% |
| Iroquois | 0.1 /100 | #263 | Tragic 14.0% |
| South Americans | 0.0 /100 | #264 | Tragic 14.1% |
| Salvadorans | 0.0 /100 | #265 | Tragic 14.2% |
| Armenians | 0.0 /100 | #266 | Tragic 14.2% |
| Venezuelans | 0.0 /100 | #267 | Tragic 14.2% |
| Colombians | 0.0 /100 | #268 | Tragic 14.3% |
| Immigrants | Venezuela | 0.0 /100 | #269 | Tragic 14.3% |