Ukrainian vs Spaniard Single Mother Poverty
COMPARE
Ukrainian
Spaniard
Single Mother Poverty
Single Mother Poverty Comparison
Ukrainians
Spaniards
28.0%
SINGLE MOTHER POVERTY
96.4/ 100
METRIC RATING
106th/ 347
METRIC RANK
30.2%
SINGLE MOTHER POVERTY
5.4/ 100
METRIC RATING
228th/ 347
METRIC RANK
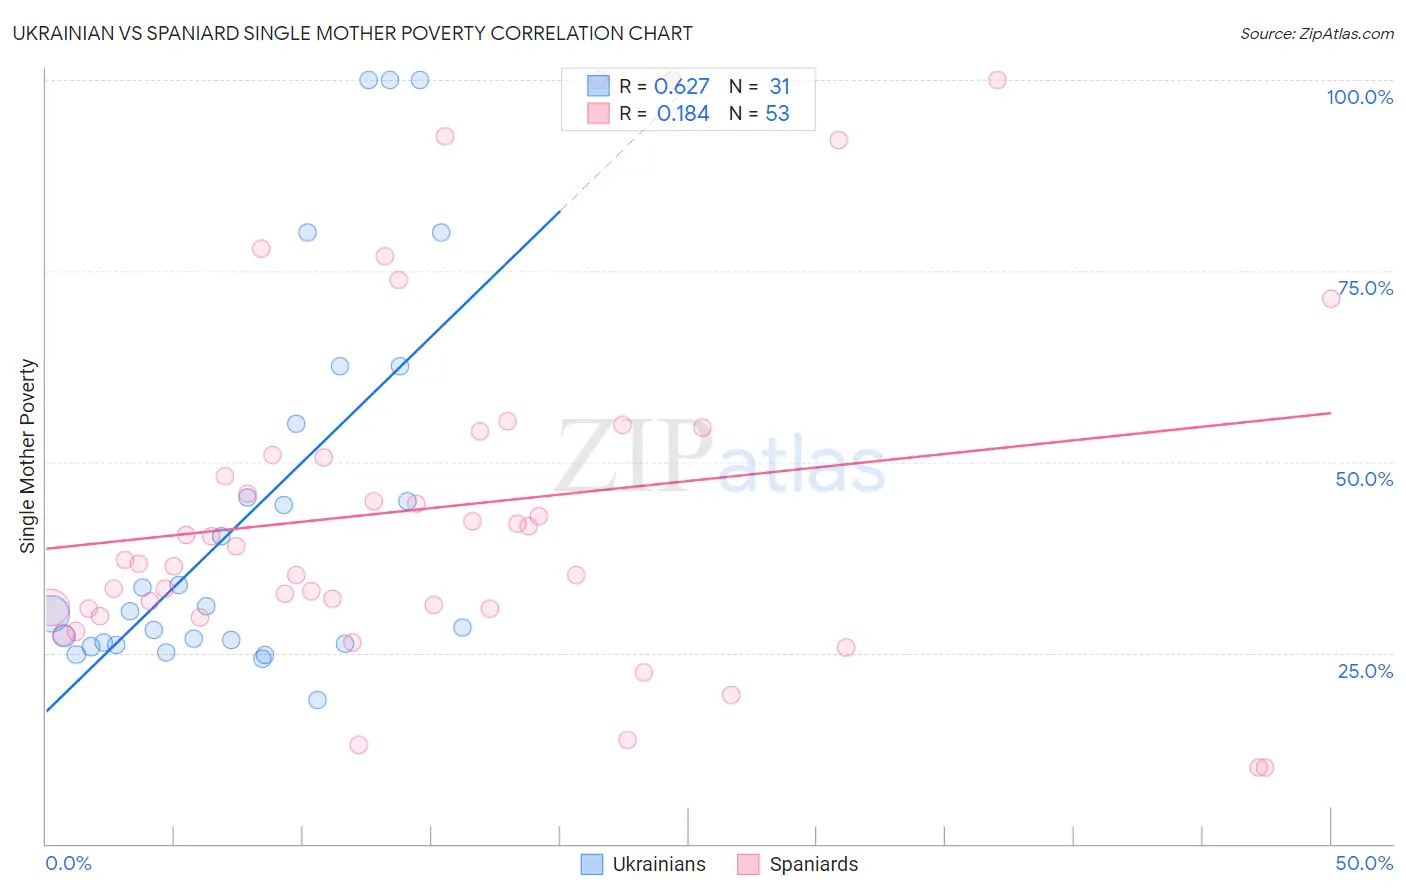
Ukrainian vs Spaniard Single Mother Poverty Correlation Chart
The statistical analysis conducted on geographies consisting of 432,495,804 people shows a significant positive correlation between the proportion of Ukrainians and poverty level among single mothers in the United States with a correlation coefficient (R) of 0.627 and weighted average of 28.0%. Similarly, the statistical analysis conducted on geographies consisting of 431,071,159 people shows a poor positive correlation between the proportion of Spaniards and poverty level among single mothers in the United States with a correlation coefficient (R) of 0.184 and weighted average of 30.2%, a difference of 7.7%.
Single Mother Poverty Correlation Summary
| Measurement | Ukrainian | Spaniard |
| Minimum | 18.8% | 10.0% |
| Maximum | 100.0% | 100.0% |
| Range | 81.2% | 90.0% |
| Mean | 43.0% | 44.0% |
| Median | 30.4% | 37.1% |
| Interquartile 25% (IQ1) | 26.3% | 30.8% |
| Interquartile 75% (IQ3) | 55.0% | 52.5% |
| Interquartile Range (IQR) | 28.7% | 21.7% |
| Standard Deviation (Sample) | 24.7% | 22.9% |
| Standard Deviation (Population) | 24.3% | 22.7% |
Similar Demographics by Single Mother Poverty
Demographics Similar to Ukrainians by Single Mother Poverty
In terms of single mother poverty, the demographic groups most similar to Ukrainians are Israeli (28.0%, a difference of 0.040%), Italian (28.0%, a difference of 0.070%), Immigrants from Northern Africa (28.0%, a difference of 0.090%), Immigrants from Croatia (28.0%, a difference of 0.10%), and Pakistani (28.0%, a difference of 0.20%).
| Demographics | Rating | Rank | Single Mother Poverty |
| Immigrants | Netherlands | 97.2 /100 | #99 | Exceptional 27.9% |
| Zimbabweans | 97.1 /100 | #100 | Exceptional 27.9% |
| Pakistanis | 96.9 /100 | #101 | Exceptional 28.0% |
| Immigrants | Croatia | 96.7 /100 | #102 | Exceptional 28.0% |
| Immigrants | Northern Africa | 96.6 /100 | #103 | Exceptional 28.0% |
| Italians | 96.6 /100 | #104 | Exceptional 28.0% |
| Israelis | 96.5 /100 | #105 | Exceptional 28.0% |
| Ukrainians | 96.4 /100 | #106 | Exceptional 28.0% |
| Immigrants | Venezuela | 95.8 /100 | #107 | Exceptional 28.1% |
| Immigrants | Zimbabwe | 95.5 /100 | #108 | Exceptional 28.1% |
| Immigrants | Armenia | 95.2 /100 | #109 | Exceptional 28.1% |
| Croatians | 94.8 /100 | #110 | Exceptional 28.2% |
| Venezuelans | 94.5 /100 | #111 | Exceptional 28.2% |
| Immigrants | Kazakhstan | 94.5 /100 | #112 | Exceptional 28.2% |
| Immigrants | South Africa | 93.2 /100 | #113 | Exceptional 28.3% |
Demographics Similar to Spaniards by Single Mother Poverty
In terms of single mother poverty, the demographic groups most similar to Spaniards are Immigrants from Barbados (30.2%, a difference of 0.090%), Immigrants from Liberia (30.1%, a difference of 0.11%), English (30.2%, a difference of 0.13%), Scottish (30.1%, a difference of 0.14%), and Spanish (30.1%, a difference of 0.20%).
| Demographics | Rating | Rank | Single Mother Poverty |
| Immigrants | Eritrea | 7.7 /100 | #221 | Tragic 30.0% |
| Sudanese | 7.6 /100 | #222 | Tragic 30.0% |
| Immigrants | Cuba | 6.9 /100 | #223 | Tragic 30.1% |
| Immigrants | Sudan | 6.5 /100 | #224 | Tragic 30.1% |
| Spanish | 6.3 /100 | #225 | Tragic 30.1% |
| Scottish | 6.0 /100 | #226 | Tragic 30.1% |
| Immigrants | Liberia | 5.9 /100 | #227 | Tragic 30.1% |
| Spaniards | 5.4 /100 | #228 | Tragic 30.2% |
| Immigrants | Barbados | 5.0 /100 | #229 | Tragic 30.2% |
| English | 4.8 /100 | #230 | Tragic 30.2% |
| Dutch | 4.3 /100 | #231 | Tragic 30.2% |
| Alaskan Athabascans | 4.1 /100 | #232 | Tragic 30.3% |
| Immigrants | Middle Africa | 3.5 /100 | #233 | Tragic 30.3% |
| Immigrants | Nicaragua | 3.5 /100 | #234 | Tragic 30.3% |
| Immigrants | Grenada | 3.4 /100 | #235 | Tragic 30.3% |