Ukrainian vs Immigrants from Guatemala Single Mother Poverty
COMPARE
Ukrainian
Immigrants from Guatemala
Single Mother Poverty
Single Mother Poverty Comparison
Ukrainians
Immigrants from Guatemala
28.0%
SINGLE MOTHER POVERTY
96.4/ 100
METRIC RATING
106th/ 347
METRIC RANK
33.3%
SINGLE MOTHER POVERTY
0.0/ 100
METRIC RATING
299th/ 347
METRIC RANK
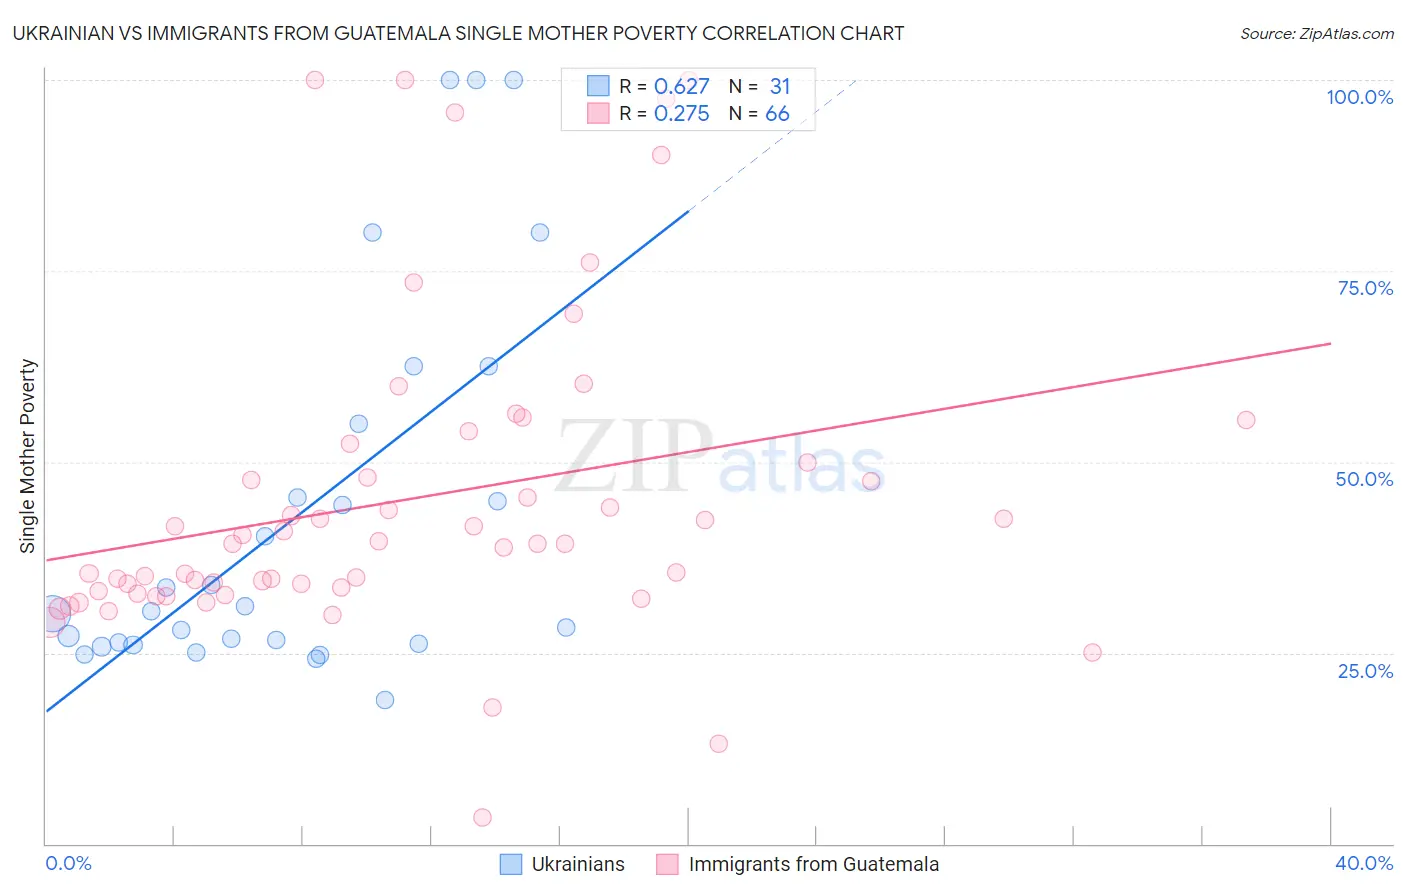
Ukrainian vs Immigrants from Guatemala Single Mother Poverty Correlation Chart
The statistical analysis conducted on geographies consisting of 432,495,804 people shows a significant positive correlation between the proportion of Ukrainians and poverty level among single mothers in the United States with a correlation coefficient (R) of 0.627 and weighted average of 28.0%. Similarly, the statistical analysis conducted on geographies consisting of 371,171,029 people shows a weak positive correlation between the proportion of Immigrants from Guatemala and poverty level among single mothers in the United States with a correlation coefficient (R) of 0.275 and weighted average of 33.3%, a difference of 18.9%.
Single Mother Poverty Correlation Summary
| Measurement | Ukrainian | Immigrants from Guatemala |
| Minimum | 18.8% | 3.4% |
| Maximum | 100.0% | 100.0% |
| Range | 81.2% | 96.6% |
| Mean | 43.0% | 45.0% |
| Median | 30.4% | 39.3% |
| Interquartile 25% (IQ1) | 26.3% | 33.0% |
| Interquartile 75% (IQ3) | 55.0% | 50.0% |
| Interquartile Range (IQR) | 28.7% | 17.0% |
| Standard Deviation (Sample) | 24.7% | 20.7% |
| Standard Deviation (Population) | 24.3% | 20.5% |
Similar Demographics by Single Mother Poverty
Demographics Similar to Ukrainians by Single Mother Poverty
In terms of single mother poverty, the demographic groups most similar to Ukrainians are Israeli (28.0%, a difference of 0.040%), Italian (28.0%, a difference of 0.070%), Immigrants from Northern Africa (28.0%, a difference of 0.090%), Immigrants from Croatia (28.0%, a difference of 0.10%), and Pakistani (28.0%, a difference of 0.20%).
| Demographics | Rating | Rank | Single Mother Poverty |
| Immigrants | Netherlands | 97.2 /100 | #99 | Exceptional 27.9% |
| Zimbabweans | 97.1 /100 | #100 | Exceptional 27.9% |
| Pakistanis | 96.9 /100 | #101 | Exceptional 28.0% |
| Immigrants | Croatia | 96.7 /100 | #102 | Exceptional 28.0% |
| Immigrants | Northern Africa | 96.6 /100 | #103 | Exceptional 28.0% |
| Italians | 96.6 /100 | #104 | Exceptional 28.0% |
| Israelis | 96.5 /100 | #105 | Exceptional 28.0% |
| Ukrainians | 96.4 /100 | #106 | Exceptional 28.0% |
| Immigrants | Venezuela | 95.8 /100 | #107 | Exceptional 28.1% |
| Immigrants | Zimbabwe | 95.5 /100 | #108 | Exceptional 28.1% |
| Immigrants | Armenia | 95.2 /100 | #109 | Exceptional 28.1% |
| Croatians | 94.8 /100 | #110 | Exceptional 28.2% |
| Venezuelans | 94.5 /100 | #111 | Exceptional 28.2% |
| Immigrants | Kazakhstan | 94.5 /100 | #112 | Exceptional 28.2% |
| Immigrants | South Africa | 93.2 /100 | #113 | Exceptional 28.3% |
Demographics Similar to Immigrants from Guatemala by Single Mother Poverty
In terms of single mother poverty, the demographic groups most similar to Immigrants from Guatemala are Hispanic or Latino (33.3%, a difference of 0.0%), African (33.3%, a difference of 0.090%), Pennsylvania German (33.2%, a difference of 0.20%), Immigrants from Somalia (33.4%, a difference of 0.25%), and Blackfeet (33.2%, a difference of 0.34%).
| Demographics | Rating | Rank | Single Mother Poverty |
| Shoshone | 0.0 /100 | #292 | Tragic 32.9% |
| Aleuts | 0.0 /100 | #293 | Tragic 32.9% |
| French American Indians | 0.0 /100 | #294 | Tragic 33.1% |
| Yaqui | 0.0 /100 | #295 | Tragic 33.1% |
| Blackfeet | 0.0 /100 | #296 | Tragic 33.2% |
| Pennsylvania Germans | 0.0 /100 | #297 | Tragic 33.2% |
| Africans | 0.0 /100 | #298 | Tragic 33.3% |
| Immigrants | Guatemala | 0.0 /100 | #299 | Tragic 33.3% |
| Hispanics or Latinos | 0.0 /100 | #300 | Tragic 33.3% |
| Immigrants | Somalia | 0.0 /100 | #301 | Tragic 33.4% |
| Arapaho | 0.0 /100 | #302 | Tragic 33.4% |
| Americans | 0.0 /100 | #303 | Tragic 33.5% |
| Mexicans | 0.0 /100 | #304 | Tragic 33.6% |
| Immigrants | Central America | 0.0 /100 | #305 | Tragic 33.6% |
| Immigrants | Congo | 0.0 /100 | #306 | Tragic 33.8% |