Ukrainian vs Indonesian Single Mother Poverty
COMPARE
Ukrainian
Indonesian
Single Mother Poverty
Single Mother Poverty Comparison
Ukrainians
Indonesians
28.0%
SINGLE MOTHER POVERTY
96.4/ 100
METRIC RATING
106th/ 347
METRIC RANK
32.4%
SINGLE MOTHER POVERTY
0.0/ 100
METRIC RATING
284th/ 347
METRIC RANK
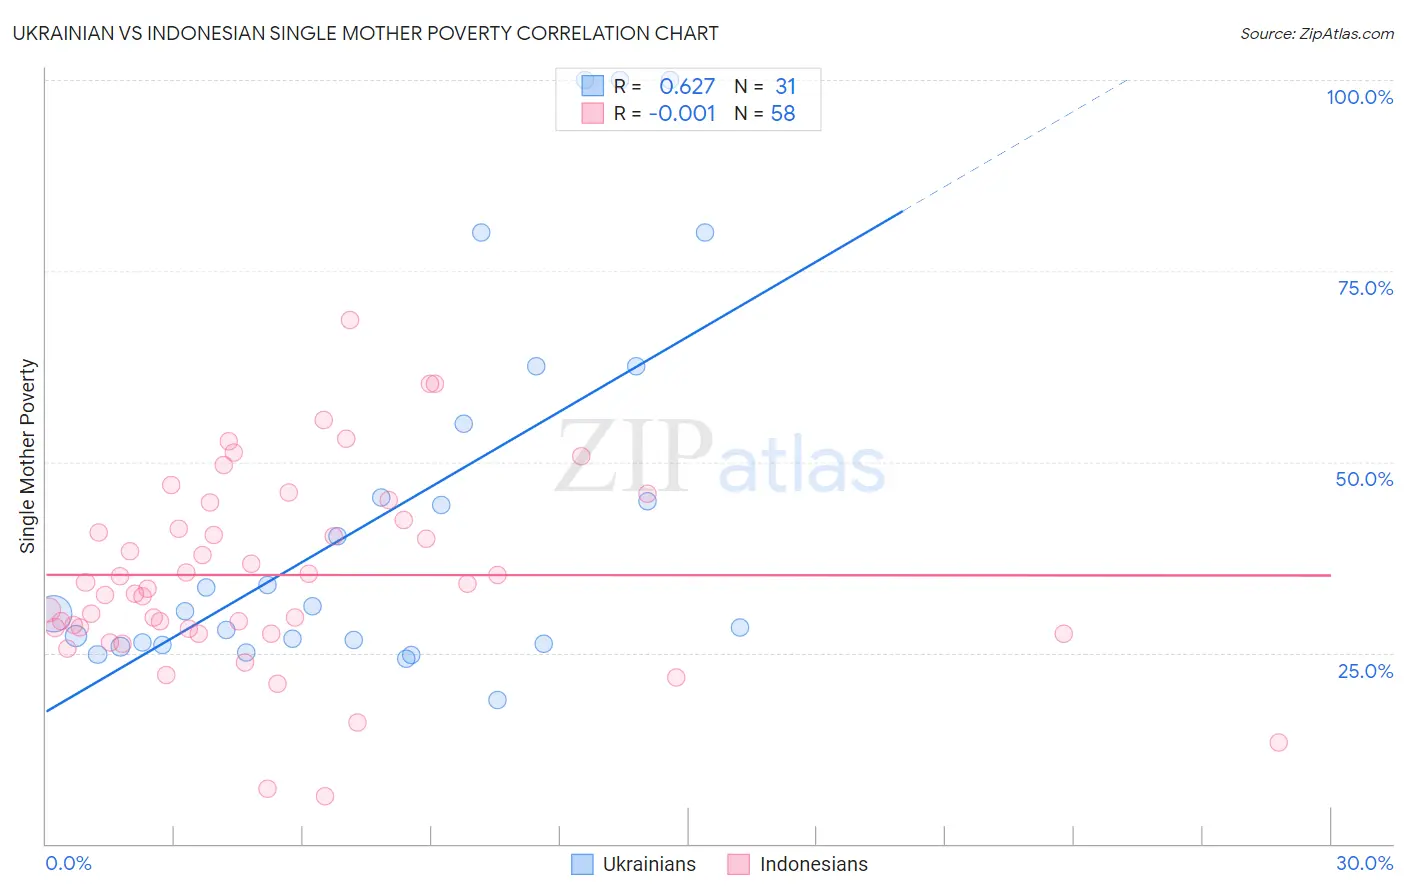
Ukrainian vs Indonesian Single Mother Poverty Correlation Chart
The statistical analysis conducted on geographies consisting of 432,495,804 people shows a significant positive correlation between the proportion of Ukrainians and poverty level among single mothers in the United States with a correlation coefficient (R) of 0.627 and weighted average of 28.0%. Similarly, the statistical analysis conducted on geographies consisting of 161,147,773 people shows no correlation between the proportion of Indonesians and poverty level among single mothers in the United States with a correlation coefficient (R) of -0.001 and weighted average of 32.4%, a difference of 15.6%.
Single Mother Poverty Correlation Summary
| Measurement | Ukrainian | Indonesian |
| Minimum | 18.8% | 6.2% |
| Maximum | 100.0% | 68.6% |
| Range | 81.2% | 62.4% |
| Mean | 43.0% | 35.2% |
| Median | 30.4% | 33.7% |
| Interquartile 25% (IQ1) | 26.3% | 28.2% |
| Interquartile 75% (IQ3) | 55.0% | 42.4% |
| Interquartile Range (IQR) | 28.7% | 14.2% |
| Standard Deviation (Sample) | 24.7% | 12.5% |
| Standard Deviation (Population) | 24.3% | 12.4% |
Similar Demographics by Single Mother Poverty
Demographics Similar to Ukrainians by Single Mother Poverty
In terms of single mother poverty, the demographic groups most similar to Ukrainians are Israeli (28.0%, a difference of 0.040%), Italian (28.0%, a difference of 0.070%), Immigrants from Northern Africa (28.0%, a difference of 0.090%), Immigrants from Croatia (28.0%, a difference of 0.10%), and Pakistani (28.0%, a difference of 0.20%).
| Demographics | Rating | Rank | Single Mother Poverty |
| Immigrants | Netherlands | 97.2 /100 | #99 | Exceptional 27.9% |
| Zimbabweans | 97.1 /100 | #100 | Exceptional 27.9% |
| Pakistanis | 96.9 /100 | #101 | Exceptional 28.0% |
| Immigrants | Croatia | 96.7 /100 | #102 | Exceptional 28.0% |
| Immigrants | Northern Africa | 96.6 /100 | #103 | Exceptional 28.0% |
| Italians | 96.6 /100 | #104 | Exceptional 28.0% |
| Israelis | 96.5 /100 | #105 | Exceptional 28.0% |
| Ukrainians | 96.4 /100 | #106 | Exceptional 28.0% |
| Immigrants | Venezuela | 95.8 /100 | #107 | Exceptional 28.1% |
| Immigrants | Zimbabwe | 95.5 /100 | #108 | Exceptional 28.1% |
| Immigrants | Armenia | 95.2 /100 | #109 | Exceptional 28.1% |
| Croatians | 94.8 /100 | #110 | Exceptional 28.2% |
| Venezuelans | 94.5 /100 | #111 | Exceptional 28.2% |
| Immigrants | Kazakhstan | 94.5 /100 | #112 | Exceptional 28.2% |
| Immigrants | South Africa | 93.2 /100 | #113 | Exceptional 28.3% |
Demographics Similar to Indonesians by Single Mother Poverty
In terms of single mother poverty, the demographic groups most similar to Indonesians are Immigrants from Latin America (32.4%, a difference of 0.11%), Yup'ik (32.5%, a difference of 0.19%), Spanish American (32.3%, a difference of 0.30%), Immigrants from Dominica (32.5%, a difference of 0.31%), and Somali (32.6%, a difference of 0.54%).
| Demographics | Rating | Rank | Single Mother Poverty |
| Mexican American Indians | 0.0 /100 | #277 | Tragic 31.9% |
| Immigrants | Zaire | 0.0 /100 | #278 | Tragic 32.0% |
| Marshallese | 0.0 /100 | #279 | Tragic 32.1% |
| Immigrants | Nonimmigrants | 0.0 /100 | #280 | Tragic 32.2% |
| Cree | 0.0 /100 | #281 | Tragic 32.2% |
| Immigrants | Azores | 0.0 /100 | #282 | Tragic 32.2% |
| Spanish Americans | 0.0 /100 | #283 | Tragic 32.3% |
| Indonesians | 0.0 /100 | #284 | Tragic 32.4% |
| Immigrants | Latin America | 0.0 /100 | #285 | Tragic 32.4% |
| Yup'ik | 0.0 /100 | #286 | Tragic 32.5% |
| Immigrants | Dominica | 0.0 /100 | #287 | Tragic 32.5% |
| Somalis | 0.0 /100 | #288 | Tragic 32.6% |
| U.S. Virgin Islanders | 0.0 /100 | #289 | Tragic 32.6% |
| Osage | 0.0 /100 | #290 | Tragic 32.6% |
| Guatemalans | 0.0 /100 | #291 | Tragic 32.9% |