Tsimshian vs African Single Female Poverty
COMPARE
Tsimshian
African
Single Female Poverty
Single Female Poverty Comparison
Tsimshian
Africans
19.1%
SINGLE FEMALE POVERTY
99.7/ 100
METRIC RATING
53rd/ 347
METRIC RANK
24.8%
SINGLE FEMALE POVERTY
0.0/ 100
METRIC RATING
296th/ 347
METRIC RANK
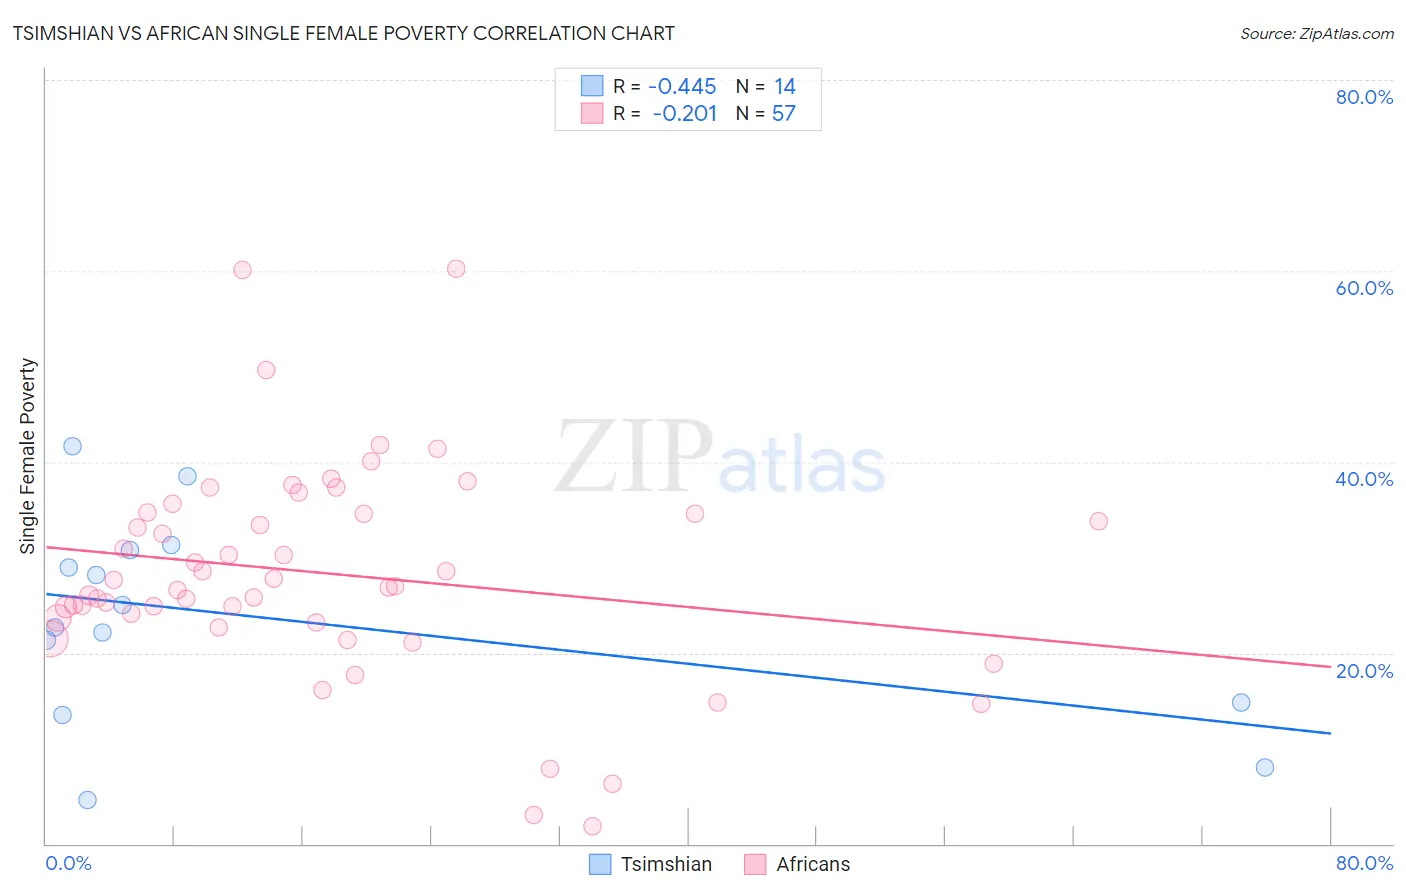
Tsimshian vs African Single Female Poverty Correlation Chart
The statistical analysis conducted on geographies consisting of 15,615,751 people shows a moderate negative correlation between the proportion of Tsimshian and poverty level among single females in the United States with a correlation coefficient (R) of -0.445 and weighted average of 19.1%. Similarly, the statistical analysis conducted on geographies consisting of 463,525,497 people shows a weak negative correlation between the proportion of Africans and poverty level among single females in the United States with a correlation coefficient (R) of -0.201 and weighted average of 24.8%, a difference of 29.6%.
Single Female Poverty Correlation Summary
| Measurement | Tsimshian | African |
| Minimum | 4.5% | 1.9% |
| Maximum | 41.7% | 60.3% |
| Range | 37.1% | 58.4% |
| Mean | 23.7% | 28.3% |
| Median | 23.8% | 27.0% |
| Interquartile 25% (IQ1) | 14.8% | 23.4% |
| Interquartile 75% (IQ3) | 30.8% | 34.6% |
| Interquartile Range (IQR) | 16.0% | 11.2% |
| Standard Deviation (Sample) | 10.7% | 11.2% |
| Standard Deviation (Population) | 10.4% | 11.1% |
Similar Demographics by Single Female Poverty
Demographics Similar to Tsimshian by Single Female Poverty
In terms of single female poverty, the demographic groups most similar to Tsimshian are Argentinean (19.1%, a difference of 0.010%), Immigrants from Vietnam (19.1%, a difference of 0.050%), Immigrants from Fiji (19.1%, a difference of 0.10%), Eastern European (19.1%, a difference of 0.16%), and Egyptian (19.1%, a difference of 0.21%).
| Demographics | Rating | Rank | Single Female Poverty |
| Macedonians | 99.8 /100 | #46 | Exceptional 18.9% |
| Latvians | 99.8 /100 | #47 | Exceptional 19.0% |
| Immigrants | Argentina | 99.8 /100 | #48 | Exceptional 19.0% |
| Immigrants | Czechoslovakia | 99.8 /100 | #49 | Exceptional 19.0% |
| Immigrants | Eastern Europe | 99.8 /100 | #50 | Exceptional 19.0% |
| Immigrants | Italy | 99.8 /100 | #51 | Exceptional 19.0% |
| Egyptians | 99.7 /100 | #52 | Exceptional 19.1% |
| Tsimshian | 99.7 /100 | #53 | Exceptional 19.1% |
| Argentineans | 99.7 /100 | #54 | Exceptional 19.1% |
| Immigrants | Vietnam | 99.7 /100 | #55 | Exceptional 19.1% |
| Immigrants | Fiji | 99.7 /100 | #56 | Exceptional 19.1% |
| Eastern Europeans | 99.7 /100 | #57 | Exceptional 19.1% |
| Immigrants | Bulgaria | 99.7 /100 | #58 | Exceptional 19.1% |
| Sri Lankans | 99.6 /100 | #59 | Exceptional 19.2% |
| Russians | 99.6 /100 | #60 | Exceptional 19.2% |
Demographics Similar to Africans by Single Female Poverty
In terms of single female poverty, the demographic groups most similar to Africans are Immigrants from Central America (24.8%, a difference of 0.28%), Hispanic or Latino (24.6%, a difference of 0.48%), Yaqui (24.9%, a difference of 0.48%), French American Indian (24.6%, a difference of 0.83%), and American (24.5%, a difference of 0.98%).
| Demographics | Rating | Rank | Single Female Poverty |
| U.S. Virgin Islanders | 0.0 /100 | #289 | Tragic 24.2% |
| Indonesians | 0.0 /100 | #290 | Tragic 24.3% |
| Osage | 0.0 /100 | #291 | Tragic 24.4% |
| Alsatians | 0.0 /100 | #292 | Tragic 24.5% |
| Americans | 0.0 /100 | #293 | Tragic 24.5% |
| French American Indians | 0.0 /100 | #294 | Tragic 24.6% |
| Hispanics or Latinos | 0.0 /100 | #295 | Tragic 24.6% |
| Africans | 0.0 /100 | #296 | Tragic 24.8% |
| Immigrants | Central America | 0.0 /100 | #297 | Tragic 24.8% |
| Yaqui | 0.0 /100 | #298 | Tragic 24.9% |
| Mexicans | 0.0 /100 | #299 | Tragic 25.0% |
| Blackfeet | 0.0 /100 | #300 | Tragic 25.1% |
| Hondurans | 0.0 /100 | #301 | Tragic 25.1% |
| Shoshone | 0.0 /100 | #302 | Tragic 25.1% |
| Somalis | 0.0 /100 | #303 | Tragic 25.2% |