Trinidadian and Tobagonian vs Immigrants from Yemen Female Poverty Among 18-24 Year Olds
COMPARE
Trinidadian and Tobagonian
Immigrants from Yemen
Female Poverty Among 18-24 Year Olds
Female Poverty Among 18-24 Year Olds Comparison
Trinidadians and Tobagonians
Immigrants from Yemen
19.8%
FEMALE POVERTY AMONG 18-24 YEAR OLDS
74.4/ 100
METRIC RATING
159th/ 347
METRIC RANK
27.5%
FEMALE POVERTY AMONG 18-24 YEAR OLDS
0.0/ 100
METRIC RATING
336th/ 347
METRIC RANK
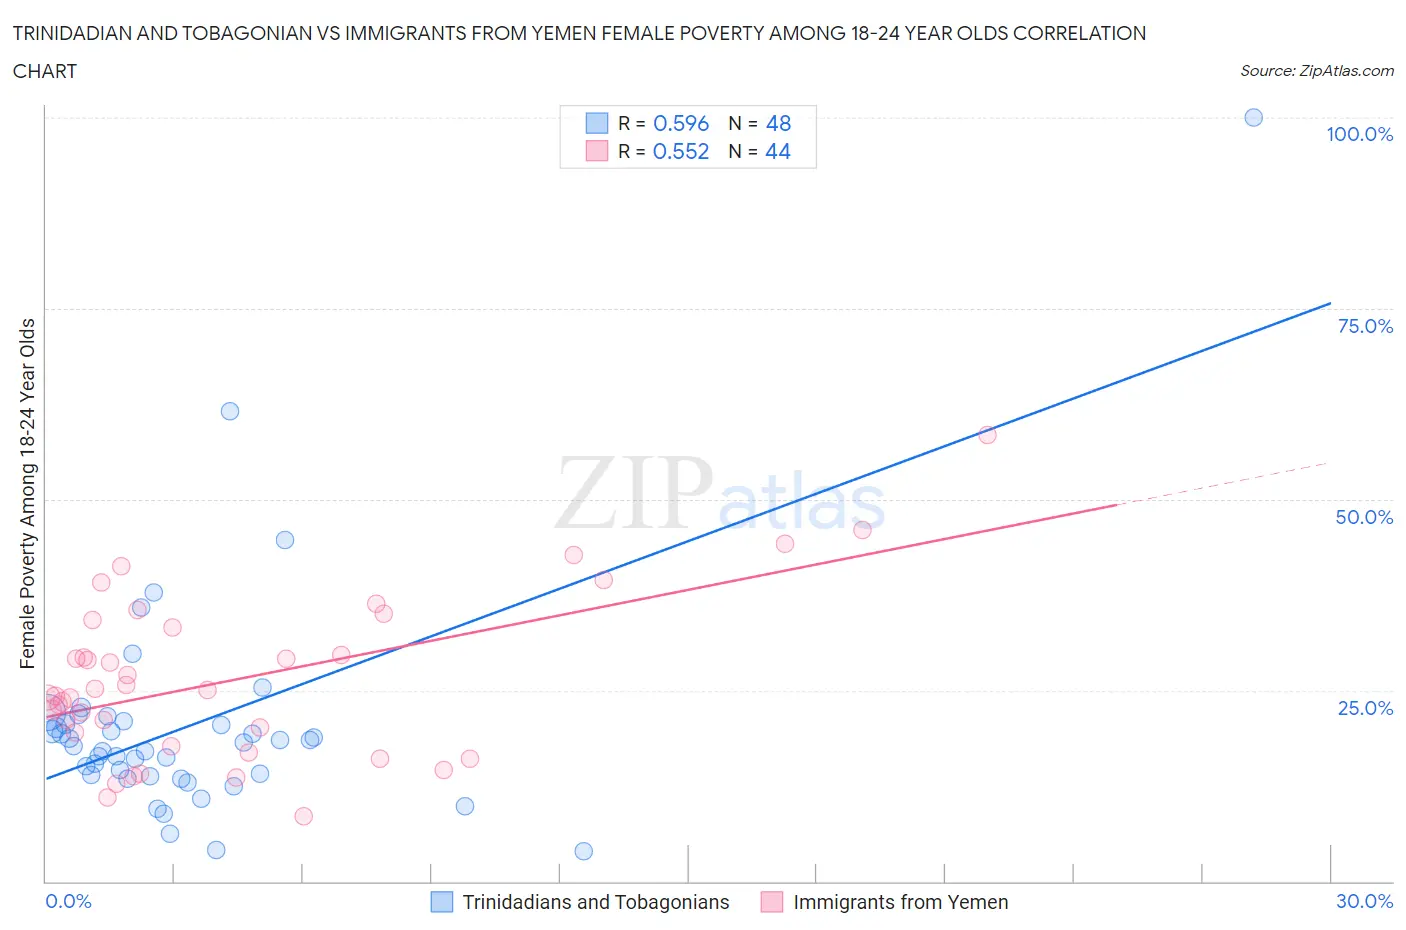
Trinidadian and Tobagonian vs Immigrants from Yemen Female Poverty Among 18-24 Year Olds Correlation Chart
The statistical analysis conducted on geographies consisting of 216,840,650 people shows a substantial positive correlation between the proportion of Trinidadians and Tobagonians and poverty level among females between the ages 18 and 24 in the United States with a correlation coefficient (R) of 0.596 and weighted average of 19.8%. Similarly, the statistical analysis conducted on geographies consisting of 82,141,466 people shows a substantial positive correlation between the proportion of Immigrants from Yemen and poverty level among females between the ages 18 and 24 in the United States with a correlation coefficient (R) of 0.552 and weighted average of 27.5%, a difference of 38.9%.
Female Poverty Among 18-24 Year Olds Correlation Summary
| Measurement | Trinidadian and Tobagonian | Immigrants from Yemen |
| Minimum | 3.9% | 8.5% |
| Maximum | 100.0% | 58.5% |
| Range | 96.1% | 49.9% |
| Mean | 20.5% | 26.4% |
| Median | 17.9% | 24.6% |
| Interquartile 25% (IQ1) | 13.8% | 18.6% |
| Interquartile 75% (IQ3) | 20.7% | 33.7% |
| Interquartile Range (IQR) | 6.9% | 15.1% |
| Standard Deviation (Sample) | 15.3% | 10.7% |
| Standard Deviation (Population) | 15.2% | 10.6% |
Similar Demographics by Female Poverty Among 18-24 Year Olds
Demographics Similar to Trinidadians and Tobagonians by Female Poverty Among 18-24 Year Olds
In terms of female poverty among 18-24 year olds, the demographic groups most similar to Trinidadians and Tobagonians are Pakistani (19.8%, a difference of 0.020%), Immigrants from Belize (19.8%, a difference of 0.020%), Immigrants from Lebanon (19.8%, a difference of 0.060%), Danish (19.8%, a difference of 0.070%), and French Canadian (19.9%, a difference of 0.090%).
| Demographics | Rating | Rank | Female Poverty Among 18-24 Year Olds |
| Yugoslavians | 79.0 /100 | #152 | Good 19.8% |
| Immigrants | Japan | 78.1 /100 | #153 | Good 19.8% |
| Immigrants | Zimbabwe | 76.7 /100 | #154 | Good 19.8% |
| Hungarians | 76.6 /100 | #155 | Good 19.8% |
| Immigrants | Belgium | 76.4 /100 | #156 | Good 19.8% |
| Danes | 75.5 /100 | #157 | Good 19.8% |
| Immigrants | Lebanon | 75.3 /100 | #158 | Good 19.8% |
| Trinidadians and Tobagonians | 74.4 /100 | #159 | Good 19.8% |
| Pakistanis | 74.1 /100 | #160 | Good 19.8% |
| Immigrants | Belize | 74.1 /100 | #161 | Good 19.8% |
| French Canadians | 73.0 /100 | #162 | Good 19.9% |
| Malaysians | 72.7 /100 | #163 | Good 19.9% |
| Central Americans | 70.0 /100 | #164 | Good 19.9% |
| Eastern Europeans | 69.3 /100 | #165 | Good 19.9% |
| Belgians | 69.1 /100 | #166 | Good 19.9% |
Demographics Similar to Immigrants from Yemen by Female Poverty Among 18-24 Year Olds
In terms of female poverty among 18-24 year olds, the demographic groups most similar to Immigrants from Yemen are Yup'ik (27.0%, a difference of 1.9%), Cheyenne (28.1%, a difference of 2.2%), Hopi (28.2%, a difference of 2.4%), Pueblo (26.9%, a difference of 2.4%), and Pima (28.4%, a difference of 3.1%).
| Demographics | Rating | Rank | Female Poverty Among 18-24 Year Olds |
| Cajuns | 0.0 /100 | #329 | Tragic 25.7% |
| Immigrants | Somalia | 0.0 /100 | #330 | Tragic 25.7% |
| Chippewa | 0.0 /100 | #331 | Tragic 25.9% |
| Houma | 0.0 /100 | #332 | Tragic 26.2% |
| Apache | 0.0 /100 | #333 | Tragic 26.3% |
| Pueblo | 0.0 /100 | #334 | Tragic 26.9% |
| Yup'ik | 0.0 /100 | #335 | Tragic 27.0% |
| Immigrants | Yemen | 0.0 /100 | #336 | Tragic 27.5% |
| Cheyenne | 0.0 /100 | #337 | Tragic 28.1% |
| Hopi | 0.0 /100 | #338 | Tragic 28.2% |
| Pima | 0.0 /100 | #339 | Tragic 28.4% |
| Sioux | 0.0 /100 | #340 | Tragic 28.6% |
| Colville | 0.0 /100 | #341 | Tragic 29.0% |
| Kiowa | 0.0 /100 | #342 | Tragic 29.2% |
| Puerto Ricans | 0.0 /100 | #343 | Tragic 29.8% |