Tohono O'odham vs Bangladeshi Female Poverty
COMPARE
Tohono O'odham
Bangladeshi
Female Poverty
Female Poverty Comparison
Tohono O'odham
Bangladeshis
25.9%
FEMALE POVERTY
0.0/ 100
METRIC RATING
347th/ 347
METRIC RANK
16.0%
FEMALE POVERTY
0.0/ 100
METRIC RATING
277th/ 347
METRIC RANK
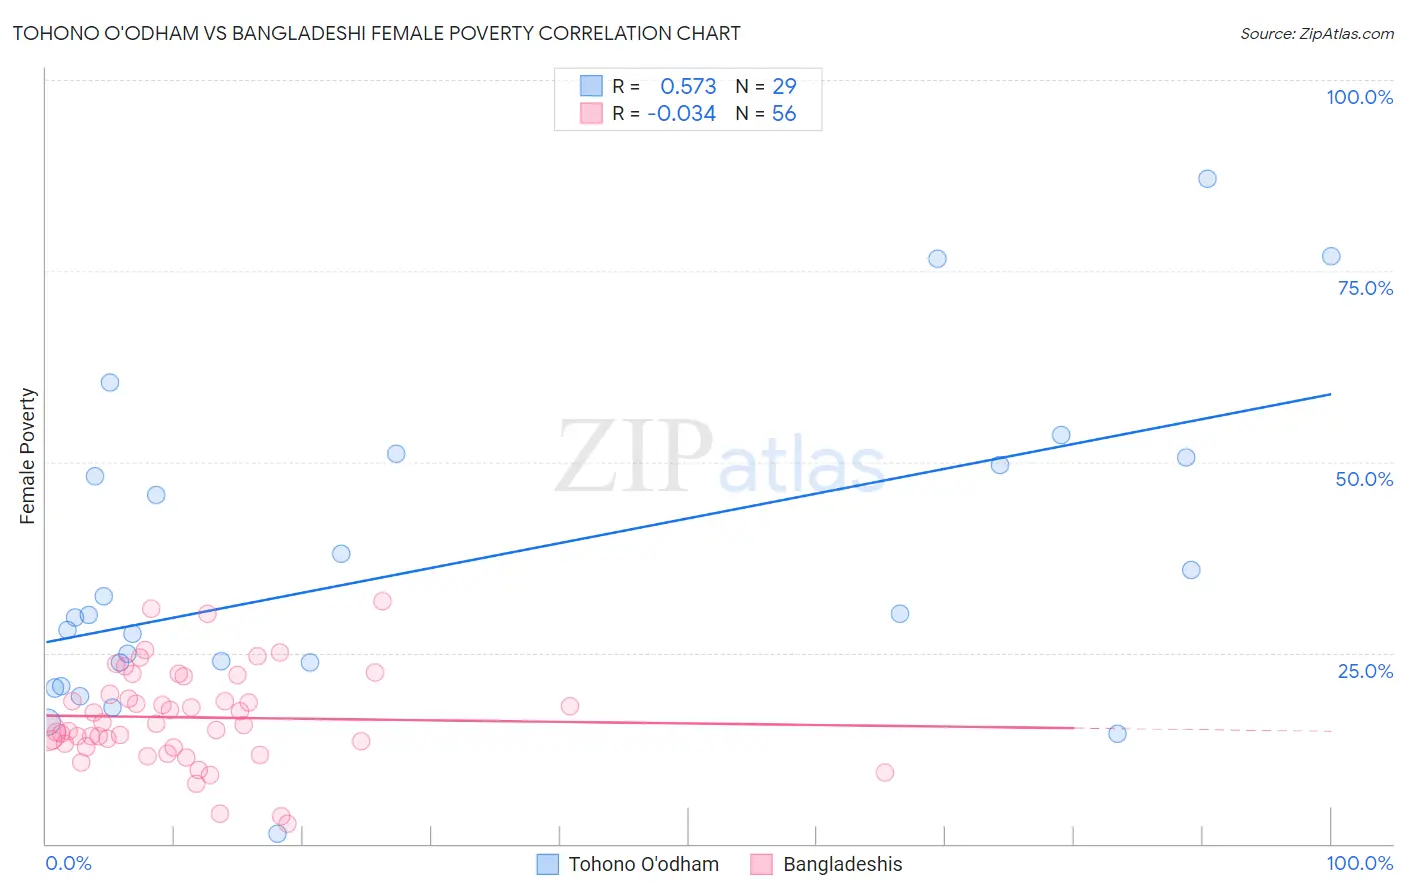
Tohono O'odham vs Bangladeshi Female Poverty Correlation Chart
The statistical analysis conducted on geographies consisting of 58,715,136 people shows a substantial positive correlation between the proportion of Tohono O'odham and poverty level among females in the United States with a correlation coefficient (R) of 0.573 and weighted average of 25.9%. Similarly, the statistical analysis conducted on geographies consisting of 141,353,886 people shows no correlation between the proportion of Bangladeshis and poverty level among females in the United States with a correlation coefficient (R) of -0.034 and weighted average of 16.0%, a difference of 62.1%.
Female Poverty Correlation Summary
| Measurement | Tohono O'odham | Bangladeshi |
| Minimum | 1.4% | 2.7% |
| Maximum | 87.1% | 31.7% |
| Range | 85.7% | 29.0% |
| Mean | 36.5% | 16.6% |
| Median | 30.0% | 15.6% |
| Interquartile 25% (IQ1) | 22.2% | 12.9% |
| Interquartile 75% (IQ3) | 50.0% | 20.7% |
| Interquartile Range (IQR) | 27.9% | 7.8% |
| Standard Deviation (Sample) | 20.4% | 6.3% |
| Standard Deviation (Population) | 20.1% | 6.2% |
Similar Demographics by Female Poverty
Demographics Similar to Tohono O'odham by Female Poverty
In terms of female poverty, the demographic groups most similar to Tohono O'odham are Puerto Rican (25.2%, a difference of 3.0%), Navajo (23.9%, a difference of 8.6%), Pima (23.6%, a difference of 10.0%), Lumbee (23.5%, a difference of 10.3%), and Immigrants from Yemen (22.8%, a difference of 13.6%).
| Demographics | Rating | Rank | Female Poverty |
| Immigrants | Dominican Republic | 0.0 /100 | #333 | Tragic 19.3% |
| Houma | 0.0 /100 | #334 | Tragic 20.0% |
| Cheyenne | 0.0 /100 | #335 | Tragic 20.2% |
| Pueblo | 0.0 /100 | #336 | Tragic 20.7% |
| Yuman | 0.0 /100 | #337 | Tragic 20.8% |
| Sioux | 0.0 /100 | #338 | Tragic 20.9% |
| Hopi | 0.0 /100 | #339 | Tragic 21.0% |
| Yup'ik | 0.0 /100 | #340 | Tragic 21.5% |
| Crow | 0.0 /100 | #341 | Tragic 22.1% |
| Immigrants | Yemen | 0.0 /100 | #342 | Tragic 22.8% |
| Lumbee | 0.0 /100 | #343 | Tragic 23.5% |
| Pima | 0.0 /100 | #344 | Tragic 23.6% |
| Navajo | 0.0 /100 | #345 | Tragic 23.9% |
| Puerto Ricans | 0.0 /100 | #346 | Tragic 25.2% |
| Tohono O'odham | 0.0 /100 | #347 | Tragic 25.9% |
Demographics Similar to Bangladeshis by Female Poverty
In terms of female poverty, the demographic groups most similar to Bangladeshis are Central American (16.0%, a difference of 0.19%), Immigrants from Barbados (16.0%, a difference of 0.31%), Immigrants from West Indies (16.1%, a difference of 0.31%), Haitian (15.9%, a difference of 0.38%), and Barbadian (15.9%, a difference of 0.38%).
| Demographics | Rating | Rank | Female Poverty |
| Chickasaw | 0.1 /100 | #270 | Tragic 15.9% |
| Immigrants | St. Vincent and the Grenadines | 0.0 /100 | #271 | Tragic 15.9% |
| Belizeans | 0.0 /100 | #272 | Tragic 15.9% |
| Haitians | 0.0 /100 | #273 | Tragic 15.9% |
| Barbadians | 0.0 /100 | #274 | Tragic 15.9% |
| Immigrants | Barbados | 0.0 /100 | #275 | Tragic 16.0% |
| Central Americans | 0.0 /100 | #276 | Tragic 16.0% |
| Bangladeshis | 0.0 /100 | #277 | Tragic 16.0% |
| Immigrants | West Indies | 0.0 /100 | #278 | Tragic 16.1% |
| Immigrants | Bahamas | 0.0 /100 | #279 | Tragic 16.1% |
| Vietnamese | 0.0 /100 | #280 | Tragic 16.1% |
| West Indians | 0.0 /100 | #281 | Tragic 16.1% |
| Immigrants | Haiti | 0.0 /100 | #282 | Tragic 16.1% |
| Immigrants | Cuba | 0.0 /100 | #283 | Tragic 16.1% |
| Spanish Americans | 0.0 /100 | #284 | Tragic 16.2% |