Tlingit-Haida vs Cape Verdean Family Poverty
COMPARE
Tlingit-Haida
Cape Verdean
Family Poverty
Family Poverty Comparison
Tlingit-Haida
Cape Verdeans
8.0%
FAMILY POVERTY
96.7/ 100
METRIC RATING
93rd/ 347
METRIC RANK
10.9%
FAMILY POVERTY
0.1/ 100
METRIC RATING
263rd/ 347
METRIC RANK
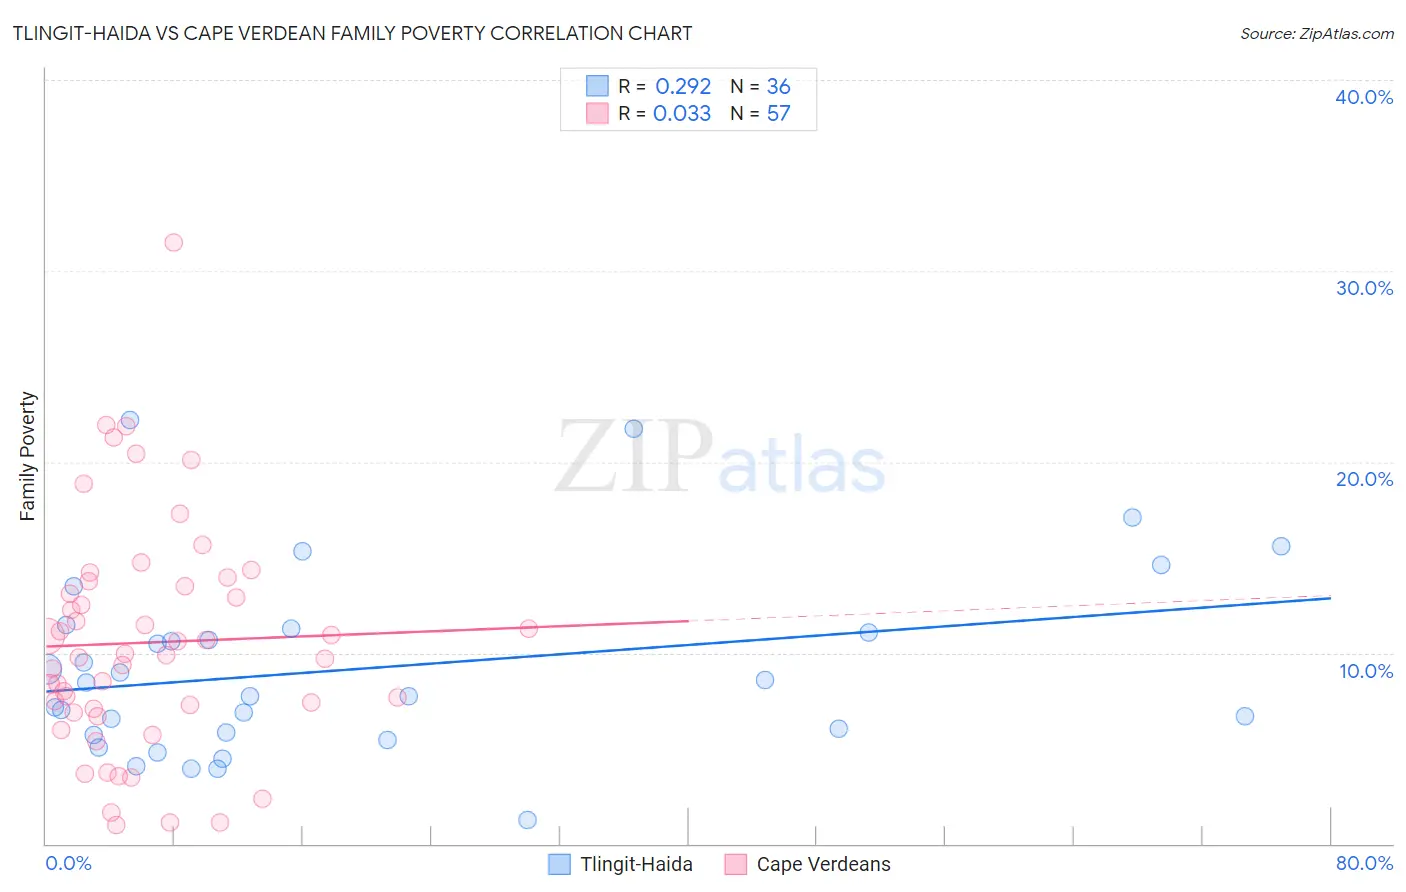
Tlingit-Haida vs Cape Verdean Family Poverty Correlation Chart
The statistical analysis conducted on geographies consisting of 60,804,034 people shows a weak positive correlation between the proportion of Tlingit-Haida and poverty level among families in the United States with a correlation coefficient (R) of 0.292 and weighted average of 8.0%. Similarly, the statistical analysis conducted on geographies consisting of 107,439,266 people shows no correlation between the proportion of Cape Verdeans and poverty level among families in the United States with a correlation coefficient (R) of 0.033 and weighted average of 10.9%, a difference of 36.5%.
Family Poverty Correlation Summary
| Measurement | Tlingit-Haida | Cape Verdean |
| Minimum | 1.3% | 0.95% |
| Maximum | 22.2% | 31.5% |
| Range | 21.0% | 30.5% |
| Mean | 9.2% | 10.5% |
| Median | 8.1% | 9.9% |
| Interquartile 25% (IQ1) | 5.8% | 7.0% |
| Interquartile 75% (IQ3) | 11.2% | 13.6% |
| Interquartile Range (IQR) | 5.4% | 6.6% |
| Standard Deviation (Sample) | 4.8% | 6.0% |
| Standard Deviation (Population) | 4.8% | 6.0% |
Similar Demographics by Family Poverty
Demographics Similar to Tlingit-Haida by Family Poverty
In terms of family poverty, the demographic groups most similar to Tlingit-Haida are Immigrants from Pakistan (8.0%, a difference of 0.11%), Immigrants from Philippines (8.0%, a difference of 0.12%), Immigrants from Turkey (8.0%, a difference of 0.14%), Czechoslovakian (8.0%, a difference of 0.18%), and Immigrants from Italy (8.0%, a difference of 0.42%).
| Demographics | Rating | Rank | Family Poverty |
| Scottish | 97.3 /100 | #86 | Exceptional 7.9% |
| Belgians | 97.3 /100 | #87 | Exceptional 8.0% |
| Serbians | 97.2 /100 | #88 | Exceptional 8.0% |
| Immigrants | Denmark | 97.1 /100 | #89 | Exceptional 8.0% |
| Immigrants | England | 97.1 /100 | #90 | Exceptional 8.0% |
| Immigrants | Italy | 97.0 /100 | #91 | Exceptional 8.0% |
| Czechoslovakians | 96.8 /100 | #92 | Exceptional 8.0% |
| Tlingit-Haida | 96.7 /100 | #93 | Exceptional 8.0% |
| Immigrants | Pakistan | 96.6 /100 | #94 | Exceptional 8.0% |
| Immigrants | Philippines | 96.5 /100 | #95 | Exceptional 8.0% |
| Immigrants | Turkey | 96.5 /100 | #96 | Exceptional 8.0% |
| Immigrants | Switzerland | 96.1 /100 | #97 | Exceptional 8.1% |
| Immigrants | South Africa | 95.9 /100 | #98 | Exceptional 8.1% |
| Welsh | 95.8 /100 | #99 | Exceptional 8.1% |
| New Zealanders | 95.8 /100 | #100 | Exceptional 8.1% |
Demographics Similar to Cape Verdeans by Family Poverty
In terms of family poverty, the demographic groups most similar to Cape Verdeans are Trinidadian and Tobagonian (10.9%, a difference of 0.020%), Immigrants from Trinidad and Tobago (10.9%, a difference of 0.070%), Spanish American Indian (10.9%, a difference of 0.26%), Shoshone (10.9%, a difference of 0.39%), and Bangladeshi (10.9%, a difference of 0.43%).
| Demographics | Rating | Rank | Family Poverty |
| Chickasaw | 0.2 /100 | #256 | Tragic 10.8% |
| Immigrants | Ghana | 0.2 /100 | #257 | Tragic 10.8% |
| Sub-Saharan Africans | 0.2 /100 | #258 | Tragic 10.9% |
| Mexican American Indians | 0.2 /100 | #259 | Tragic 10.9% |
| Bangladeshis | 0.2 /100 | #260 | Tragic 10.9% |
| Shoshone | 0.2 /100 | #261 | Tragic 10.9% |
| Spanish American Indians | 0.2 /100 | #262 | Tragic 10.9% |
| Cape Verdeans | 0.1 /100 | #263 | Tragic 10.9% |
| Trinidadians and Tobagonians | 0.1 /100 | #264 | Tragic 10.9% |
| Immigrants | Trinidad and Tobago | 0.1 /100 | #265 | Tragic 10.9% |
| Immigrants | El Salvador | 0.1 /100 | #266 | Tragic 11.0% |
| Comanche | 0.1 /100 | #267 | Tragic 11.0% |
| Jamaicans | 0.1 /100 | #268 | Tragic 11.1% |
| Immigrants | Ecuador | 0.1 /100 | #269 | Tragic 11.1% |
| Immigrants | Nicaragua | 0.1 /100 | #270 | Tragic 11.1% |