Tlingit-Haida vs Immigrants from Israel Family Poverty
COMPARE
Tlingit-Haida
Immigrants from Israel
Family Poverty
Family Poverty Comparison
Tlingit-Haida
Immigrants from Israel
8.0%
FAMILY POVERTY
96.7/ 100
METRIC RATING
93rd/ 347
METRIC RANK
8.2%
FAMILY POVERTY
93.5/ 100
METRIC RATING
115th/ 347
METRIC RANK
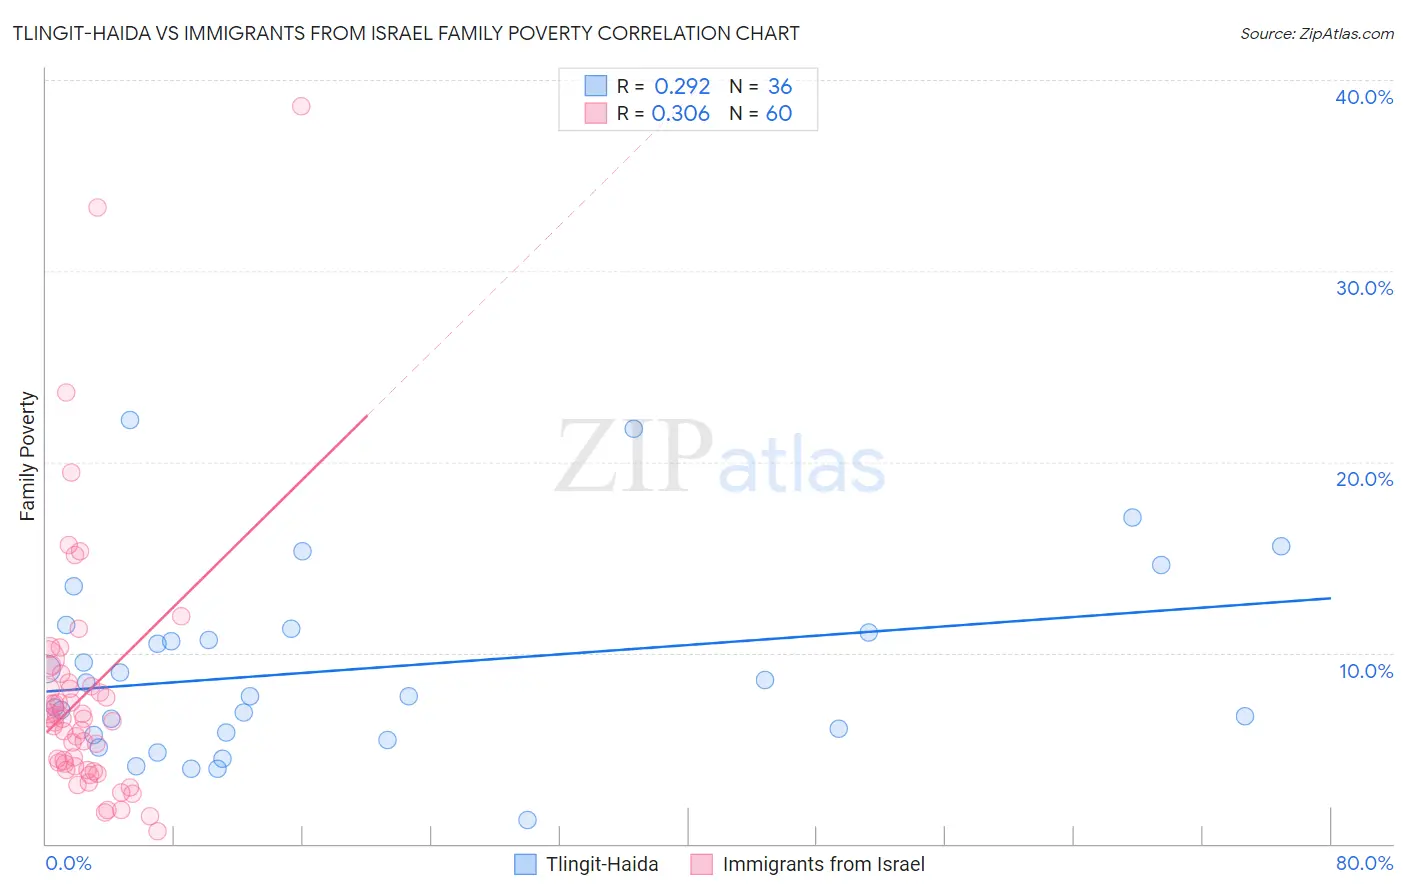
Tlingit-Haida vs Immigrants from Israel Family Poverty Correlation Chart
The statistical analysis conducted on geographies consisting of 60,804,034 people shows a weak positive correlation between the proportion of Tlingit-Haida and poverty level among families in the United States with a correlation coefficient (R) of 0.292 and weighted average of 8.0%. Similarly, the statistical analysis conducted on geographies consisting of 209,738,348 people shows a mild positive correlation between the proportion of Immigrants from Israel and poverty level among families in the United States with a correlation coefficient (R) of 0.306 and weighted average of 8.2%, a difference of 2.6%.
Family Poverty Correlation Summary
| Measurement | Tlingit-Haida | Immigrants from Israel |
| Minimum | 1.3% | 0.67% |
| Maximum | 22.2% | 38.6% |
| Range | 21.0% | 37.9% |
| Mean | 9.2% | 7.8% |
| Median | 8.1% | 6.5% |
| Interquartile 25% (IQ1) | 5.8% | 4.0% |
| Interquartile 75% (IQ3) | 11.2% | 8.3% |
| Interquartile Range (IQR) | 5.4% | 4.4% |
| Standard Deviation (Sample) | 4.8% | 6.8% |
| Standard Deviation (Population) | 4.8% | 6.7% |
Similar Demographics by Family Poverty
Demographics Similar to Tlingit-Haida by Family Poverty
In terms of family poverty, the demographic groups most similar to Tlingit-Haida are Immigrants from Pakistan (8.0%, a difference of 0.11%), Immigrants from Philippines (8.0%, a difference of 0.12%), Immigrants from Turkey (8.0%, a difference of 0.14%), Czechoslovakian (8.0%, a difference of 0.18%), and Immigrants from Italy (8.0%, a difference of 0.42%).
| Demographics | Rating | Rank | Family Poverty |
| Scottish | 97.3 /100 | #86 | Exceptional 7.9% |
| Belgians | 97.3 /100 | #87 | Exceptional 8.0% |
| Serbians | 97.2 /100 | #88 | Exceptional 8.0% |
| Immigrants | Denmark | 97.1 /100 | #89 | Exceptional 8.0% |
| Immigrants | England | 97.1 /100 | #90 | Exceptional 8.0% |
| Immigrants | Italy | 97.0 /100 | #91 | Exceptional 8.0% |
| Czechoslovakians | 96.8 /100 | #92 | Exceptional 8.0% |
| Tlingit-Haida | 96.7 /100 | #93 | Exceptional 8.0% |
| Immigrants | Pakistan | 96.6 /100 | #94 | Exceptional 8.0% |
| Immigrants | Philippines | 96.5 /100 | #95 | Exceptional 8.0% |
| Immigrants | Turkey | 96.5 /100 | #96 | Exceptional 8.0% |
| Immigrants | Switzerland | 96.1 /100 | #97 | Exceptional 8.1% |
| Immigrants | South Africa | 95.9 /100 | #98 | Exceptional 8.1% |
| Welsh | 95.8 /100 | #99 | Exceptional 8.1% |
| New Zealanders | 95.8 /100 | #100 | Exceptional 8.1% |
Demographics Similar to Immigrants from Israel by Family Poverty
In terms of family poverty, the demographic groups most similar to Immigrants from Israel are South African (8.2%, a difference of 0.060%), Immigrants from Russia (8.2%, a difference of 0.13%), Immigrants from Western Europe (8.2%, a difference of 0.32%), Immigrants from Zimbabwe (8.2%, a difference of 0.34%), and French (8.3%, a difference of 0.39%).
| Demographics | Rating | Rank | Family Poverty |
| Basques | 94.9 /100 | #108 | Exceptional 8.1% |
| Jordanians | 94.8 /100 | #109 | Exceptional 8.2% |
| Romanians | 94.7 /100 | #110 | Exceptional 8.2% |
| Taiwanese | 94.6 /100 | #111 | Exceptional 8.2% |
| Immigrants | France | 94.4 /100 | #112 | Exceptional 8.2% |
| Canadians | 94.2 /100 | #113 | Exceptional 8.2% |
| Immigrants | Zimbabwe | 94.0 /100 | #114 | Exceptional 8.2% |
| Immigrants | Israel | 93.5 /100 | #115 | Exceptional 8.2% |
| South Africans | 93.4 /100 | #116 | Exceptional 8.2% |
| Immigrants | Russia | 93.2 /100 | #117 | Exceptional 8.2% |
| Immigrants | Western Europe | 92.9 /100 | #118 | Exceptional 8.2% |
| French | 92.8 /100 | #119 | Exceptional 8.3% |
| Immigrants | Egypt | 91.6 /100 | #120 | Exceptional 8.3% |
| Native Hawaiians | 91.3 /100 | #121 | Exceptional 8.3% |
| Paraguayans | 91.2 /100 | #122 | Exceptional 8.3% |