Swedish vs Immigrants from El Salvador Female Poverty
COMPARE
Swedish
Immigrants from El Salvador
Female Poverty
Female Poverty Comparison
Swedes
Immigrants from El Salvador
11.6%
FEMALE POVERTY
99.7/ 100
METRIC RATING
22nd/ 347
METRIC RANK
15.7%
FEMALE POVERTY
0.1/ 100
METRIC RATING
266th/ 347
METRIC RANK
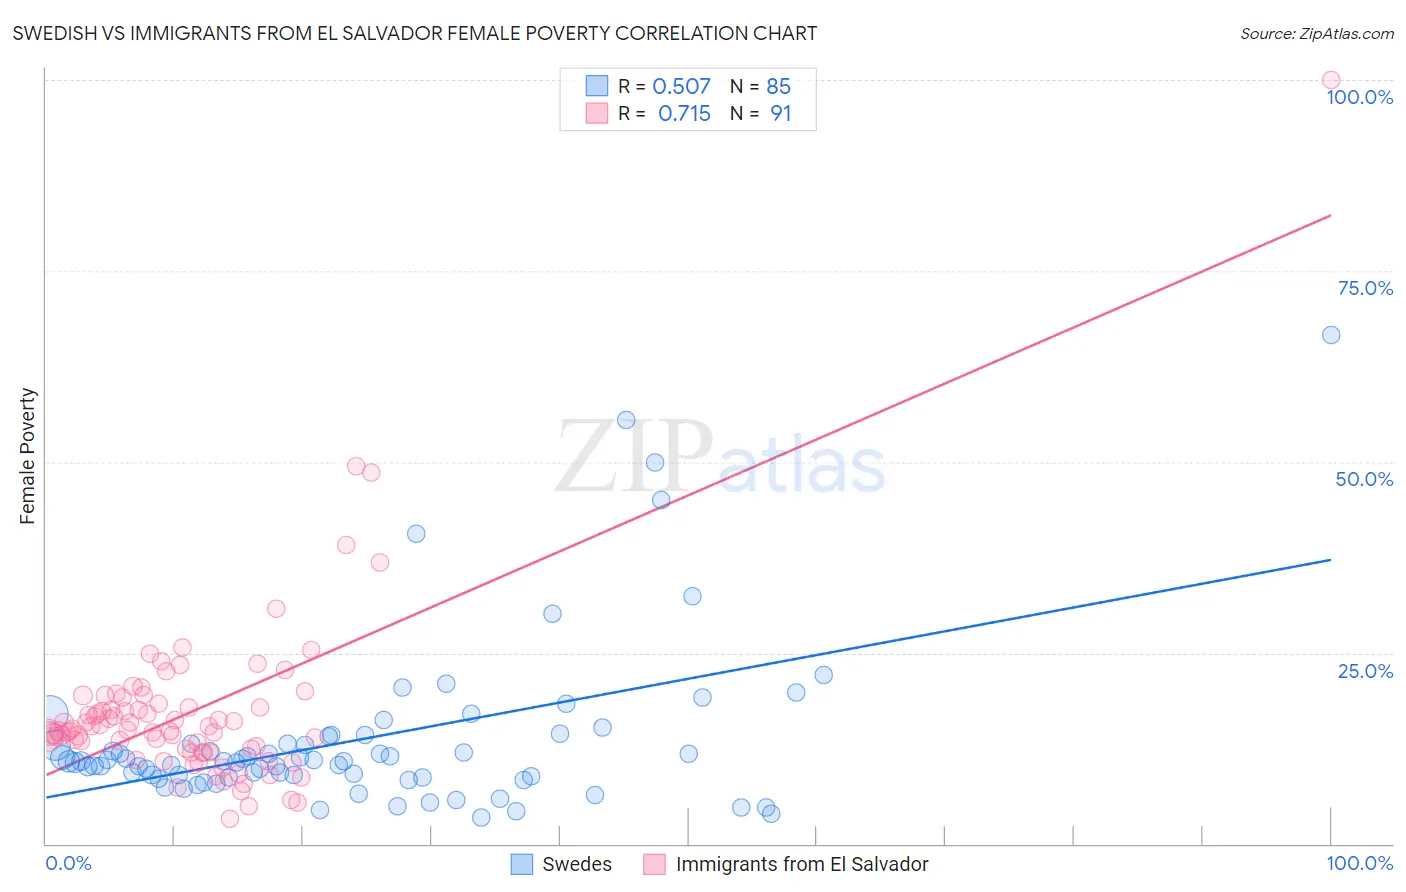
Swedish vs Immigrants from El Salvador Female Poverty Correlation Chart
The statistical analysis conducted on geographies consisting of 538,313,222 people shows a substantial positive correlation between the proportion of Swedes and poverty level among females in the United States with a correlation coefficient (R) of 0.507 and weighted average of 11.6%. Similarly, the statistical analysis conducted on geographies consisting of 357,675,141 people shows a strong positive correlation between the proportion of Immigrants from El Salvador and poverty level among females in the United States with a correlation coefficient (R) of 0.715 and weighted average of 15.7%, a difference of 35.3%.
Female Poverty Correlation Summary
| Measurement | Swedish | Immigrants from El Salvador |
| Minimum | 3.4% | 3.3% |
| Maximum | 66.7% | 100.0% |
| Range | 63.3% | 96.7% |
| Mean | 13.6% | 17.2% |
| Median | 10.8% | 14.8% |
| Interquartile 25% (IQ1) | 8.7% | 12.0% |
| Interquartile 75% (IQ3) | 13.6% | 18.3% |
| Interquartile Range (IQR) | 5.0% | 6.3% |
| Standard Deviation (Sample) | 11.0% | 11.7% |
| Standard Deviation (Population) | 10.9% | 11.6% |
Similar Demographics by Female Poverty
Demographics Similar to Swedes by Female Poverty
In terms of female poverty, the demographic groups most similar to Swedes are Italian (11.6%, a difference of 0.030%), Burmese (11.6%, a difference of 0.14%), Luxembourger (11.6%, a difference of 0.16%), Immigrants from Northern Europe (11.6%, a difference of 0.42%), and Croatian (11.6%, a difference of 0.43%).
| Demographics | Rating | Rank | Female Poverty |
| Latvians | 99.8 /100 | #15 | Exceptional 11.4% |
| Immigrants | Bolivia | 99.8 /100 | #16 | Exceptional 11.5% |
| Bolivians | 99.8 /100 | #17 | Exceptional 11.5% |
| Immigrants | Scotland | 99.8 /100 | #18 | Exceptional 11.5% |
| Norwegians | 99.8 /100 | #19 | Exceptional 11.5% |
| Eastern Europeans | 99.7 /100 | #20 | Exceptional 11.5% |
| Italians | 99.7 /100 | #21 | Exceptional 11.6% |
| Swedes | 99.7 /100 | #22 | Exceptional 11.6% |
| Burmese | 99.7 /100 | #23 | Exceptional 11.6% |
| Luxembourgers | 99.7 /100 | #24 | Exceptional 11.6% |
| Immigrants | Northern Europe | 99.6 /100 | #25 | Exceptional 11.6% |
| Croatians | 99.6 /100 | #26 | Exceptional 11.6% |
| Iranians | 99.6 /100 | #27 | Exceptional 11.7% |
| Immigrants | Korea | 99.6 /100 | #28 | Exceptional 11.7% |
| Immigrants | North Macedonia | 99.6 /100 | #29 | Exceptional 11.7% |
Demographics Similar to Immigrants from El Salvador by Female Poverty
In terms of female poverty, the demographic groups most similar to Immigrants from El Salvador are Immigrants from Liberia (15.7%, a difference of 0.060%), Immigrants from Ecuador (15.6%, a difference of 0.36%), Subsaharan African (15.8%, a difference of 0.43%), Cherokee (15.6%, a difference of 0.49%), and Immigrants from Nicaragua (15.8%, a difference of 0.49%).
| Demographics | Rating | Rank | Female Poverty |
| Cape Verdeans | 0.1 /100 | #259 | Tragic 15.6% |
| Immigrants | Guyana | 0.1 /100 | #260 | Tragic 15.6% |
| Guyanese | 0.1 /100 | #261 | Tragic 15.6% |
| Mexican American Indians | 0.1 /100 | #262 | Tragic 15.6% |
| Cherokee | 0.1 /100 | #263 | Tragic 15.6% |
| Immigrants | Ecuador | 0.1 /100 | #264 | Tragic 15.6% |
| Immigrants | Liberia | 0.1 /100 | #265 | Tragic 15.7% |
| Immigrants | El Salvador | 0.1 /100 | #266 | Tragic 15.7% |
| Sub-Saharan Africans | 0.1 /100 | #267 | Tragic 15.8% |
| Immigrants | Nicaragua | 0.1 /100 | #268 | Tragic 15.8% |
| Iroquois | 0.1 /100 | #269 | Tragic 15.8% |
| Chickasaw | 0.1 /100 | #270 | Tragic 15.9% |
| Immigrants | St. Vincent and the Grenadines | 0.0 /100 | #271 | Tragic 15.9% |
| Belizeans | 0.0 /100 | #272 | Tragic 15.9% |
| Haitians | 0.0 /100 | #273 | Tragic 15.9% |