Sudanese vs Immigrants from Denmark Female Poverty Among 25-34 Year Olds
COMPARE
Sudanese
Immigrants from Denmark
Female Poverty Among 25-34 Year Olds
Female Poverty Among 25-34 Year Olds Comparison
Sudanese
Immigrants from Denmark
14.4%
FEMALE POVERTY AMONG 25-34 YEAR OLDS
4.4/ 100
METRIC RATING
221st/ 347
METRIC RANK
12.7%
FEMALE POVERTY AMONG 25-34 YEAR OLDS
95.7/ 100
METRIC RATING
100th/ 347
METRIC RANK
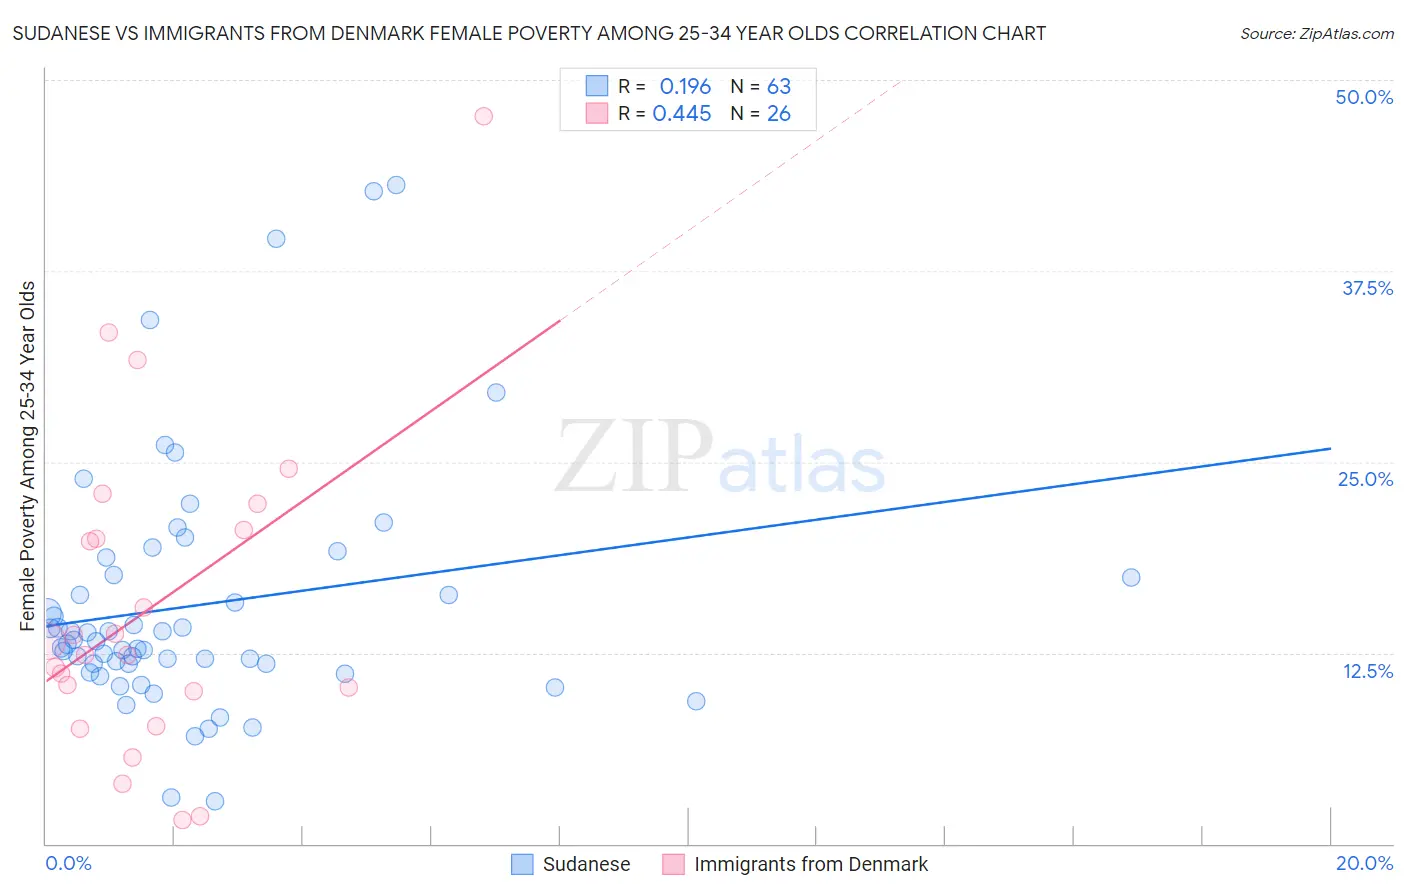
Sudanese vs Immigrants from Denmark Female Poverty Among 25-34 Year Olds Correlation Chart
The statistical analysis conducted on geographies consisting of 109,802,795 people shows a poor positive correlation between the proportion of Sudanese and poverty level among females between the ages 25 and 34 in the United States with a correlation coefficient (R) of 0.196 and weighted average of 14.4%. Similarly, the statistical analysis conducted on geographies consisting of 135,261,162 people shows a moderate positive correlation between the proportion of Immigrants from Denmark and poverty level among females between the ages 25 and 34 in the United States with a correlation coefficient (R) of 0.445 and weighted average of 12.7%, a difference of 13.7%.
Female Poverty Among 25-34 Year Olds Correlation Summary
| Measurement | Sudanese | Immigrants from Denmark |
| Minimum | 2.8% | 1.5% |
| Maximum | 43.1% | 47.6% |
| Range | 40.3% | 46.1% |
| Mean | 15.6% | 15.6% |
| Median | 13.3% | 12.8% |
| Interquartile 25% (IQ1) | 11.7% | 10.0% |
| Interquartile 75% (IQ3) | 17.6% | 20.6% |
| Interquartile Range (IQR) | 5.8% | 10.6% |
| Standard Deviation (Sample) | 8.1% | 10.5% |
| Standard Deviation (Population) | 8.1% | 10.3% |
Similar Demographics by Female Poverty Among 25-34 Year Olds
Demographics Similar to Sudanese by Female Poverty Among 25-34 Year Olds
In terms of female poverty among 25-34 year olds, the demographic groups most similar to Sudanese are Immigrants from Portugal (14.4%, a difference of 0.070%), Nigerian (14.4%, a difference of 0.13%), Ghanaian (14.4%, a difference of 0.15%), Immigrants from Sudan (14.4%, a difference of 0.20%), and Immigrants from Thailand (14.3%, a difference of 0.32%).
| Demographics | Rating | Rank | Female Poverty Among 25-34 Year Olds |
| French | 6.2 /100 | #214 | Tragic 14.3% |
| Immigrants | Nigeria | 6.2 /100 | #215 | Tragic 14.3% |
| French Canadians | 5.5 /100 | #216 | Tragic 14.3% |
| Spanish American Indians | 5.5 /100 | #217 | Tragic 14.3% |
| Immigrants | Thailand | 5.2 /100 | #218 | Tragic 14.3% |
| Ecuadorians | 5.2 /100 | #219 | Tragic 14.3% |
| Ghanaians | 4.8 /100 | #220 | Tragic 14.4% |
| Sudanese | 4.4 /100 | #221 | Tragic 14.4% |
| Immigrants | Portugal | 4.3 /100 | #222 | Tragic 14.4% |
| Nigerians | 4.2 /100 | #223 | Tragic 14.4% |
| Immigrants | Sudan | 4.0 /100 | #224 | Tragic 14.4% |
| Immigrants | Barbados | 3.4 /100 | #225 | Tragic 14.5% |
| Nicaraguans | 3.3 /100 | #226 | Tragic 14.5% |
| Celtics | 2.8 /100 | #227 | Tragic 14.5% |
| Vietnamese | 2.6 /100 | #228 | Tragic 14.6% |
Demographics Similar to Immigrants from Denmark by Female Poverty Among 25-34 Year Olds
In terms of female poverty among 25-34 year olds, the demographic groups most similar to Immigrants from Denmark are Immigrants from Switzerland (12.7%, a difference of 0.020%), Peruvian (12.7%, a difference of 0.080%), Immigrants from Spain (12.7%, a difference of 0.14%), Swedish (12.7%, a difference of 0.19%), and Immigrants from South Africa (12.7%, a difference of 0.24%).
| Demographics | Rating | Rank | Female Poverty Among 25-34 Year Olds |
| Palestinians | 96.9 /100 | #93 | Exceptional 12.6% |
| Immigrants | France | 96.8 /100 | #94 | Exceptional 12.6% |
| Ukrainians | 96.7 /100 | #95 | Exceptional 12.6% |
| Immigrants | Zimbabwe | 96.7 /100 | #96 | Exceptional 12.6% |
| Immigrants | Northern Africa | 96.6 /100 | #97 | Exceptional 12.6% |
| Immigrants | Ethiopia | 96.5 /100 | #98 | Exceptional 12.6% |
| Immigrants | Argentina | 96.4 /100 | #99 | Exceptional 12.6% |
| Immigrants | Denmark | 95.7 /100 | #100 | Exceptional 12.7% |
| Immigrants | Switzerland | 95.7 /100 | #101 | Exceptional 12.7% |
| Peruvians | 95.6 /100 | #102 | Exceptional 12.7% |
| Immigrants | Spain | 95.5 /100 | #103 | Exceptional 12.7% |
| Swedes | 95.4 /100 | #104 | Exceptional 12.7% |
| Immigrants | South Africa | 95.3 /100 | #105 | Exceptional 12.7% |
| Tsimshian | 95.1 /100 | #106 | Exceptional 12.7% |
| Poles | 94.9 /100 | #107 | Exceptional 12.7% |