Sudanese vs Arab Female Poverty Among 25-34 Year Olds
COMPARE
Sudanese
Arab
Female Poverty Among 25-34 Year Olds
Female Poverty Among 25-34 Year Olds Comparison
Sudanese
Arabs
14.4%
FEMALE POVERTY AMONG 25-34 YEAR OLDS
4.4/ 100
METRIC RATING
221st/ 347
METRIC RANK
13.2%
FEMALE POVERTY AMONG 25-34 YEAR OLDS
73.5/ 100
METRIC RATING
154th/ 347
METRIC RANK
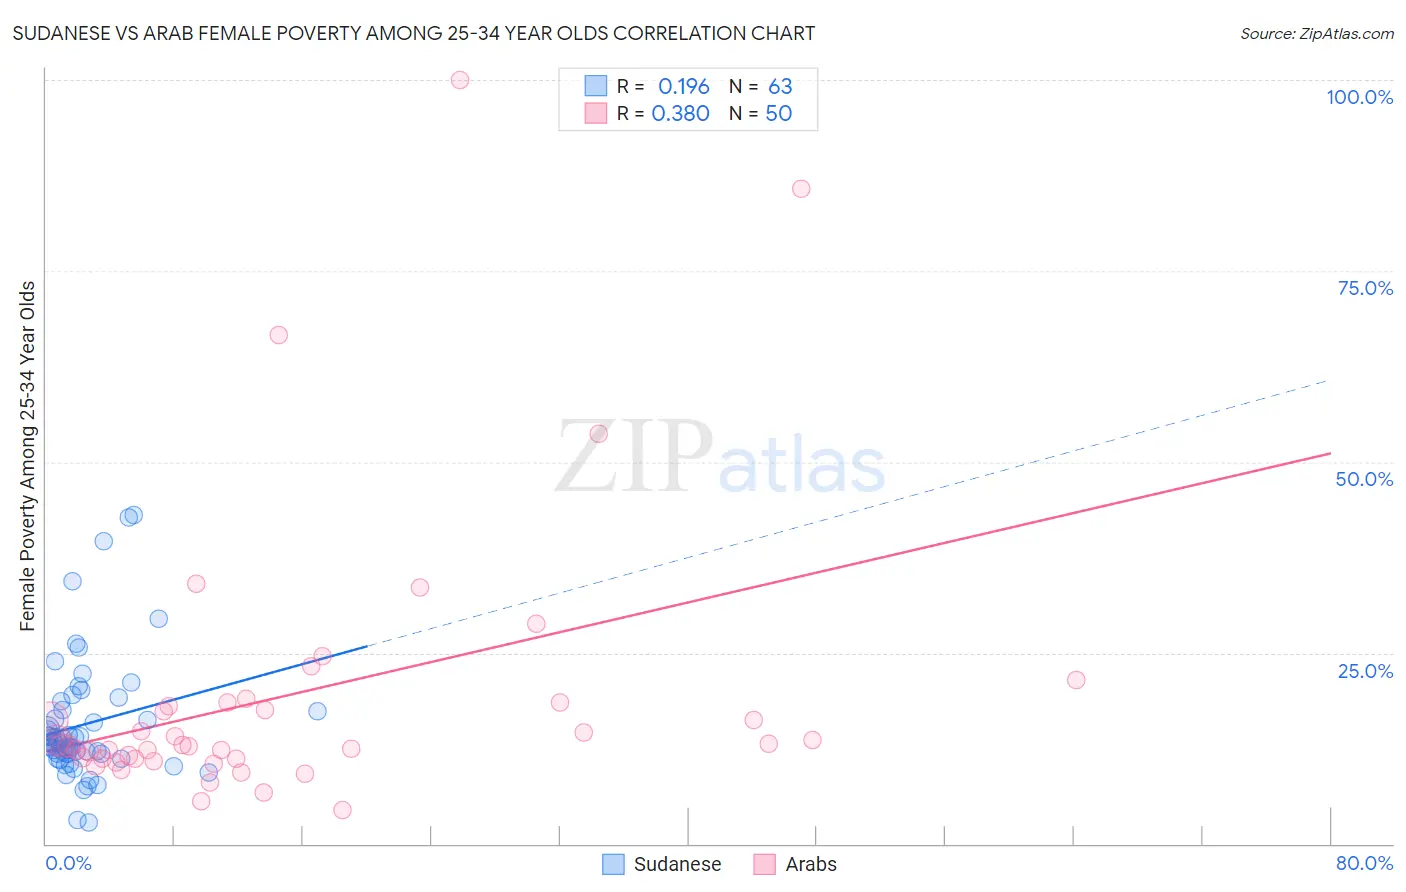
Sudanese vs Arab Female Poverty Among 25-34 Year Olds Correlation Chart
The statistical analysis conducted on geographies consisting of 109,802,795 people shows a poor positive correlation between the proportion of Sudanese and poverty level among females between the ages 25 and 34 in the United States with a correlation coefficient (R) of 0.196 and weighted average of 14.4%. Similarly, the statistical analysis conducted on geographies consisting of 475,444,575 people shows a mild positive correlation between the proportion of Arabs and poverty level among females between the ages 25 and 34 in the United States with a correlation coefficient (R) of 0.380 and weighted average of 13.2%, a difference of 8.7%.
Female Poverty Among 25-34 Year Olds Correlation Summary
| Measurement | Sudanese | Arab |
| Minimum | 2.8% | 4.3% |
| Maximum | 43.1% | 100.0% |
| Range | 40.3% | 95.7% |
| Mean | 15.6% | 19.5% |
| Median | 13.3% | 12.8% |
| Interquartile 25% (IQ1) | 11.7% | 11.1% |
| Interquartile 75% (IQ3) | 17.6% | 18.4% |
| Interquartile Range (IQR) | 5.8% | 7.3% |
| Standard Deviation (Sample) | 8.1% | 18.7% |
| Standard Deviation (Population) | 8.1% | 18.5% |
Similar Demographics by Female Poverty Among 25-34 Year Olds
Demographics Similar to Sudanese by Female Poverty Among 25-34 Year Olds
In terms of female poverty among 25-34 year olds, the demographic groups most similar to Sudanese are Immigrants from Portugal (14.4%, a difference of 0.070%), Nigerian (14.4%, a difference of 0.13%), Ghanaian (14.4%, a difference of 0.15%), Immigrants from Sudan (14.4%, a difference of 0.20%), and Immigrants from Thailand (14.3%, a difference of 0.32%).
| Demographics | Rating | Rank | Female Poverty Among 25-34 Year Olds |
| French | 6.2 /100 | #214 | Tragic 14.3% |
| Immigrants | Nigeria | 6.2 /100 | #215 | Tragic 14.3% |
| French Canadians | 5.5 /100 | #216 | Tragic 14.3% |
| Spanish American Indians | 5.5 /100 | #217 | Tragic 14.3% |
| Immigrants | Thailand | 5.2 /100 | #218 | Tragic 14.3% |
| Ecuadorians | 5.2 /100 | #219 | Tragic 14.3% |
| Ghanaians | 4.8 /100 | #220 | Tragic 14.4% |
| Sudanese | 4.4 /100 | #221 | Tragic 14.4% |
| Immigrants | Portugal | 4.3 /100 | #222 | Tragic 14.4% |
| Nigerians | 4.2 /100 | #223 | Tragic 14.4% |
| Immigrants | Sudan | 4.0 /100 | #224 | Tragic 14.4% |
| Immigrants | Barbados | 3.4 /100 | #225 | Tragic 14.5% |
| Nicaraguans | 3.3 /100 | #226 | Tragic 14.5% |
| Celtics | 2.8 /100 | #227 | Tragic 14.5% |
| Vietnamese | 2.6 /100 | #228 | Tragic 14.6% |
Demographics Similar to Arabs by Female Poverty Among 25-34 Year Olds
In terms of female poverty among 25-34 year olds, the demographic groups most similar to Arabs are Northern European (13.2%, a difference of 0.020%), Immigrants from Sierra Leone (13.3%, a difference of 0.070%), Immigrants from Cameroon (13.3%, a difference of 0.16%), Slavic (13.2%, a difference of 0.25%), and Costa Rican (13.2%, a difference of 0.26%).
| Demographics | Rating | Rank | Female Poverty Among 25-34 Year Olds |
| Europeans | 76.8 /100 | #147 | Good 13.2% |
| Lebanese | 76.8 /100 | #148 | Good 13.2% |
| Sierra Leoneans | 76.3 /100 | #149 | Good 13.2% |
| Iraqis | 76.0 /100 | #150 | Good 13.2% |
| Costa Ricans | 75.8 /100 | #151 | Good 13.2% |
| Slavs | 75.7 /100 | #152 | Good 13.2% |
| Northern Europeans | 73.7 /100 | #153 | Good 13.2% |
| Arabs | 73.5 /100 | #154 | Good 13.2% |
| Immigrants | Sierra Leone | 72.9 /100 | #155 | Good 13.3% |
| Immigrants | Cameroon | 72.0 /100 | #156 | Good 13.3% |
| Immigrants | Western Europe | 70.3 /100 | #157 | Good 13.3% |
| Immigrants | Colombia | 69.2 /100 | #158 | Good 13.3% |
| Uruguayans | 66.9 /100 | #159 | Good 13.3% |
| Immigrants | South America | 66.3 /100 | #160 | Good 13.3% |
| Icelanders | 65.7 /100 | #161 | Good 13.3% |