Sudanese vs Delaware Female Poverty Among 25-34 Year Olds
COMPARE
Sudanese
Delaware
Female Poverty Among 25-34 Year Olds
Female Poverty Among 25-34 Year Olds Comparison
Sudanese
Delaware
14.4%
FEMALE POVERTY AMONG 25-34 YEAR OLDS
4.4/ 100
METRIC RATING
221st/ 347
METRIC RANK
14.6%
FEMALE POVERTY AMONG 25-34 YEAR OLDS
2.3/ 100
METRIC RATING
231st/ 347
METRIC RANK
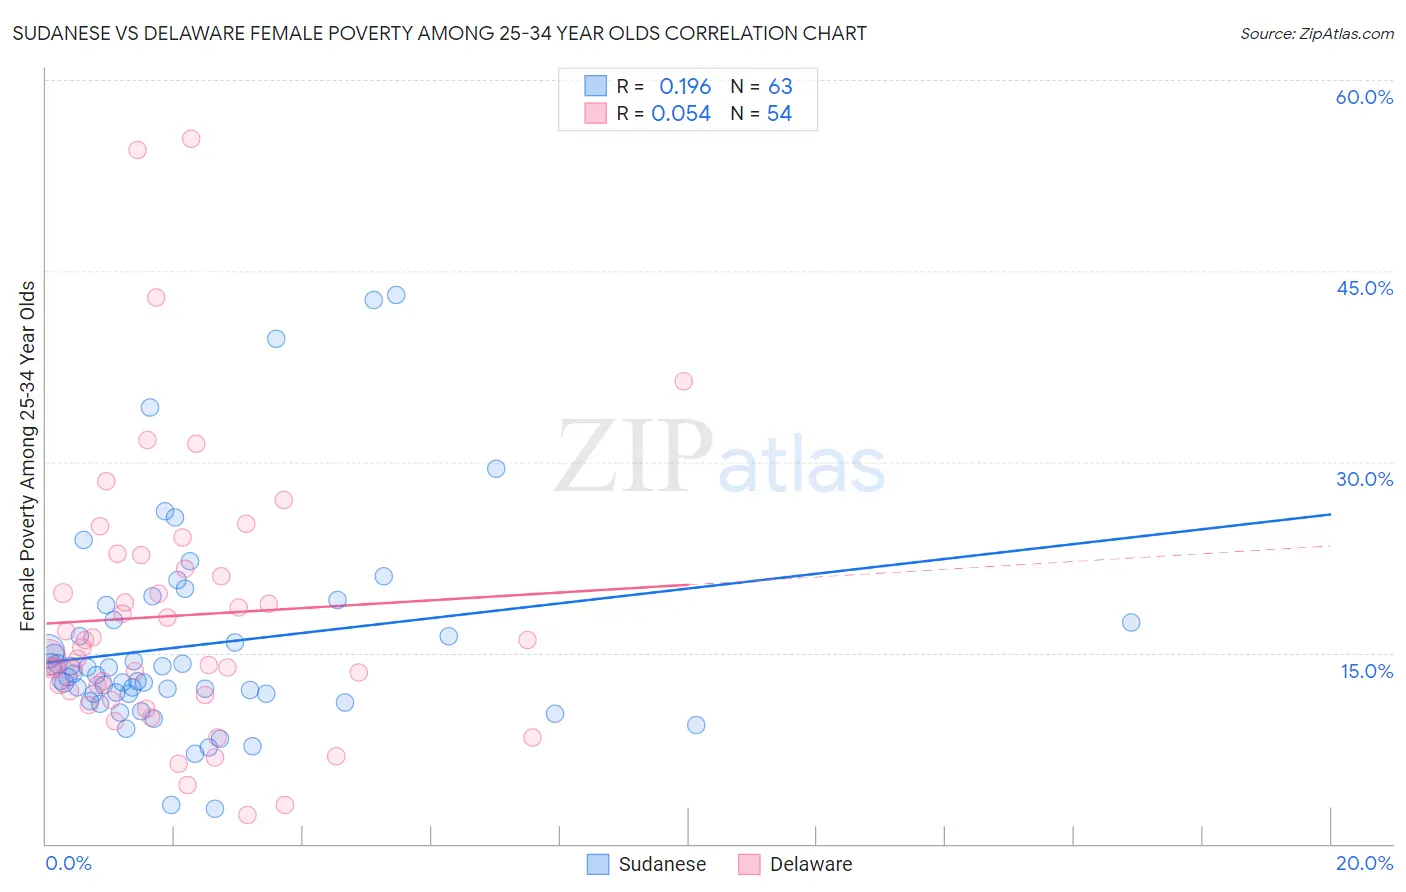
Sudanese vs Delaware Female Poverty Among 25-34 Year Olds Correlation Chart
The statistical analysis conducted on geographies consisting of 109,802,795 people shows a poor positive correlation between the proportion of Sudanese and poverty level among females between the ages 25 and 34 in the United States with a correlation coefficient (R) of 0.196 and weighted average of 14.4%. Similarly, the statistical analysis conducted on geographies consisting of 95,672,726 people shows a slight positive correlation between the proportion of Delaware and poverty level among females between the ages 25 and 34 in the United States with a correlation coefficient (R) of 0.054 and weighted average of 14.6%, a difference of 1.4%.
Female Poverty Among 25-34 Year Olds Correlation Summary
| Measurement | Sudanese | Delaware |
| Minimum | 2.8% | 2.2% |
| Maximum | 43.1% | 55.4% |
| Range | 40.3% | 53.2% |
| Mean | 15.6% | 17.9% |
| Median | 13.3% | 15.1% |
| Interquartile 25% (IQ1) | 11.7% | 11.7% |
| Interquartile 75% (IQ3) | 17.6% | 21.6% |
| Interquartile Range (IQR) | 5.8% | 10.0% |
| Standard Deviation (Sample) | 8.1% | 10.9% |
| Standard Deviation (Population) | 8.1% | 10.8% |
Demographics Similar to Sudanese and Delaware by Female Poverty Among 25-34 Year Olds
In terms of female poverty among 25-34 year olds, the demographic groups most similar to Sudanese are Immigrants from Portugal (14.4%, a difference of 0.070%), Nigerian (14.4%, a difference of 0.13%), Ghanaian (14.4%, a difference of 0.15%), Immigrants from Sudan (14.4%, a difference of 0.20%), and Immigrants from Thailand (14.3%, a difference of 0.32%). Similarly, the demographic groups most similar to Delaware are Spaniard (14.6%, a difference of 0.040%), Spanish (14.6%, a difference of 0.18%), Vietnamese (14.6%, a difference of 0.27%), Immigrants from Ecuador (14.6%, a difference of 0.31%), and Celtic (14.5%, a difference of 0.45%).
| Demographics | Rating | Rank | Female Poverty Among 25-34 Year Olds |
| French Canadians | 5.5 /100 | #216 | Tragic 14.3% |
| Spanish American Indians | 5.5 /100 | #217 | Tragic 14.3% |
| Immigrants | Thailand | 5.2 /100 | #218 | Tragic 14.3% |
| Ecuadorians | 5.2 /100 | #219 | Tragic 14.3% |
| Ghanaians | 4.8 /100 | #220 | Tragic 14.4% |
| Sudanese | 4.4 /100 | #221 | Tragic 14.4% |
| Immigrants | Portugal | 4.3 /100 | #222 | Tragic 14.4% |
| Nigerians | 4.2 /100 | #223 | Tragic 14.4% |
| Immigrants | Sudan | 4.0 /100 | #224 | Tragic 14.4% |
| Immigrants | Barbados | 3.4 /100 | #225 | Tragic 14.5% |
| Nicaraguans | 3.3 /100 | #226 | Tragic 14.5% |
| Celtics | 2.8 /100 | #227 | Tragic 14.5% |
| Vietnamese | 2.6 /100 | #228 | Tragic 14.6% |
| Spanish | 2.5 /100 | #229 | Tragic 14.6% |
| Spaniards | 2.3 /100 | #230 | Tragic 14.6% |
| Delaware | 2.3 /100 | #231 | Tragic 14.6% |
| Immigrants | Ecuador | 1.9 /100 | #232 | Tragic 14.6% |
| Whites/Caucasians | 1.8 /100 | #233 | Tragic 14.7% |
| Cubans | 1.6 /100 | #234 | Tragic 14.7% |
| Immigrants | Jamaica | 1.4 /100 | #235 | Tragic 14.7% |
| Salvadorans | 1.4 /100 | #236 | Tragic 14.7% |