Native/Alaskan vs Immigrants from Burma/Myanmar Seniors Poverty Over the Age of 65
COMPARE
Native/Alaskan
Immigrants from Burma/Myanmar
Seniors Poverty Over the Age of 65
Seniors Poverty Over the Age of 65 Comparison
Natives/Alaskans
Immigrants from Burma/Myanmar
14.2%
SENIORS POVERTY OVER THE AGE OF 65
0.0/ 100
METRIC RATING
311th/ 347
METRIC RANK
11.3%
SENIORS POVERTY OVER THE AGE OF 65
21.3/ 100
METRIC RATING
198th/ 347
METRIC RANK
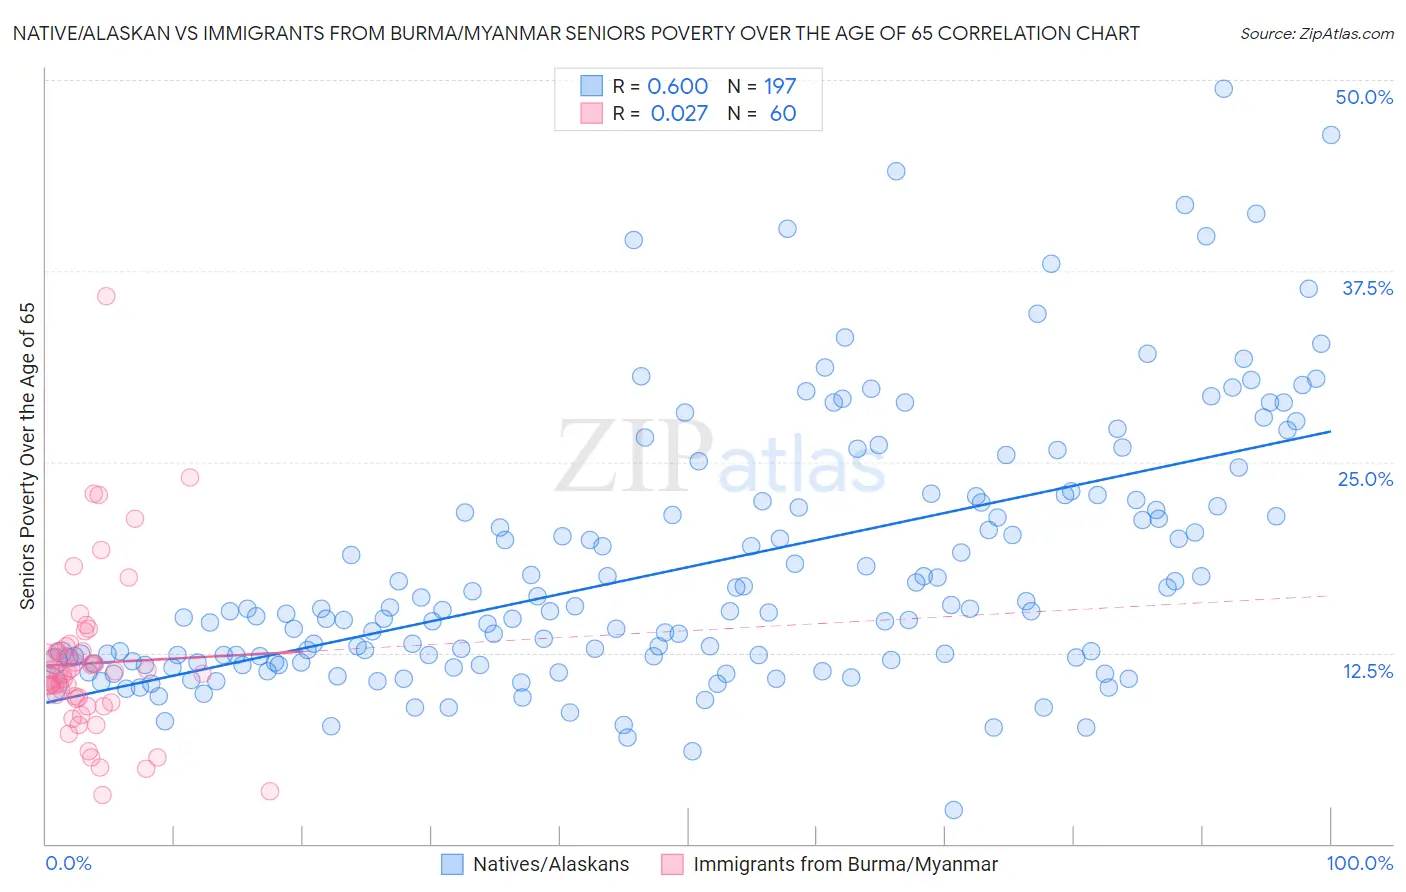
Native/Alaskan vs Immigrants from Burma/Myanmar Seniors Poverty Over the Age of 65 Correlation Chart
The statistical analysis conducted on geographies consisting of 510,101,075 people shows a substantial positive correlation between the proportion of Natives/Alaskans and poverty level among seniors over the age of 65 in the United States with a correlation coefficient (R) of 0.600 and weighted average of 14.2%. Similarly, the statistical analysis conducted on geographies consisting of 172,103,191 people shows no correlation between the proportion of Immigrants from Burma/Myanmar and poverty level among seniors over the age of 65 in the United States with a correlation coefficient (R) of 0.027 and weighted average of 11.3%, a difference of 26.5%.
Seniors Poverty Over the Age of 65 Correlation Summary
| Measurement | Native/Alaskan | Immigrants from Burma/Myanmar |
| Minimum | 2.2% | 3.2% |
| Maximum | 49.4% | 35.9% |
| Range | 47.2% | 32.6% |
| Mean | 18.1% | 11.8% |
| Median | 15.2% | 11.1% |
| Interquartile 25% (IQ1) | 11.9% | 9.4% |
| Interquartile 75% (IQ3) | 22.3% | 12.6% |
| Interquartile Range (IQR) | 10.4% | 3.2% |
| Standard Deviation (Sample) | 8.6% | 5.4% |
| Standard Deviation (Population) | 8.6% | 5.3% |
Similar Demographics by Seniors Poverty Over the Age of 65
Demographics Similar to Natives/Alaskans by Seniors Poverty Over the Age of 65
In terms of seniors poverty over the age of 65, the demographic groups most similar to Natives/Alaskans are Bahamian (14.2%, a difference of 0.010%), Honduran (14.2%, a difference of 0.27%), Trinidadian and Tobagonian (14.2%, a difference of 0.36%), Immigrants from West Indies (14.2%, a difference of 0.44%), and Hispanic or Latino (14.3%, a difference of 0.54%).
| Demographics | Rating | Rank | Seniors Poverty Over the Age of 65 |
| West Indians | 0.0 /100 | #304 | Tragic 14.1% |
| Immigrants | Trinidad and Tobago | 0.0 /100 | #305 | Tragic 14.1% |
| Immigrants | Latin America | 0.0 /100 | #306 | Tragic 14.2% |
| Immigrants | West Indies | 0.0 /100 | #307 | Tragic 14.2% |
| Trinidadians and Tobagonians | 0.0 /100 | #308 | Tragic 14.2% |
| Hondurans | 0.0 /100 | #309 | Tragic 14.2% |
| Bahamians | 0.0 /100 | #310 | Tragic 14.2% |
| Natives/Alaskans | 0.0 /100 | #311 | Tragic 14.2% |
| Hispanics or Latinos | 0.0 /100 | #312 | Tragic 14.3% |
| Barbadians | 0.0 /100 | #313 | Tragic 14.4% |
| Guyanese | 0.0 /100 | #314 | Tragic 14.4% |
| Immigrants | Ecuador | 0.0 /100 | #315 | Tragic 14.4% |
| Immigrants | Guyana | 0.0 /100 | #316 | Tragic 14.5% |
| Haitians | 0.0 /100 | #317 | Tragic 14.5% |
| Immigrants | Honduras | 0.0 /100 | #318 | Tragic 14.5% |
Demographics Similar to Immigrants from Burma/Myanmar by Seniors Poverty Over the Age of 65
In terms of seniors poverty over the age of 65, the demographic groups most similar to Immigrants from Burma/Myanmar are Immigrants from Israel (11.3%, a difference of 0.13%), Alsatian (11.3%, a difference of 0.16%), Albanian (11.2%, a difference of 0.38%), Bangladeshi (11.2%, a difference of 0.47%), and Immigrants from Brazil (11.3%, a difference of 0.48%).
| Demographics | Rating | Rank | Seniors Poverty Over the Age of 65 |
| Immigrants | Uganda | 32.2 /100 | #191 | Fair 11.1% |
| Immigrants | Southern Europe | 30.1 /100 | #192 | Fair 11.1% |
| Taiwanese | 29.2 /100 | #193 | Fair 11.2% |
| Chileans | 27.8 /100 | #194 | Fair 11.2% |
| Immigrants | Vietnam | 26.6 /100 | #195 | Fair 11.2% |
| Bangladeshis | 25.2 /100 | #196 | Fair 11.2% |
| Albanians | 24.4 /100 | #197 | Fair 11.2% |
| Immigrants | Burma/Myanmar | 21.3 /100 | #198 | Fair 11.3% |
| Immigrants | Israel | 20.3 /100 | #199 | Fair 11.3% |
| Alsatians | 20.1 /100 | #200 | Fair 11.3% |
| Immigrants | Brazil | 17.8 /100 | #201 | Poor 11.3% |
| Costa Ricans | 17.0 /100 | #202 | Poor 11.3% |
| Immigrants | Zaire | 16.9 /100 | #203 | Poor 11.3% |
| Israelis | 16.5 /100 | #204 | Poor 11.3% |
| Brazilians | 15.4 /100 | #205 | Poor 11.3% |