Spanish vs Immigrants from Bosnia and Herzegovina Poverty
COMPARE
Spanish
Immigrants from Bosnia and Herzegovina
Poverty
Poverty Comparison
Spanish
Immigrants from Bosnia and Herzegovina
12.8%
POVERTY
18.7/ 100
METRIC RATING
198th/ 347
METRIC RANK
12.0%
POVERTY
73.7/ 100
METRIC RATING
147th/ 347
METRIC RANK
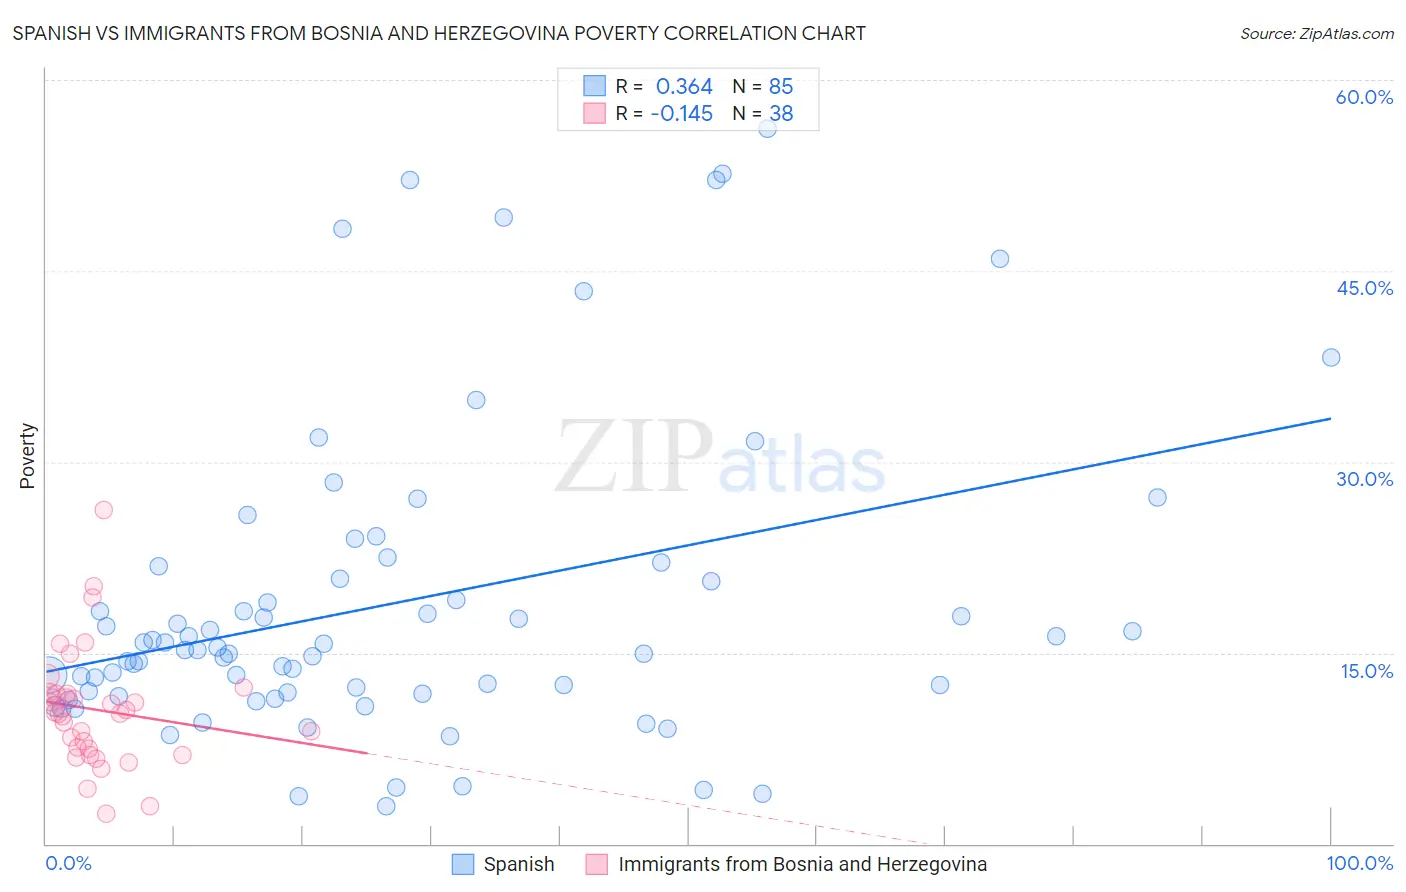
Spanish vs Immigrants from Bosnia and Herzegovina Poverty Correlation Chart
The statistical analysis conducted on geographies consisting of 421,940,954 people shows a mild positive correlation between the proportion of Spanish and poverty level in the United States with a correlation coefficient (R) of 0.364 and weighted average of 12.8%. Similarly, the statistical analysis conducted on geographies consisting of 156,765,120 people shows a poor negative correlation between the proportion of Immigrants from Bosnia and Herzegovina and poverty level in the United States with a correlation coefficient (R) of -0.145 and weighted average of 12.0%, a difference of 6.2%.
Poverty Correlation Summary
| Measurement | Spanish | Immigrants from Bosnia and Herzegovina |
| Minimum | 3.0% | 2.3% |
| Maximum | 56.1% | 26.2% |
| Range | 53.2% | 23.9% |
| Mean | 18.9% | 10.5% |
| Median | 15.2% | 10.2% |
| Interquartile 25% (IQ1) | 11.8% | 7.4% |
| Interquartile 75% (IQ3) | 21.3% | 11.8% |
| Interquartile Range (IQR) | 9.5% | 4.4% |
| Standard Deviation (Sample) | 12.1% | 4.7% |
| Standard Deviation (Population) | 12.1% | 4.6% |
Similar Demographics by Poverty
Demographics Similar to Spanish by Poverty
In terms of poverty, the demographic groups most similar to Spanish are Immigrants from Lebanon (12.8%, a difference of 0.010%), Immigrants from Kenya (12.8%, a difference of 0.19%), Iraqi (12.7%, a difference of 0.31%), Immigrants from Kuwait (12.7%, a difference of 0.33%), and Spaniard (12.8%, a difference of 0.35%).
| Demographics | Rating | Rank | Poverty |
| Sierra Leoneans | 31.5 /100 | #191 | Fair 12.6% |
| South American Indians | 23.3 /100 | #192 | Fair 12.7% |
| Delaware | 21.4 /100 | #193 | Fair 12.7% |
| Arabs | 21.1 /100 | #194 | Fair 12.7% |
| Immigrants | Kuwait | 20.9 /100 | #195 | Fair 12.7% |
| Iraqis | 20.8 /100 | #196 | Fair 12.7% |
| Immigrants | Lebanon | 18.7 /100 | #197 | Poor 12.8% |
| Spanish | 18.7 /100 | #198 | Poor 12.8% |
| Immigrants | Kenya | 17.5 /100 | #199 | Poor 12.8% |
| Spaniards | 16.5 /100 | #200 | Poor 12.8% |
| Immigrants | Uganda | 16.5 /100 | #201 | Poor 12.8% |
| Immigrants | Uruguay | 15.6 /100 | #202 | Poor 12.8% |
| Hmong | 15.0 /100 | #203 | Poor 12.8% |
| Immigrants | Western Asia | 14.1 /100 | #204 | Poor 12.9% |
| Tsimshian | 9.2 /100 | #205 | Tragic 13.0% |
Demographics Similar to Immigrants from Bosnia and Herzegovina by Poverty
In terms of poverty, the demographic groups most similar to Immigrants from Bosnia and Herzegovina are Immigrants from Germany (12.0%, a difference of 0.12%), Immigrants from Malaysia (12.0%, a difference of 0.12%), Afghan (12.0%, a difference of 0.16%), Immigrants from Kazakhstan (12.0%, a difference of 0.17%), and Syrian (12.0%, a difference of 0.19%).
| Demographics | Rating | Rank | Poverty |
| Immigrants | Peru | 81.1 /100 | #140 | Excellent 11.9% |
| Immigrants | France | 80.5 /100 | #141 | Excellent 11.9% |
| Basques | 80.4 /100 | #142 | Excellent 11.9% |
| Brazilians | 79.7 /100 | #143 | Good 11.9% |
| Icelanders | 77.9 /100 | #144 | Good 11.9% |
| Syrians | 75.1 /100 | #145 | Good 12.0% |
| Afghans | 74.9 /100 | #146 | Good 12.0% |
| Immigrants | Bosnia and Herzegovina | 73.7 /100 | #147 | Good 12.0% |
| Immigrants | Germany | 72.7 /100 | #148 | Good 12.0% |
| Immigrants | Malaysia | 72.7 /100 | #149 | Good 12.0% |
| Immigrants | Kazakhstan | 72.3 /100 | #150 | Good 12.0% |
| Samoans | 71.9 /100 | #151 | Good 12.0% |
| Armenians | 67.6 /100 | #152 | Good 12.1% |
| Immigrants | Northern Africa | 63.9 /100 | #153 | Good 12.1% |
| Guamanians/Chamorros | 63.9 /100 | #154 | Good 12.1% |