Barbadian vs Immigrants from Bosnia and Herzegovina Poverty
COMPARE
Barbadian
Immigrants from Bosnia and Herzegovina
Poverty
Poverty Comparison
Barbadians
Immigrants from Bosnia and Herzegovina
14.8%
POVERTY
0.0/ 100
METRIC RATING
274th/ 347
METRIC RANK
12.0%
POVERTY
73.7/ 100
METRIC RATING
147th/ 347
METRIC RANK
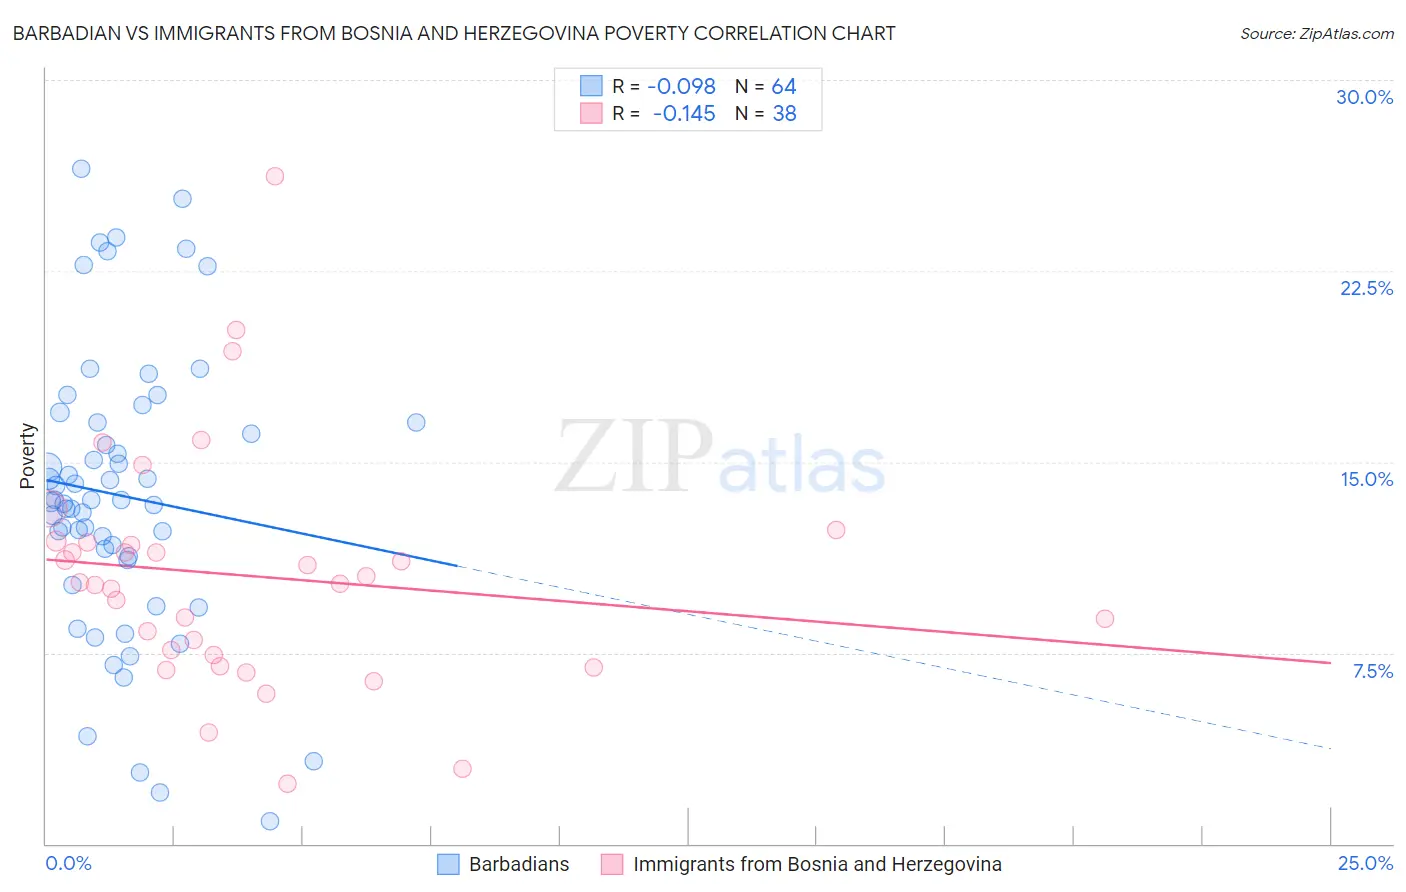
Barbadian vs Immigrants from Bosnia and Herzegovina Poverty Correlation Chart
The statistical analysis conducted on geographies consisting of 141,278,644 people shows a slight negative correlation between the proportion of Barbadians and poverty level in the United States with a correlation coefficient (R) of -0.098 and weighted average of 14.8%. Similarly, the statistical analysis conducted on geographies consisting of 156,765,120 people shows a poor negative correlation between the proportion of Immigrants from Bosnia and Herzegovina and poverty level in the United States with a correlation coefficient (R) of -0.145 and weighted average of 12.0%, a difference of 23.3%.
Poverty Correlation Summary
| Measurement | Barbadian | Immigrants from Bosnia and Herzegovina |
| Minimum | 0.88% | 2.3% |
| Maximum | 26.5% | 26.2% |
| Range | 25.6% | 23.9% |
| Mean | 13.7% | 10.5% |
| Median | 13.5% | 10.2% |
| Interquartile 25% (IQ1) | 11.2% | 7.4% |
| Interquartile 75% (IQ3) | 16.5% | 11.8% |
| Interquartile Range (IQR) | 5.3% | 4.4% |
| Standard Deviation (Sample) | 5.6% | 4.7% |
| Standard Deviation (Population) | 5.6% | 4.6% |
Similar Demographics by Poverty
Demographics Similar to Barbadians by Poverty
In terms of poverty, the demographic groups most similar to Barbadians are Immigrants from West Indies (14.8%, a difference of 0.040%), Immigrants from Bahamas (14.8%, a difference of 0.040%), Bangladeshi (14.8%, a difference of 0.090%), Belizean (14.8%, a difference of 0.11%), and Spanish American (14.7%, a difference of 0.39%).
| Demographics | Rating | Rank | Poverty |
| Iroquois | 0.1 /100 | #267 | Tragic 14.5% |
| Sub-Saharan Africans | 0.1 /100 | #268 | Tragic 14.5% |
| Immigrants | Cuba | 0.1 /100 | #269 | Tragic 14.6% |
| Central Americans | 0.1 /100 | #270 | Tragic 14.6% |
| Shoshone | 0.0 /100 | #271 | Tragic 14.7% |
| Chickasaw | 0.0 /100 | #272 | Tragic 14.7% |
| Spanish Americans | 0.0 /100 | #273 | Tragic 14.7% |
| Barbadians | 0.0 /100 | #274 | Tragic 14.8% |
| Immigrants | West Indies | 0.0 /100 | #275 | Tragic 14.8% |
| Immigrants | Bahamas | 0.0 /100 | #276 | Tragic 14.8% |
| Bangladeshis | 0.0 /100 | #277 | Tragic 14.8% |
| Belizeans | 0.0 /100 | #278 | Tragic 14.8% |
| Immigrants | St. Vincent and the Grenadines | 0.0 /100 | #279 | Tragic 14.9% |
| Haitians | 0.0 /100 | #280 | Tragic 14.9% |
| Immigrants | Barbados | 0.0 /100 | #281 | Tragic 14.9% |
Demographics Similar to Immigrants from Bosnia and Herzegovina by Poverty
In terms of poverty, the demographic groups most similar to Immigrants from Bosnia and Herzegovina are Immigrants from Germany (12.0%, a difference of 0.12%), Immigrants from Malaysia (12.0%, a difference of 0.12%), Afghan (12.0%, a difference of 0.16%), Immigrants from Kazakhstan (12.0%, a difference of 0.17%), and Syrian (12.0%, a difference of 0.19%).
| Demographics | Rating | Rank | Poverty |
| Immigrants | Peru | 81.1 /100 | #140 | Excellent 11.9% |
| Immigrants | France | 80.5 /100 | #141 | Excellent 11.9% |
| Basques | 80.4 /100 | #142 | Excellent 11.9% |
| Brazilians | 79.7 /100 | #143 | Good 11.9% |
| Icelanders | 77.9 /100 | #144 | Good 11.9% |
| Syrians | 75.1 /100 | #145 | Good 12.0% |
| Afghans | 74.9 /100 | #146 | Good 12.0% |
| Immigrants | Bosnia and Herzegovina | 73.7 /100 | #147 | Good 12.0% |
| Immigrants | Germany | 72.7 /100 | #148 | Good 12.0% |
| Immigrants | Malaysia | 72.7 /100 | #149 | Good 12.0% |
| Immigrants | Kazakhstan | 72.3 /100 | #150 | Good 12.0% |
| Samoans | 71.9 /100 | #151 | Good 12.0% |
| Armenians | 67.6 /100 | #152 | Good 12.1% |
| Immigrants | Northern Africa | 63.9 /100 | #153 | Good 12.1% |
| Guamanians/Chamorros | 63.9 /100 | #154 | Good 12.1% |