Spanish vs Cajun Poverty
COMPARE
Spanish
Cajun
Poverty
Poverty Comparison
Spanish
Cajuns
12.8%
POVERTY
18.7/ 100
METRIC RATING
198th/ 347
METRIC RANK
15.7%
POVERTY
0.0/ 100
METRIC RATING
312th/ 347
METRIC RANK
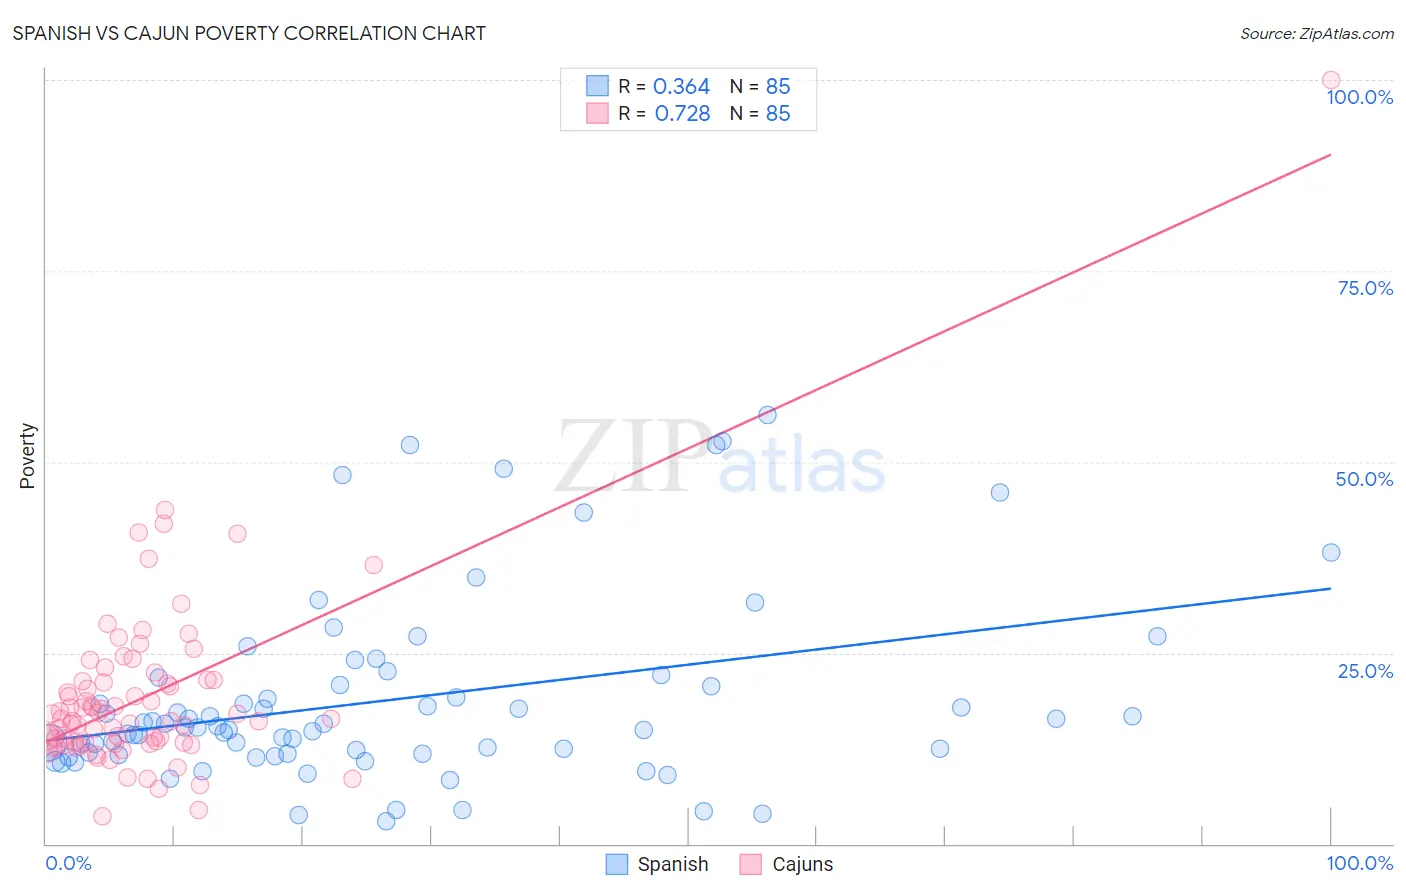
Spanish vs Cajun Poverty Correlation Chart
The statistical analysis conducted on geographies consisting of 421,940,954 people shows a mild positive correlation between the proportion of Spanish and poverty level in the United States with a correlation coefficient (R) of 0.364 and weighted average of 12.8%. Similarly, the statistical analysis conducted on geographies consisting of 149,691,994 people shows a strong positive correlation between the proportion of Cajuns and poverty level in the United States with a correlation coefficient (R) of 0.728 and weighted average of 15.7%, a difference of 23.1%.
Poverty Correlation Summary
| Measurement | Spanish | Cajun |
| Minimum | 3.0% | 3.7% |
| Maximum | 56.1% | 100.0% |
| Range | 53.2% | 96.3% |
| Mean | 18.9% | 19.2% |
| Median | 15.2% | 16.3% |
| Interquartile 25% (IQ1) | 11.8% | 13.1% |
| Interquartile 75% (IQ3) | 21.3% | 21.3% |
| Interquartile Range (IQR) | 9.5% | 8.2% |
| Standard Deviation (Sample) | 12.1% | 12.0% |
| Standard Deviation (Population) | 12.1% | 11.9% |
Similar Demographics by Poverty
Demographics Similar to Spanish by Poverty
In terms of poverty, the demographic groups most similar to Spanish are Immigrants from Lebanon (12.8%, a difference of 0.010%), Immigrants from Kenya (12.8%, a difference of 0.19%), Iraqi (12.7%, a difference of 0.31%), Immigrants from Kuwait (12.7%, a difference of 0.33%), and Spaniard (12.8%, a difference of 0.35%).
| Demographics | Rating | Rank | Poverty |
| Sierra Leoneans | 31.5 /100 | #191 | Fair 12.6% |
| South American Indians | 23.3 /100 | #192 | Fair 12.7% |
| Delaware | 21.4 /100 | #193 | Fair 12.7% |
| Arabs | 21.1 /100 | #194 | Fair 12.7% |
| Immigrants | Kuwait | 20.9 /100 | #195 | Fair 12.7% |
| Iraqis | 20.8 /100 | #196 | Fair 12.7% |
| Immigrants | Lebanon | 18.7 /100 | #197 | Poor 12.8% |
| Spanish | 18.7 /100 | #198 | Poor 12.8% |
| Immigrants | Kenya | 17.5 /100 | #199 | Poor 12.8% |
| Spaniards | 16.5 /100 | #200 | Poor 12.8% |
| Immigrants | Uganda | 16.5 /100 | #201 | Poor 12.8% |
| Immigrants | Uruguay | 15.6 /100 | #202 | Poor 12.8% |
| Hmong | 15.0 /100 | #203 | Poor 12.8% |
| Immigrants | Western Asia | 14.1 /100 | #204 | Poor 12.9% |
| Tsimshian | 9.2 /100 | #205 | Tragic 13.0% |
Demographics Similar to Cajuns by Poverty
In terms of poverty, the demographic groups most similar to Cajuns are Chippewa (15.7%, a difference of 0.16%), Immigrants from Grenada (15.8%, a difference of 0.44%), Dutch West Indian (15.6%, a difference of 0.54%), Immigrants from Somalia (15.8%, a difference of 0.56%), and Seminole (15.6%, a difference of 0.63%).
| Demographics | Rating | Rank | Poverty |
| Immigrants | Guatemala | 0.0 /100 | #305 | Tragic 15.5% |
| Creek | 0.0 /100 | #306 | Tragic 15.6% |
| Africans | 0.0 /100 | #307 | Tragic 15.6% |
| Choctaw | 0.0 /100 | #308 | Tragic 15.6% |
| Seminole | 0.0 /100 | #309 | Tragic 15.6% |
| Dutch West Indians | 0.0 /100 | #310 | Tragic 15.6% |
| Chippewa | 0.0 /100 | #311 | Tragic 15.7% |
| Cajuns | 0.0 /100 | #312 | Tragic 15.7% |
| Immigrants | Grenada | 0.0 /100 | #313 | Tragic 15.8% |
| Immigrants | Somalia | 0.0 /100 | #314 | Tragic 15.8% |
| British West Indians | 0.0 /100 | #315 | Tragic 15.9% |
| Hondurans | 0.0 /100 | #316 | Tragic 15.9% |
| U.S. Virgin Islanders | 0.0 /100 | #317 | Tragic 16.1% |
| Immigrants | Dominica | 0.0 /100 | #318 | Tragic 16.1% |
| Immigrants | Congo | 0.0 /100 | #319 | Tragic 16.1% |