Spanish American vs Immigrants from Costa Rica Single Father Poverty
COMPARE
Spanish American
Immigrants from Costa Rica
Single Father Poverty
Single Father Poverty Comparison
Spanish Americans
Immigrants from Costa Rica
16.9%
SINGLE FATHER POVERTY
3.7/ 100
METRIC RATING
231st/ 347
METRIC RANK
16.3%
SINGLE FATHER POVERTY
55.7/ 100
METRIC RATING
163rd/ 347
METRIC RANK
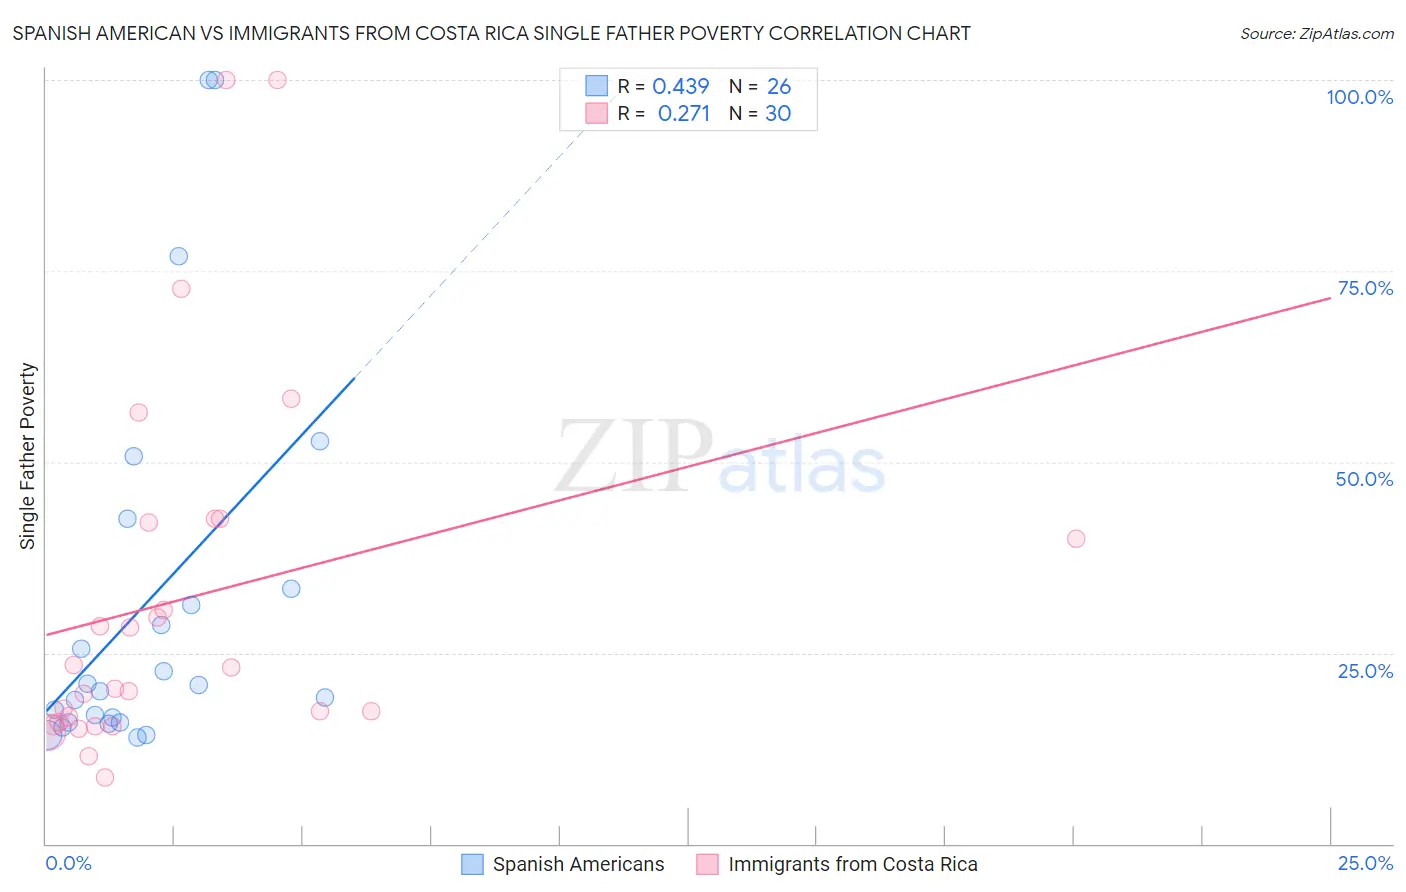
Spanish American vs Immigrants from Costa Rica Single Father Poverty Correlation Chart
The statistical analysis conducted on geographies consisting of 95,172,668 people shows a moderate positive correlation between the proportion of Spanish Americans and poverty level among single fathers in the United States with a correlation coefficient (R) of 0.439 and weighted average of 16.9%. Similarly, the statistical analysis conducted on geographies consisting of 176,390,678 people shows a weak positive correlation between the proportion of Immigrants from Costa Rica and poverty level among single fathers in the United States with a correlation coefficient (R) of 0.271 and weighted average of 16.3%, a difference of 3.9%.
Single Father Poverty Correlation Summary
| Measurement | Spanish American | Immigrants from Costa Rica |
| Minimum | 13.9% | 8.7% |
| Maximum | 100.0% | 100.0% |
| Range | 86.1% | 91.3% |
| Mean | 31.5% | 32.0% |
| Median | 20.4% | 21.7% |
| Interquartile 25% (IQ1) | 15.9% | 15.9% |
| Interquartile 75% (IQ3) | 33.3% | 42.0% |
| Interquartile Range (IQR) | 17.4% | 26.1% |
| Standard Deviation (Sample) | 25.1% | 24.0% |
| Standard Deviation (Population) | 24.6% | 23.6% |
Similar Demographics by Single Father Poverty
Demographics Similar to Spanish Americans by Single Father Poverty
In terms of single father poverty, the demographic groups most similar to Spanish Americans are Immigrants from Grenada (16.9%, a difference of 0.020%), Senegalese (16.9%, a difference of 0.16%), Marshallese (16.9%, a difference of 0.19%), Immigrants from Trinidad and Tobago (16.8%, a difference of 0.21%), and Israeli (16.8%, a difference of 0.24%).
| Demographics | Rating | Rank | Single Father Poverty |
| Immigrants | Norway | 6.5 /100 | #224 | Tragic 16.8% |
| Menominee | 6.4 /100 | #225 | Tragic 16.8% |
| Hispanics or Latinos | 6.1 /100 | #226 | Tragic 16.8% |
| British | 5.6 /100 | #227 | Tragic 16.8% |
| Belgians | 5.3 /100 | #228 | Tragic 16.8% |
| Israelis | 4.6 /100 | #229 | Tragic 16.8% |
| Immigrants | Trinidad and Tobago | 4.5 /100 | #230 | Tragic 16.8% |
| Spanish Americans | 3.7 /100 | #231 | Tragic 16.9% |
| Immigrants | Grenada | 3.7 /100 | #232 | Tragic 16.9% |
| Senegalese | 3.2 /100 | #233 | Tragic 16.9% |
| Marshallese | 3.1 /100 | #234 | Tragic 16.9% |
| Immigrants | Western Europe | 2.9 /100 | #235 | Tragic 16.9% |
| Immigrants | Germany | 2.9 /100 | #236 | Tragic 16.9% |
| Sub-Saharan Africans | 2.9 /100 | #237 | Tragic 16.9% |
| Immigrants | Saudi Arabia | 2.7 /100 | #238 | Tragic 16.9% |
Demographics Similar to Immigrants from Costa Rica by Single Father Poverty
In terms of single father poverty, the demographic groups most similar to Immigrants from Costa Rica are Ugandan (16.3%, a difference of 0.010%), Guyanese (16.3%, a difference of 0.020%), Immigrants from Bangladesh (16.3%, a difference of 0.030%), Estonian (16.2%, a difference of 0.040%), and Immigrants from Europe (16.3%, a difference of 0.040%).
| Demographics | Rating | Rank | Single Father Poverty |
| Immigrants | Jordan | 66.0 /100 | #156 | Good 16.2% |
| Immigrants | Czechoslovakia | 62.8 /100 | #157 | Good 16.2% |
| Portuguese | 62.3 /100 | #158 | Good 16.2% |
| Belizeans | 59.9 /100 | #159 | Average 16.2% |
| Immigrants | Sudan | 59.8 /100 | #160 | Average 16.2% |
| Estonians | 56.7 /100 | #161 | Average 16.2% |
| Ugandans | 55.9 /100 | #162 | Average 16.3% |
| Immigrants | Costa Rica | 55.7 /100 | #163 | Average 16.3% |
| Guyanese | 55.2 /100 | #164 | Average 16.3% |
| Immigrants | Bangladesh | 55.1 /100 | #165 | Average 16.3% |
| Immigrants | Europe | 54.8 /100 | #166 | Average 16.3% |
| Yugoslavians | 53.9 /100 | #167 | Average 16.3% |
| Costa Ricans | 53.6 /100 | #168 | Average 16.3% |
| Northern Europeans | 52.8 /100 | #169 | Average 16.3% |
| Scandinavians | 52.3 /100 | #170 | Average 16.3% |