Immigrants from Argentina vs Immigrants from Costa Rica Single Father Poverty
COMPARE
Immigrants from Argentina
Immigrants from Costa Rica
Single Father Poverty
Single Father Poverty Comparison
Immigrants from Argentina
Immigrants from Costa Rica
15.8%
SINGLE FATHER POVERTY
92.8/ 100
METRIC RATING
116th/ 347
METRIC RANK
16.3%
SINGLE FATHER POVERTY
55.7/ 100
METRIC RATING
163rd/ 347
METRIC RANK
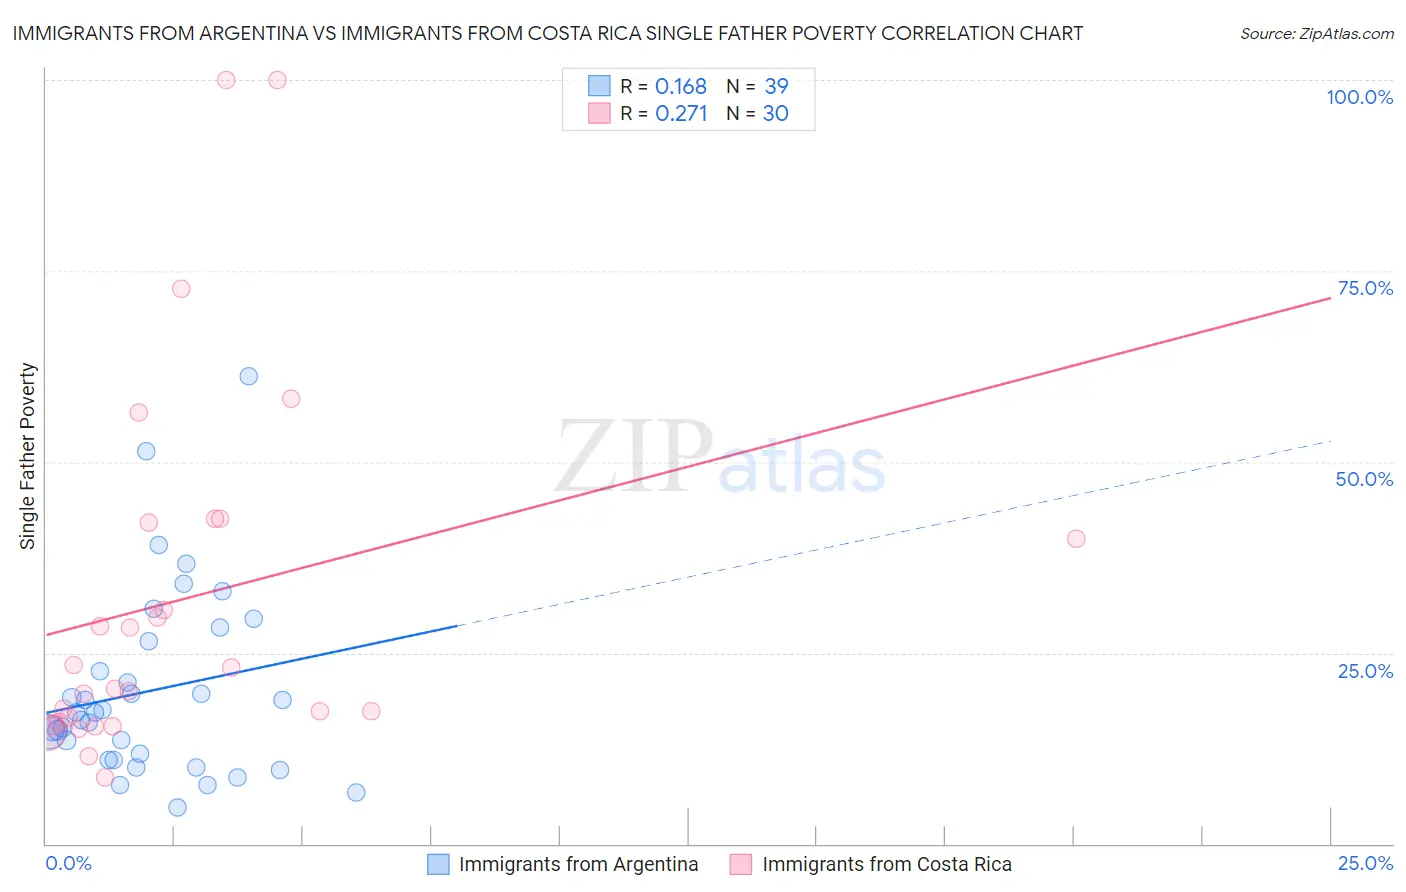
Immigrants from Argentina vs Immigrants from Costa Rica Single Father Poverty Correlation Chart
The statistical analysis conducted on geographies consisting of 216,888,170 people shows a poor positive correlation between the proportion of Immigrants from Argentina and poverty level among single fathers in the United States with a correlation coefficient (R) of 0.168 and weighted average of 15.8%. Similarly, the statistical analysis conducted on geographies consisting of 176,390,678 people shows a weak positive correlation between the proportion of Immigrants from Costa Rica and poverty level among single fathers in the United States with a correlation coefficient (R) of 0.271 and weighted average of 16.3%, a difference of 2.6%.
Single Father Poverty Correlation Summary
| Measurement | Immigrants from Argentina | Immigrants from Costa Rica |
| Minimum | 4.7% | 8.7% |
| Maximum | 61.3% | 100.0% |
| Range | 56.6% | 91.3% |
| Mean | 20.0% | 32.0% |
| Median | 17.1% | 21.7% |
| Interquartile 25% (IQ1) | 11.0% | 15.9% |
| Interquartile 75% (IQ3) | 26.6% | 42.0% |
| Interquartile Range (IQR) | 15.6% | 26.1% |
| Standard Deviation (Sample) | 12.2% | 24.0% |
| Standard Deviation (Population) | 12.1% | 23.6% |
Similar Demographics by Single Father Poverty
Demographics Similar to Immigrants from Argentina by Single Father Poverty
In terms of single father poverty, the demographic groups most similar to Immigrants from Argentina are Immigrants from Colombia (15.8%, a difference of 0.030%), Immigrants from Eastern Europe (15.8%, a difference of 0.040%), Immigrants from Belarus (15.8%, a difference of 0.050%), Uruguayan (15.9%, a difference of 0.11%), and Immigrants (15.9%, a difference of 0.13%).
| Demographics | Rating | Rank | Single Father Poverty |
| Turks | 95.1 /100 | #109 | Exceptional 15.8% |
| Immigrants | Africa | 95.1 /100 | #110 | Exceptional 15.8% |
| Bulgarians | 94.8 /100 | #111 | Exceptional 15.8% |
| Immigrants | Latvia | 94.7 /100 | #112 | Exceptional 15.8% |
| Danes | 94.5 /100 | #113 | Exceptional 15.8% |
| Argentineans | 94.4 /100 | #114 | Exceptional 15.8% |
| Immigrants | Thailand | 93.6 /100 | #115 | Exceptional 15.8% |
| Immigrants | Argentina | 92.8 /100 | #116 | Exceptional 15.8% |
| Immigrants | Colombia | 92.6 /100 | #117 | Exceptional 15.8% |
| Immigrants | Eastern Europe | 92.5 /100 | #118 | Exceptional 15.8% |
| Immigrants | Belarus | 92.4 /100 | #119 | Exceptional 15.8% |
| Uruguayans | 92.1 /100 | #120 | Exceptional 15.9% |
| Immigrants | Immigrants | 91.9 /100 | #121 | Exceptional 15.9% |
| Sudanese | 91.6 /100 | #122 | Exceptional 15.9% |
| Palestinians | 91.3 /100 | #123 | Exceptional 15.9% |
Demographics Similar to Immigrants from Costa Rica by Single Father Poverty
In terms of single father poverty, the demographic groups most similar to Immigrants from Costa Rica are Ugandan (16.3%, a difference of 0.010%), Guyanese (16.3%, a difference of 0.020%), Immigrants from Bangladesh (16.3%, a difference of 0.030%), Estonian (16.2%, a difference of 0.040%), and Immigrants from Europe (16.3%, a difference of 0.040%).
| Demographics | Rating | Rank | Single Father Poverty |
| Immigrants | Jordan | 66.0 /100 | #156 | Good 16.2% |
| Immigrants | Czechoslovakia | 62.8 /100 | #157 | Good 16.2% |
| Portuguese | 62.3 /100 | #158 | Good 16.2% |
| Belizeans | 59.9 /100 | #159 | Average 16.2% |
| Immigrants | Sudan | 59.8 /100 | #160 | Average 16.2% |
| Estonians | 56.7 /100 | #161 | Average 16.2% |
| Ugandans | 55.9 /100 | #162 | Average 16.3% |
| Immigrants | Costa Rica | 55.7 /100 | #163 | Average 16.3% |
| Guyanese | 55.2 /100 | #164 | Average 16.3% |
| Immigrants | Bangladesh | 55.1 /100 | #165 | Average 16.3% |
| Immigrants | Europe | 54.8 /100 | #166 | Average 16.3% |
| Yugoslavians | 53.9 /100 | #167 | Average 16.3% |
| Costa Ricans | 53.6 /100 | #168 | Average 16.3% |
| Northern Europeans | 52.8 /100 | #169 | Average 16.3% |
| Scandinavians | 52.3 /100 | #170 | Average 16.3% |