South African vs Immigrants from Costa Rica Single Father Poverty
COMPARE
South African
Immigrants from Costa Rica
Single Father Poverty
Single Father Poverty Comparison
South Africans
Immigrants from Costa Rica
16.1%
SINGLE FATHER POVERTY
75.1/ 100
METRIC RATING
149th/ 347
METRIC RANK
16.3%
SINGLE FATHER POVERTY
55.7/ 100
METRIC RATING
163rd/ 347
METRIC RANK
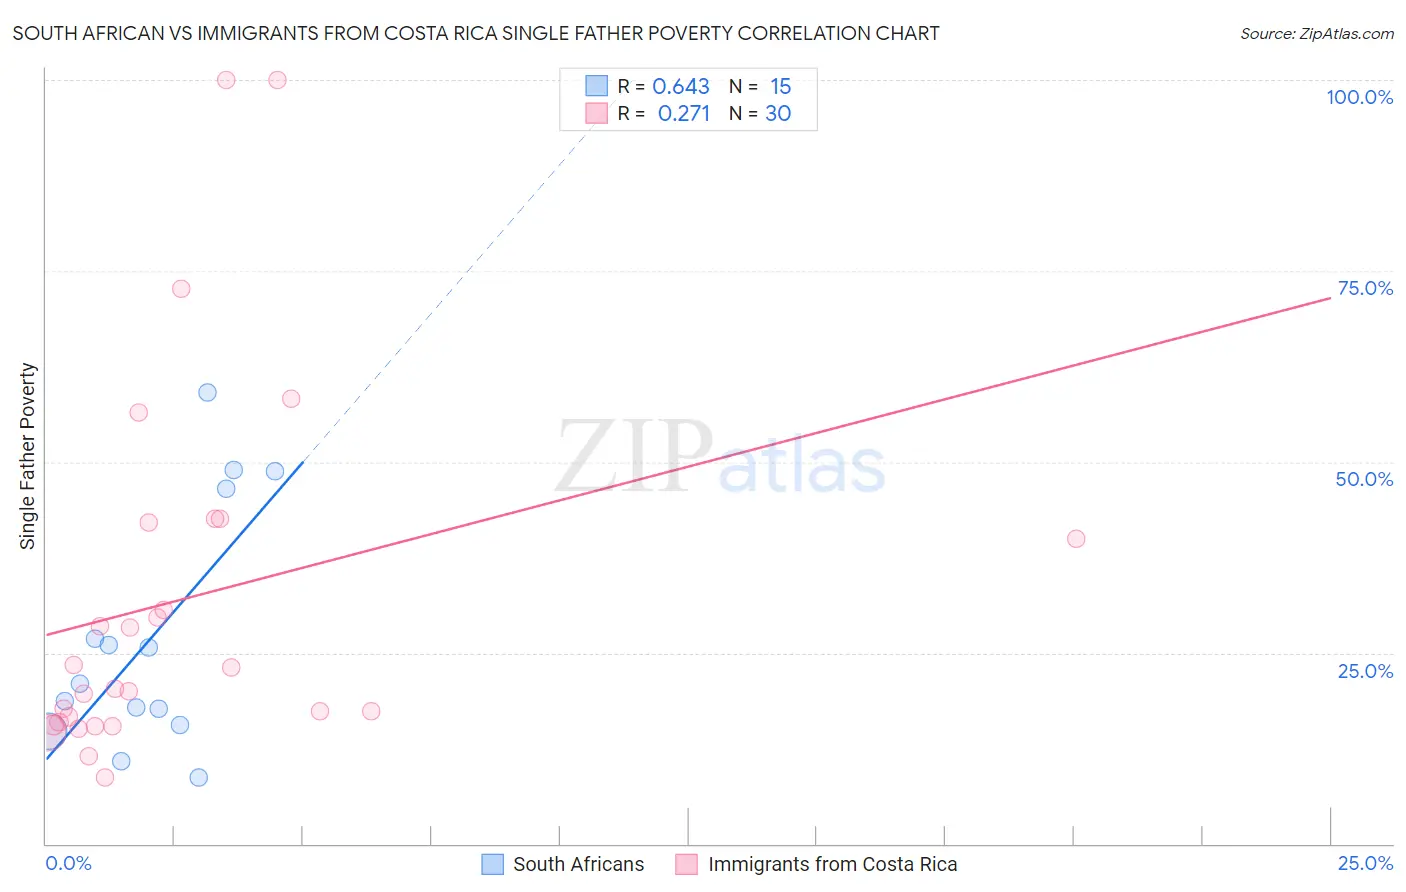
South African vs Immigrants from Costa Rica Single Father Poverty Correlation Chart
The statistical analysis conducted on geographies consisting of 151,650,915 people shows a significant positive correlation between the proportion of South Africans and poverty level among single fathers in the United States with a correlation coefficient (R) of 0.643 and weighted average of 16.1%. Similarly, the statistical analysis conducted on geographies consisting of 176,390,678 people shows a weak positive correlation between the proportion of Immigrants from Costa Rica and poverty level among single fathers in the United States with a correlation coefficient (R) of 0.271 and weighted average of 16.3%, a difference of 0.98%.
Single Father Poverty Correlation Summary
| Measurement | South African | Immigrants from Costa Rica |
| Minimum | 8.7% | 8.7% |
| Maximum | 59.2% | 100.0% |
| Range | 50.5% | 91.3% |
| Mean | 27.1% | 32.0% |
| Median | 20.9% | 21.7% |
| Interquartile 25% (IQ1) | 15.6% | 15.9% |
| Interquartile 75% (IQ3) | 46.4% | 42.0% |
| Interquartile Range (IQR) | 30.8% | 26.1% |
| Standard Deviation (Sample) | 15.9% | 24.0% |
| Standard Deviation (Population) | 15.3% | 23.6% |
Demographics Similar to South Africans and Immigrants from Costa Rica by Single Father Poverty
In terms of single father poverty, the demographic groups most similar to South Africans are Jordanian (16.1%, a difference of 0.060%), Nigerian (16.1%, a difference of 0.10%), Colombian (16.1%, a difference of 0.12%), Immigrants from France (16.1%, a difference of 0.12%), and Immigrants from Zimbabwe (16.1%, a difference of 0.18%). Similarly, the demographic groups most similar to Immigrants from Costa Rica are Ugandan (16.3%, a difference of 0.010%), Guyanese (16.3%, a difference of 0.020%), Immigrants from Bangladesh (16.3%, a difference of 0.030%), Estonian (16.2%, a difference of 0.040%), and Immigrants from Europe (16.3%, a difference of 0.040%).
| Demographics | Rating | Rank | Single Father Poverty |
| Immigrants | Hungary | 78.3 /100 | #146 | Good 16.1% |
| Colombians | 77.1 /100 | #147 | Good 16.1% |
| Nigerians | 76.8 /100 | #148 | Good 16.1% |
| South Africans | 75.1 /100 | #149 | Good 16.1% |
| Jordanians | 74.2 /100 | #150 | Good 16.1% |
| Immigrants | France | 73.1 /100 | #151 | Good 16.1% |
| Immigrants | Zimbabwe | 72.1 /100 | #152 | Good 16.1% |
| Immigrants | Israel | 72.0 /100 | #153 | Good 16.1% |
| Mexicans | 70.1 /100 | #154 | Good 16.1% |
| Immigrants | Nicaragua | 67.8 /100 | #155 | Good 16.2% |
| Immigrants | Jordan | 66.0 /100 | #156 | Good 16.2% |
| Immigrants | Czechoslovakia | 62.8 /100 | #157 | Good 16.2% |
| Portuguese | 62.3 /100 | #158 | Good 16.2% |
| Belizeans | 59.9 /100 | #159 | Average 16.2% |
| Immigrants | Sudan | 59.8 /100 | #160 | Average 16.2% |
| Estonians | 56.7 /100 | #161 | Average 16.2% |
| Ugandans | 55.9 /100 | #162 | Average 16.3% |
| Immigrants | Costa Rica | 55.7 /100 | #163 | Average 16.3% |
| Guyanese | 55.2 /100 | #164 | Average 16.3% |
| Immigrants | Bangladesh | 55.1 /100 | #165 | Average 16.3% |
| Immigrants | Europe | 54.8 /100 | #166 | Average 16.3% |