Somali vs Immigrants from Zimbabwe Female Poverty
COMPARE
Somali
Immigrants from Zimbabwe
Female Poverty
Female Poverty Comparison
Somalis
Immigrants from Zimbabwe
16.6%
FEMALE POVERTY
0.0/ 100
METRIC RATING
298th/ 347
METRIC RANK
12.6%
FEMALE POVERTY
93.1/ 100
METRIC RATING
109th/ 347
METRIC RANK
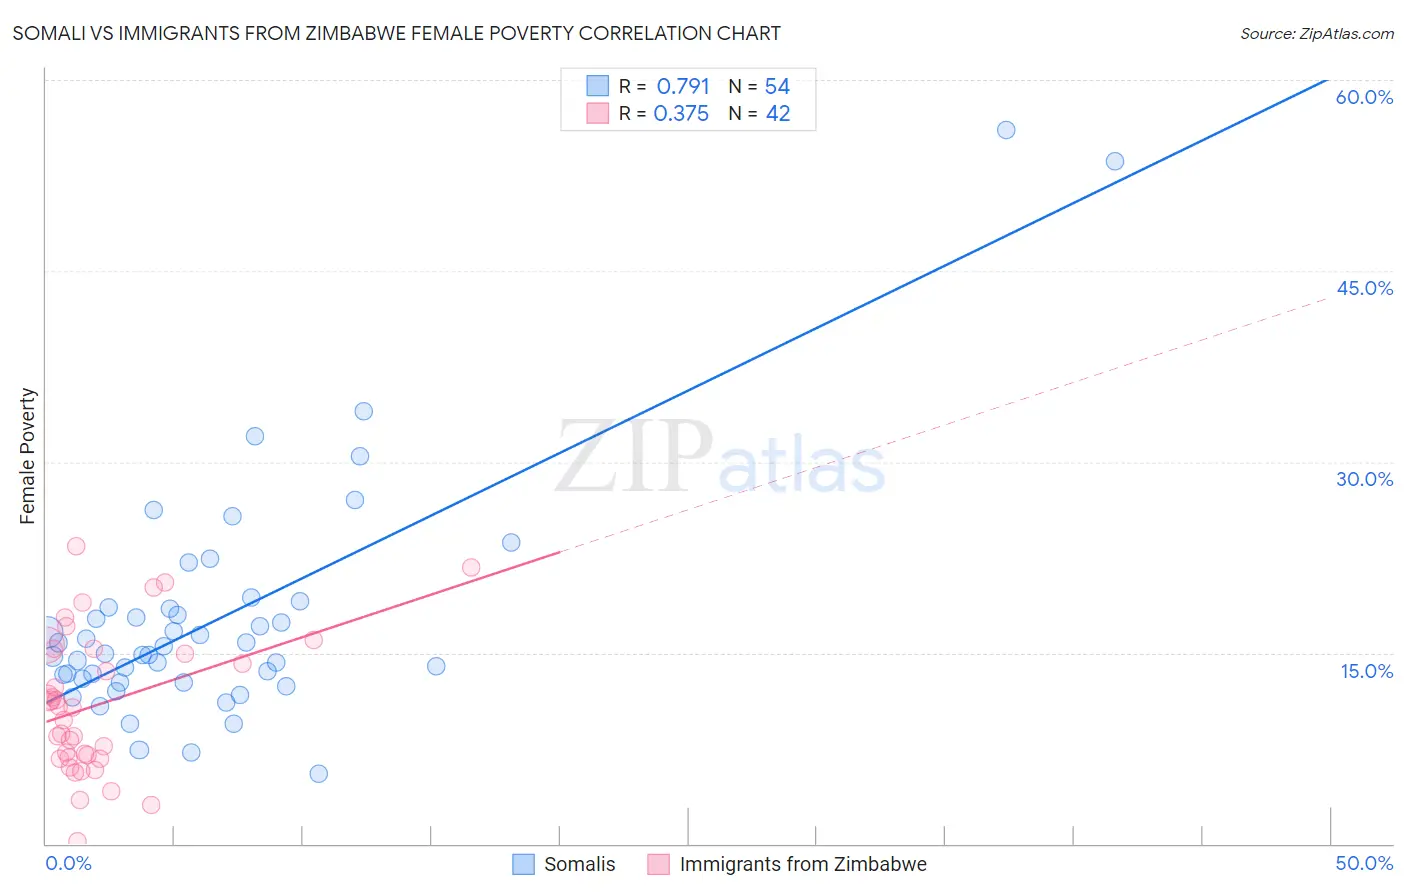
Somali vs Immigrants from Zimbabwe Female Poverty Correlation Chart
The statistical analysis conducted on geographies consisting of 99,282,230 people shows a strong positive correlation between the proportion of Somalis and poverty level among females in the United States with a correlation coefficient (R) of 0.791 and weighted average of 16.6%. Similarly, the statistical analysis conducted on geographies consisting of 117,784,385 people shows a mild positive correlation between the proportion of Immigrants from Zimbabwe and poverty level among females in the United States with a correlation coefficient (R) of 0.375 and weighted average of 12.6%, a difference of 31.4%.
Female Poverty Correlation Summary
| Measurement | Somali | Immigrants from Zimbabwe |
| Minimum | 5.5% | 0.23% |
| Maximum | 56.1% | 23.3% |
| Range | 50.6% | 23.1% |
| Mean | 17.8% | 11.0% |
| Median | 15.2% | 10.8% |
| Interquartile 25% (IQ1) | 13.0% | 6.7% |
| Interquartile 75% (IQ3) | 18.6% | 15.3% |
| Interquartile Range (IQR) | 5.6% | 8.6% |
| Standard Deviation (Sample) | 9.4% | 5.5% |
| Standard Deviation (Population) | 9.3% | 5.4% |
Similar Demographics by Female Poverty
Demographics Similar to Somalis by Female Poverty
In terms of female poverty, the demographic groups most similar to Somalis are Mexican (16.5%, a difference of 0.20%), Hispanic or Latino (16.6%, a difference of 0.52%), Bahamian (16.6%, a difference of 0.56%), Immigrants from Senegal (16.5%, a difference of 0.60%), and Senegalese (16.5%, a difference of 0.62%).
| Demographics | Rating | Rank | Female Poverty |
| Yaqui | 0.0 /100 | #291 | Tragic 16.4% |
| Immigrants | Zaire | 0.0 /100 | #292 | Tragic 16.4% |
| Immigrants | Latin America | 0.0 /100 | #293 | Tragic 16.4% |
| Immigrants | Cabo Verde | 0.0 /100 | #294 | Tragic 16.4% |
| Senegalese | 0.0 /100 | #295 | Tragic 16.5% |
| Immigrants | Senegal | 0.0 /100 | #296 | Tragic 16.5% |
| Mexicans | 0.0 /100 | #297 | Tragic 16.5% |
| Somalis | 0.0 /100 | #298 | Tragic 16.6% |
| Hispanics or Latinos | 0.0 /100 | #299 | Tragic 16.6% |
| Bahamians | 0.0 /100 | #300 | Tragic 16.6% |
| Guatemalans | 0.0 /100 | #301 | Tragic 16.7% |
| Chippewa | 0.0 /100 | #302 | Tragic 16.7% |
| Choctaw | 0.0 /100 | #303 | Tragic 16.8% |
| Immigrants | Central America | 0.0 /100 | #304 | Tragic 16.8% |
| Immigrants | Grenada | 0.0 /100 | #305 | Tragic 16.8% |
Demographics Similar to Immigrants from Zimbabwe by Female Poverty
In terms of female poverty, the demographic groups most similar to Immigrants from Zimbabwe are Portuguese (12.6%, a difference of 0.020%), Paraguayan (12.6%, a difference of 0.030%), Laotian (12.6%, a difference of 0.12%), Soviet Union (12.6%, a difference of 0.25%), and Immigrants from Turkey (12.6%, a difference of 0.31%).
| Demographics | Rating | Rank | Female Poverty |
| Immigrants | China | 94.5 /100 | #102 | Exceptional 12.5% |
| Slavs | 94.5 /100 | #103 | Exceptional 12.5% |
| Palestinians | 94.3 /100 | #104 | Exceptional 12.5% |
| Scottish | 94.1 /100 | #105 | Exceptional 12.5% |
| Immigrants | Turkey | 93.8 /100 | #106 | Exceptional 12.6% |
| Laotians | 93.4 /100 | #107 | Exceptional 12.6% |
| Portuguese | 93.1 /100 | #108 | Exceptional 12.6% |
| Immigrants | Zimbabwe | 93.1 /100 | #109 | Exceptional 12.6% |
| Paraguayans | 93.0 /100 | #110 | Exceptional 12.6% |
| Soviet Union | 92.4 /100 | #111 | Exceptional 12.6% |
| Immigrants | Israel | 92.0 /100 | #112 | Exceptional 12.6% |
| Canadians | 92.0 /100 | #113 | Exceptional 12.7% |
| Welsh | 91.6 /100 | #114 | Exceptional 12.7% |
| Puget Sound Salish | 91.5 /100 | #115 | Exceptional 12.7% |
| Immigrants | Russia | 91.2 /100 | #116 | Exceptional 12.7% |