Immigrants from Malaysia vs Immigrants from Syria Seniors Poverty Over the Age of 75
COMPARE
Immigrants from Malaysia
Immigrants from Syria
Seniors Poverty Over the Age of 75
Seniors Poverty Over the Age of 75 Comparison
Immigrants from Malaysia
Immigrants from Syria
12.3%
SENIORS POVERTY OVER THE AGE OF 75
35.8/ 100
METRIC RATING
185th/ 347
METRIC RANK
12.2%
SENIORS POVERTY OVER THE AGE OF 75
53.9/ 100
METRIC RATING
168th/ 347
METRIC RANK
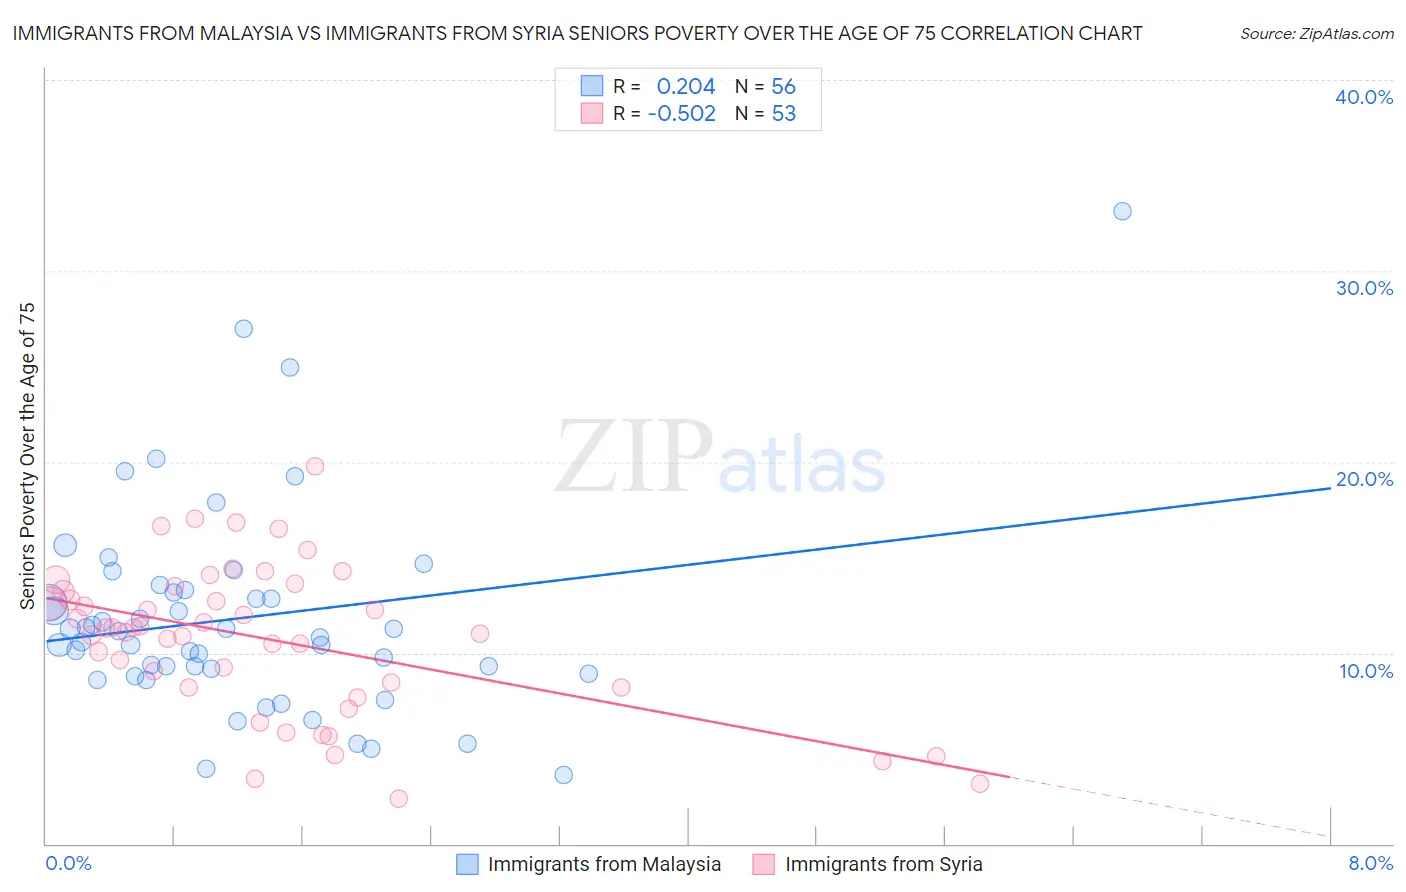
Immigrants from Malaysia vs Immigrants from Syria Seniors Poverty Over the Age of 75 Correlation Chart
The statistical analysis conducted on geographies consisting of 196,850,281 people shows a weak positive correlation between the proportion of Immigrants from Malaysia and poverty level among seniors over the age of 75 in the United States with a correlation coefficient (R) of 0.204 and weighted average of 12.3%. Similarly, the statistical analysis conducted on geographies consisting of 173,460,878 people shows a substantial negative correlation between the proportion of Immigrants from Syria and poverty level among seniors over the age of 75 in the United States with a correlation coefficient (R) of -0.502 and weighted average of 12.2%, a difference of 1.5%.
Seniors Poverty Over the Age of 75 Correlation Summary
| Measurement | Immigrants from Malaysia | Immigrants from Syria |
| Minimum | 3.6% | 2.4% |
| Maximum | 33.1% | 19.7% |
| Range | 29.6% | 17.4% |
| Mean | 11.8% | 10.7% |
| Median | 11.0% | 11.3% |
| Interquartile 25% (IQ1) | 9.0% | 8.2% |
| Interquartile 75% (IQ3) | 13.2% | 13.4% |
| Interquartile Range (IQR) | 4.2% | 5.2% |
| Standard Deviation (Sample) | 5.4% | 3.9% |
| Standard Deviation (Population) | 5.4% | 3.9% |
Demographics Similar to Immigrants from Malaysia and Immigrants from Syria by Seniors Poverty Over the Age of 75
In terms of seniors poverty over the age of 75, the demographic groups most similar to Immigrants from Malaysia are Kiowa (12.3%, a difference of 0.010%), Laotian (12.3%, a difference of 0.20%), Sri Lankan (12.4%, a difference of 0.31%), German Russian (12.3%, a difference of 0.48%), and Immigrants from Australia (12.2%, a difference of 0.71%). Similarly, the demographic groups most similar to Immigrants from Syria are Immigrants from Egypt (12.2%, a difference of 0.010%), Immigrants from Switzerland (12.1%, a difference of 0.050%), Egyptian (12.1%, a difference of 0.080%), Immigrants from Thailand (12.2%, a difference of 0.15%), and Spaniard (12.2%, a difference of 0.19%).
| Demographics | Rating | Rank | Seniors Poverty Over the Age of 75 |
| Egyptians | 54.8 /100 | #166 | Average 12.1% |
| Immigrants | Switzerland | 54.5 /100 | #167 | Average 12.1% |
| Immigrants | Syria | 53.9 /100 | #168 | Average 12.2% |
| Immigrants | Egypt | 53.7 /100 | #169 | Average 12.2% |
| Immigrants | Thailand | 52.0 /100 | #170 | Average 12.2% |
| Spaniards | 51.6 /100 | #171 | Average 12.2% |
| Immigrants | Fiji | 51.5 /100 | #172 | Average 12.2% |
| Arabs | 50.5 /100 | #173 | Average 12.2% |
| Immigrants | Europe | 50.0 /100 | #174 | Average 12.2% |
| Immigrants | Saudi Arabia | 49.5 /100 | #175 | Average 12.2% |
| Immigrants | Iran | 48.1 /100 | #176 | Average 12.2% |
| Immigrants | Asia | 47.8 /100 | #177 | Average 12.2% |
| Immigrants | Nonimmigrants | 46.8 /100 | #178 | Average 12.2% |
| Mongolians | 45.5 /100 | #179 | Average 12.2% |
| Immigrants | South Eastern Asia | 44.3 /100 | #180 | Average 12.2% |
| Immigrants | Australia | 44.2 /100 | #181 | Average 12.2% |
| German Russians | 41.4 /100 | #182 | Average 12.3% |
| Laotians | 38.2 /100 | #183 | Fair 12.3% |
| Kiowa | 36.0 /100 | #184 | Fair 12.3% |
| Immigrants | Malaysia | 35.8 /100 | #185 | Fair 12.3% |
| Sri Lankans | 32.3 /100 | #186 | Fair 12.4% |