Somali vs Immigrants from China Receiving Food Stamps
COMPARE
Somali
Immigrants from China
Receiving Food Stamps
Receiving Food Stamps Comparison
Somalis
Immigrants from China
13.7%
RECEIVING FOOD STAMPS
0.9/ 100
METRIC RATING
243rd/ 347
METRIC RANK
9.6%
RECEIVING FOOD STAMPS
99.5/ 100
METRIC RATING
42nd/ 347
METRIC RANK
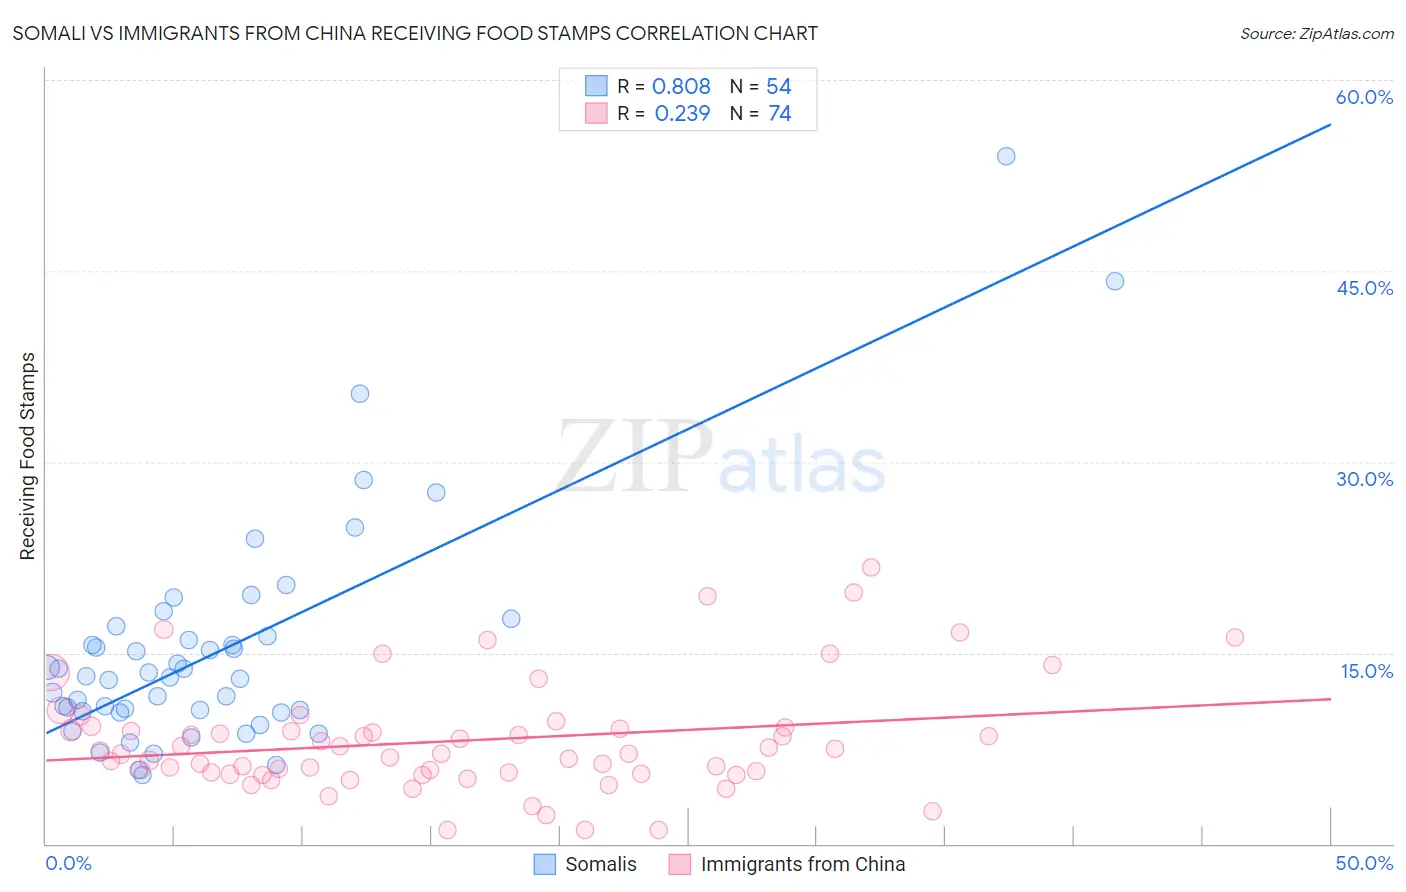
Somali vs Immigrants from China Receiving Food Stamps Correlation Chart
The statistical analysis conducted on geographies consisting of 99,256,962 people shows a very strong positive correlation between the proportion of Somalis and percentage of population receiving government assistance and/or food stamps in the United States with a correlation coefficient (R) of 0.808 and weighted average of 13.7%. Similarly, the statistical analysis conducted on geographies consisting of 454,770,317 people shows a weak positive correlation between the proportion of Immigrants from China and percentage of population receiving government assistance and/or food stamps in the United States with a correlation coefficient (R) of 0.239 and weighted average of 9.6%, a difference of 42.8%.
Receiving Food Stamps Correlation Summary
| Measurement | Somali | Immigrants from China |
| Minimum | 5.4% | 1.1% |
| Maximum | 54.0% | 21.7% |
| Range | 48.6% | 20.6% |
| Mean | 15.2% | 8.1% |
| Median | 13.1% | 7.1% |
| Interquartile 25% (IQ1) | 10.4% | 5.5% |
| Interquartile 75% (IQ3) | 16.3% | 9.1% |
| Interquartile Range (IQR) | 5.9% | 3.6% |
| Standard Deviation (Sample) | 9.0% | 4.3% |
| Standard Deviation (Population) | 8.9% | 4.3% |
Similar Demographics by Receiving Food Stamps
Demographics Similar to Somalis by Receiving Food Stamps
In terms of receiving food stamps, the demographic groups most similar to Somalis are Cajun (13.7%, a difference of 0.16%), Immigrants from Panama (13.6%, a difference of 0.19%), Immigrants from Somalia (13.7%, a difference of 0.20%), Choctaw (13.6%, a difference of 0.38%), and Cree (13.7%, a difference of 0.44%).
| Demographics | Rating | Rank | Receiving Food Stamps |
| Crow | 1.6 /100 | #236 | Tragic 13.4% |
| Immigrants | El Salvador | 1.5 /100 | #237 | Tragic 13.5% |
| French American Indians | 1.4 /100 | #238 | Tragic 13.5% |
| Immigrants | Micronesia | 1.3 /100 | #239 | Tragic 13.5% |
| Iroquois | 1.2 /100 | #240 | Tragic 13.5% |
| Choctaw | 1.0 /100 | #241 | Tragic 13.6% |
| Immigrants | Panama | 1.0 /100 | #242 | Tragic 13.6% |
| Somalis | 0.9 /100 | #243 | Tragic 13.7% |
| Cajuns | 0.9 /100 | #244 | Tragic 13.7% |
| Immigrants | Somalia | 0.9 /100 | #245 | Tragic 13.7% |
| Cree | 0.8 /100 | #246 | Tragic 13.7% |
| Mexican American Indians | 0.7 /100 | #247 | Tragic 13.8% |
| Immigrants | Laos | 0.7 /100 | #248 | Tragic 13.8% |
| Indonesians | 0.6 /100 | #249 | Tragic 13.9% |
| Immigrants | Cambodia | 0.5 /100 | #250 | Tragic 13.9% |
Demographics Similar to Immigrants from China by Receiving Food Stamps
In terms of receiving food stamps, the demographic groups most similar to Immigrants from China are Cambodian (9.5%, a difference of 0.25%), Croatian (9.6%, a difference of 0.30%), Immigrants from Netherlands (9.5%, a difference of 0.42%), Immigrants from Bolivia (9.5%, a difference of 0.43%), and Immigrants from Sri Lanka (9.5%, a difference of 0.44%).
| Demographics | Rating | Rank | Receiving Food Stamps |
| Immigrants | Austria | 99.6 /100 | #35 | Exceptional 9.5% |
| Estonians | 99.6 /100 | #36 | Exceptional 9.5% |
| Europeans | 99.6 /100 | #37 | Exceptional 9.5% |
| Immigrants | Sri Lanka | 99.5 /100 | #38 | Exceptional 9.5% |
| Immigrants | Bolivia | 99.5 /100 | #39 | Exceptional 9.5% |
| Immigrants | Netherlands | 99.5 /100 | #40 | Exceptional 9.5% |
| Cambodians | 99.5 /100 | #41 | Exceptional 9.5% |
| Immigrants | China | 99.5 /100 | #42 | Exceptional 9.6% |
| Croatians | 99.5 /100 | #43 | Exceptional 9.6% |
| Immigrants | Denmark | 99.4 /100 | #44 | Exceptional 9.6% |
| Immigrants | Belgium | 99.4 /100 | #45 | Exceptional 9.6% |
| Australians | 99.4 /100 | #46 | Exceptional 9.6% |
| Indians (Asian) | 99.4 /100 | #47 | Exceptional 9.6% |
| Russians | 99.4 /100 | #48 | Exceptional 9.6% |
| Immigrants | Czechoslovakia | 99.4 /100 | #49 | Exceptional 9.6% |