Somali vs Immigrants from Barbados Receiving Food Stamps
COMPARE
Somali
Immigrants from Barbados
Receiving Food Stamps
Receiving Food Stamps Comparison
Somalis
Immigrants from Barbados
13.7%
RECEIVING FOOD STAMPS
0.9/ 100
METRIC RATING
243rd/ 347
METRIC RANK
16.6%
RECEIVING FOOD STAMPS
0.0/ 100
METRIC RATING
310th/ 347
METRIC RANK
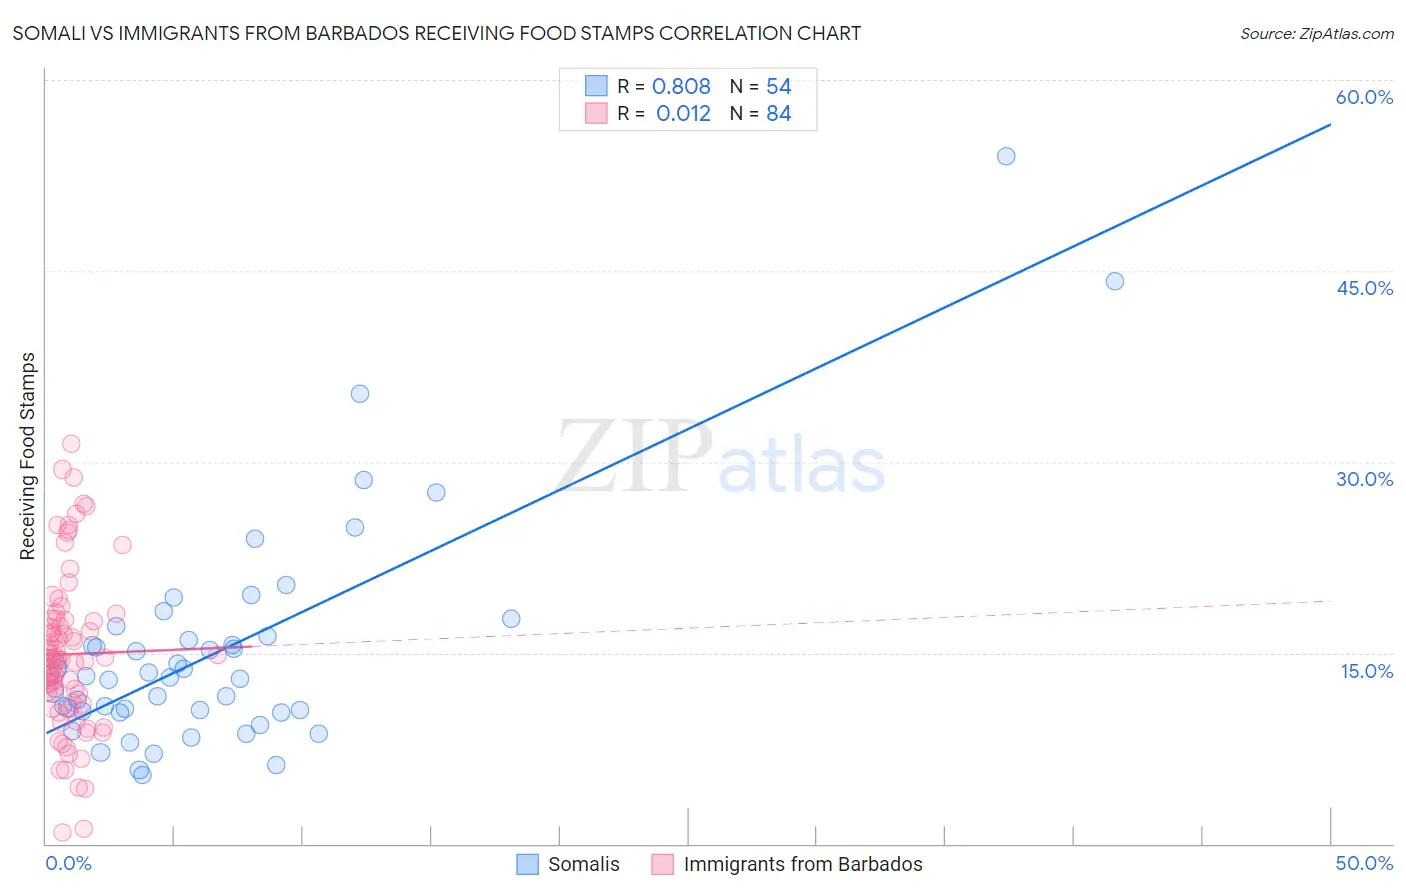
Somali vs Immigrants from Barbados Receiving Food Stamps Correlation Chart
The statistical analysis conducted on geographies consisting of 99,256,962 people shows a very strong positive correlation between the proportion of Somalis and percentage of population receiving government assistance and/or food stamps in the United States with a correlation coefficient (R) of 0.808 and weighted average of 13.7%. Similarly, the statistical analysis conducted on geographies consisting of 112,654,620 people shows no correlation between the proportion of Immigrants from Barbados and percentage of population receiving government assistance and/or food stamps in the United States with a correlation coefficient (R) of 0.012 and weighted average of 16.6%, a difference of 21.7%.
Receiving Food Stamps Correlation Summary
| Measurement | Somali | Immigrants from Barbados |
| Minimum | 5.4% | 0.90% |
| Maximum | 54.0% | 31.4% |
| Range | 48.6% | 30.5% |
| Mean | 15.2% | 14.9% |
| Median | 13.1% | 14.5% |
| Interquartile 25% (IQ1) | 10.4% | 11.0% |
| Interquartile 75% (IQ3) | 16.3% | 17.6% |
| Interquartile Range (IQR) | 5.9% | 6.6% |
| Standard Deviation (Sample) | 9.0% | 6.2% |
| Standard Deviation (Population) | 8.9% | 6.2% |
Similar Demographics by Receiving Food Stamps
Demographics Similar to Somalis by Receiving Food Stamps
In terms of receiving food stamps, the demographic groups most similar to Somalis are Cajun (13.7%, a difference of 0.16%), Immigrants from Panama (13.6%, a difference of 0.19%), Immigrants from Somalia (13.7%, a difference of 0.20%), Choctaw (13.6%, a difference of 0.38%), and Cree (13.7%, a difference of 0.44%).
| Demographics | Rating | Rank | Receiving Food Stamps |
| Crow | 1.6 /100 | #236 | Tragic 13.4% |
| Immigrants | El Salvador | 1.5 /100 | #237 | Tragic 13.5% |
| French American Indians | 1.4 /100 | #238 | Tragic 13.5% |
| Immigrants | Micronesia | 1.3 /100 | #239 | Tragic 13.5% |
| Iroquois | 1.2 /100 | #240 | Tragic 13.5% |
| Choctaw | 1.0 /100 | #241 | Tragic 13.6% |
| Immigrants | Panama | 1.0 /100 | #242 | Tragic 13.6% |
| Somalis | 0.9 /100 | #243 | Tragic 13.7% |
| Cajuns | 0.9 /100 | #244 | Tragic 13.7% |
| Immigrants | Somalia | 0.9 /100 | #245 | Tragic 13.7% |
| Cree | 0.8 /100 | #246 | Tragic 13.7% |
| Mexican American Indians | 0.7 /100 | #247 | Tragic 13.8% |
| Immigrants | Laos | 0.7 /100 | #248 | Tragic 13.8% |
| Indonesians | 0.6 /100 | #249 | Tragic 13.9% |
| Immigrants | Cambodia | 0.5 /100 | #250 | Tragic 13.9% |
Demographics Similar to Immigrants from Barbados by Receiving Food Stamps
In terms of receiving food stamps, the demographic groups most similar to Immigrants from Barbados are Guyanese (16.7%, a difference of 0.52%), U.S. Virgin Islander (16.5%, a difference of 0.56%), Barbadian (16.5%, a difference of 0.79%), Houma (16.5%, a difference of 1.1%), and Sioux (16.8%, a difference of 1.2%).
| Demographics | Rating | Rank | Receiving Food Stamps |
| Nicaraguans | 0.0 /100 | #303 | Tragic 16.1% |
| West Indians | 0.0 /100 | #304 | Tragic 16.3% |
| Immigrants | Azores | 0.0 /100 | #305 | Tragic 16.4% |
| Jamaicans | 0.0 /100 | #306 | Tragic 16.4% |
| Houma | 0.0 /100 | #307 | Tragic 16.5% |
| Barbadians | 0.0 /100 | #308 | Tragic 16.5% |
| U.S. Virgin Islanders | 0.0 /100 | #309 | Tragic 16.5% |
| Immigrants | Barbados | 0.0 /100 | #310 | Tragic 16.6% |
| Guyanese | 0.0 /100 | #311 | Tragic 16.7% |
| Sioux | 0.0 /100 | #312 | Tragic 16.8% |
| Immigrants | Jamaica | 0.0 /100 | #313 | Tragic 16.9% |
| Immigrants | Guyana | 0.0 /100 | #314 | Tragic 16.9% |
| Bahamians | 0.0 /100 | #315 | Tragic 17.0% |
| Central American Indians | 0.0 /100 | #316 | Tragic 17.1% |
| Blacks/African Americans | 0.0 /100 | #317 | Tragic 17.2% |