Puerto Rican vs Immigrants from Barbados Receiving Food Stamps
COMPARE
Puerto Rican
Immigrants from Barbados
Receiving Food Stamps
Receiving Food Stamps Comparison
Puerto Ricans
Immigrants from Barbados
26.0%
RECEIVING FOOD STAMPS
0.0/ 100
METRIC RATING
346th/ 347
METRIC RANK
16.6%
RECEIVING FOOD STAMPS
0.0/ 100
METRIC RATING
310th/ 347
METRIC RANK
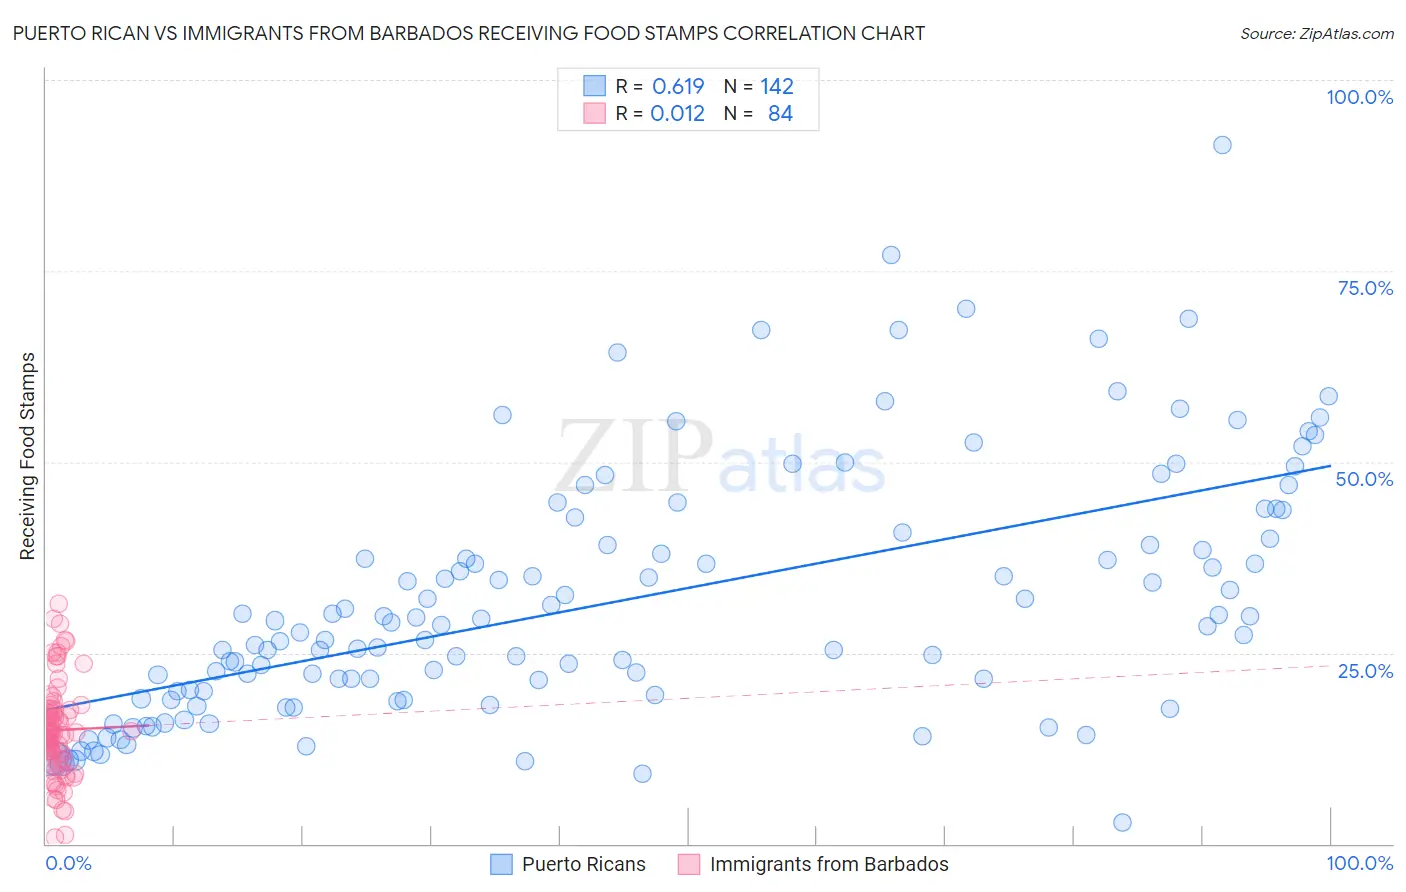
Puerto Rican vs Immigrants from Barbados Receiving Food Stamps Correlation Chart
The statistical analysis conducted on geographies consisting of 525,950,641 people shows a significant positive correlation between the proportion of Puerto Ricans and percentage of population receiving government assistance and/or food stamps in the United States with a correlation coefficient (R) of 0.619 and weighted average of 26.0%. Similarly, the statistical analysis conducted on geographies consisting of 112,654,620 people shows no correlation between the proportion of Immigrants from Barbados and percentage of population receiving government assistance and/or food stamps in the United States with a correlation coefficient (R) of 0.012 and weighted average of 16.6%, a difference of 56.2%.
Receiving Food Stamps Correlation Summary
| Measurement | Puerto Rican | Immigrants from Barbados |
| Minimum | 2.8% | 0.90% |
| Maximum | 91.5% | 31.4% |
| Range | 88.7% | 30.5% |
| Mean | 31.7% | 14.9% |
| Median | 28.6% | 14.5% |
| Interquartile 25% (IQ1) | 19.5% | 11.0% |
| Interquartile 75% (IQ3) | 40.0% | 17.6% |
| Interquartile Range (IQR) | 20.5% | 6.6% |
| Standard Deviation (Sample) | 16.3% | 6.2% |
| Standard Deviation (Population) | 16.3% | 6.2% |
Similar Demographics by Receiving Food Stamps
Demographics Similar to Puerto Ricans by Receiving Food Stamps
In terms of receiving food stamps, the demographic groups most similar to Puerto Ricans are Immigrants from Cabo Verde (23.8%, a difference of 8.9%), Lumbee (22.9%, a difference of 13.3%), Immigrants from Dominican Republic (22.1%, a difference of 17.3%), Immigrants from Yemen (21.6%, a difference of 20.0%), and Hopi (21.6%, a difference of 20.5%).
| Demographics | Rating | Rank | Receiving Food Stamps |
| Inupiat | 0.0 /100 | #333 | Tragic 20.1% |
| Yuman | 0.0 /100 | #334 | Tragic 20.2% |
| Immigrants | Cuba | 0.0 /100 | #335 | Tragic 20.8% |
| Navajo | 0.0 /100 | #336 | Tragic 21.1% |
| Cape Verdeans | 0.0 /100 | #337 | Tragic 21.1% |
| Dominicans | 0.0 /100 | #338 | Tragic 21.4% |
| Yakama | 0.0 /100 | #339 | Tragic 21.4% |
| Tohono O'odham | 0.0 /100 | #340 | Tragic 21.5% |
| Hopi | 0.0 /100 | #341 | Tragic 21.6% |
| Immigrants | Yemen | 0.0 /100 | #342 | Tragic 21.6% |
| Immigrants | Dominican Republic | 0.0 /100 | #343 | Tragic 22.1% |
| Lumbee | 0.0 /100 | #344 | Tragic 22.9% |
| Immigrants | Cabo Verde | 0.0 /100 | #345 | Tragic 23.8% |
| Puerto Ricans | 0.0 /100 | #346 | Tragic 26.0% |
| Yup'ik | 0.0 /100 | #347 | Tragic 32.7% |
Demographics Similar to Immigrants from Barbados by Receiving Food Stamps
In terms of receiving food stamps, the demographic groups most similar to Immigrants from Barbados are Guyanese (16.7%, a difference of 0.52%), U.S. Virgin Islander (16.5%, a difference of 0.56%), Barbadian (16.5%, a difference of 0.79%), Houma (16.5%, a difference of 1.1%), and Sioux (16.8%, a difference of 1.2%).
| Demographics | Rating | Rank | Receiving Food Stamps |
| Nicaraguans | 0.0 /100 | #303 | Tragic 16.1% |
| West Indians | 0.0 /100 | #304 | Tragic 16.3% |
| Immigrants | Azores | 0.0 /100 | #305 | Tragic 16.4% |
| Jamaicans | 0.0 /100 | #306 | Tragic 16.4% |
| Houma | 0.0 /100 | #307 | Tragic 16.5% |
| Barbadians | 0.0 /100 | #308 | Tragic 16.5% |
| U.S. Virgin Islanders | 0.0 /100 | #309 | Tragic 16.5% |
| Immigrants | Barbados | 0.0 /100 | #310 | Tragic 16.6% |
| Guyanese | 0.0 /100 | #311 | Tragic 16.7% |
| Sioux | 0.0 /100 | #312 | Tragic 16.8% |
| Immigrants | Jamaica | 0.0 /100 | #313 | Tragic 16.9% |
| Immigrants | Guyana | 0.0 /100 | #314 | Tragic 16.9% |
| Bahamians | 0.0 /100 | #315 | Tragic 17.0% |
| Central American Indians | 0.0 /100 | #316 | Tragic 17.1% |
| Blacks/African Americans | 0.0 /100 | #317 | Tragic 17.2% |